
What is survey data analysis?
Survey analysis is the process of turning the raw material of your survey data into insights and answers you can use to improve things for your business. It’s an essential part of doing survey-based research.
There are a huge number of survey data analysis methods available, from simple cross-tabulation, where data from your survey responses is arranged into rows and columns that make it easier to understand, to statistical methods for survey data analysis which tell you things you could never work out on your own, such as whether the results you’re seeing have statistical significance.
Watch a Free Demo: XM for Strategic Research
Types of survey data
Different kinds of survey questions yield data in different forms. Here’s a quick guide to a few of them. Often, survey data will belong to more than one of these categories as they frequently overlap.
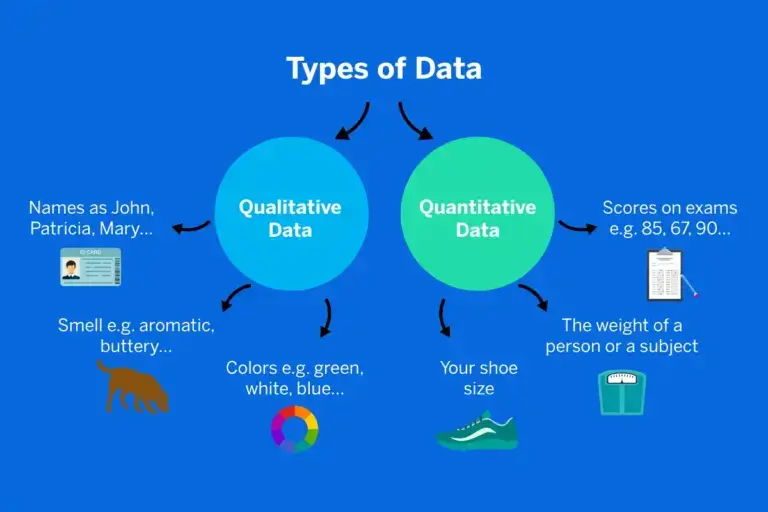
Quantitative data vs. qualitative data
What’s the difference between qualitative data and quantitative data?
- Quantitative data, aka numerical data, involves numerical values and quantities. An example of quantitative data would be the number of times a customer has visited a location, the temperature of a city or the scores achieved in an NPS survey.
- Qualitative data is information that isn’t numerical. It may be verbal or visual, or consist of spoken audio or video. It’s more likely to be descriptive or subjective, although it doesn’t have to be. Qualitative data highlights the “why” behind the what.
Closed-ended questions
These are questions with a limited range of responses. They could be a ‘yes’ or ‘no’ question such as ‘do you live in Portland, OR?’. Closed-ended questions can also take the form of multiple-choice, ranking, or drop-down menu items. Respondents can’t qualify their choice between the options or explain why they chose which one they did.
This type of question produces structured data that is easy to sort, code and quantify since the responses will fit into a limited number of ‘buckets’. However, its simplicity means you lose out on some of the finer details that respondents could have provided.
Natural language data (open-ended questions)
Answers written in the respondent’s own words are also a form of survey data. This type of response is usually given in open field (text box) question formats. Questions might begin with ‘how,’ ‘why,’ ‘describe…’ or other conversational phrases that encourage the respondent to open up.
This type of data, known as unstructured data, is rich in information. It typically requires advanced tools such as Natural Language Processing and sentiment analysis to extract the full value from how the respondents answered, because of its complexity and volume.
Categorical (nominal) data
This kind of data exists in categories that have no hierarchical relationship to each other. No item is treated as being more or less, better or worse, than the others. Examples would be primary colors (red v. blue), genders (male v female) or brand names (Chrysler v Mitsubishi).
Multiple choice questions often produce this kind of data (though not always).
Ordinal data
Unlike categorical data, ordinal data has an intrinsic rank that relates to quantity or quality, such as degrees of preference, or how strongly someone agrees or disagrees with a statement.
Likert scales and ranking scales often serve up this kind of data.

Scalar data
Like ordinal data, scalar data deals with quantity and quality on a relative basis, with some items ranking above others. What makes it different is that it uses an established scale, such as age (expressed as a number), test scores (out of 100), or time (in days, hours, minutes etc.)
You might get this kind of data from a drop-down or sliding scale question format, among others.
The type of data you receive affects the kind of survey results analysis you’ll be doing, so it’s very important to consider the type of survey data you will end up with when you’re writing your survey questions and designing survey flows.
Steps to analyze your survey data
Here’s an overview of how you can analyze survey data, identify trends and hopefully draw meaningful conclusions from your research.
1. Review your research questions
Research questions are the underlying questions your survey seeks to answer. Research questions are not the same as the questions in your questionnaire, although they may cover similar ground.
It’s important to review your research questions before you analyze your survey data to determine if it aligns with what you want to accomplish and find out from your data.
2. Cross-tabulate your data
Cross-tabulation is a valuable step in sifting through your data and uncovering its meaning. When you cross-tabulate, you’re breaking out your data according to the sub-groups within your research population or your sample, and comparing the relationship between one variable and another. The table you produce will give you an overall picture of how responses vary among your subgroups.
Target the survey questions that best address your research question. For example, if you want to know how many people would be interested in buying from you in the future, cross-tabulating the data will help you see whether some groups were more likely than others to want to return. This gives you an idea of where to focus your efforts when improving your product design or your customer experience.
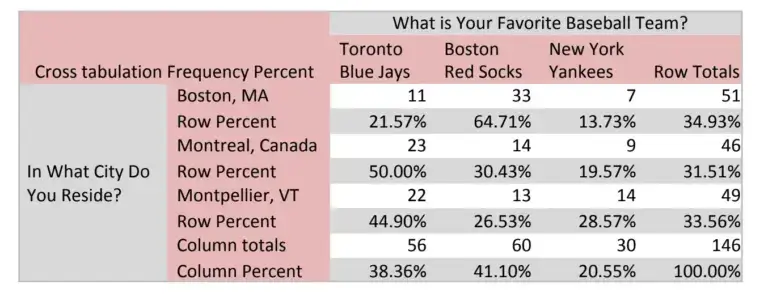
Cross-tabulation works best for categorical data and other types of structured data. You can cross-tabulate your data in multiple ways across different questions and sub-groups using survey analysis software. Be aware, though, that slicing and dicing your data very finely will give you a smaller sample size, which then affects the reliability of your results.
1. Review and investigate your results
Put your results in context – how have things changed since the last time you researched these kinds of questions? Do your findings tie in to changes in your market or other research done within your company?
Look at how different demographics within your sample or research population have answered, and compare your findings to other data on these groups. For example, does your survey analysis tell you something about why a certain group is purchasing less, or more? Does the data tell you anything about how well your company is meeting strategic goals, such as changing brand perceptions or appealing to a younger market?
Look at quantitative measures too. Which questions were answered the most? Which ones produced the most polarized responses? Were there any questions with very skewed data? This could be a clue to issues with survey design.
2. Use statistical analysis to check your findings
Statistics give you certainty (or as close to it as you can get) about the results of your survey. Statistical tools like T-test, regression and ANOVA help you make sure that the results you’re seeing have statistical significance and aren’t just there by chance.
Statistical tools can also help you determine which aspects of your data are most important, and what kinds of relationships – if any – they have with one another.
Benchmarking your survey data
One of the most powerful aspects of survey data analysis is its ability to build on itself. By repeating market research surveys at different points in time, you can not only use it to uncover insights from your results, but to strengthen those insights over time.
Using consistent types of data and methods of analysis means you can use your initial results as a benchmark for future research. What’s changed year-on-year? Has your survey data followed a steady rise, performed a sudden leap or fallen incrementally? Over time, all these questions become answerable when you listen regularly and analyze your data consistently.
Maintaining your question and data types and your data analysis methods means you achieve a like-for-like measurement of results over time. And if you collect data consistently enough to see patterns and processes emerging, you can use these to make predictions about future events and outcomes.
Another benefit of data analysis over time is that you can compare your results with other people’s, provided you are using the same measurements and metrics. A classic example is NPS (Net Promoter Score), which has become a standard measurement of customer experience that companies typically track over time.
How to present survey results
Most data isn’t very friendly to the human eye or brain in its raw form. Survey data analysis helps you turn your data into something that’s accessible, intuitive, and even interesting to a wide range of people.
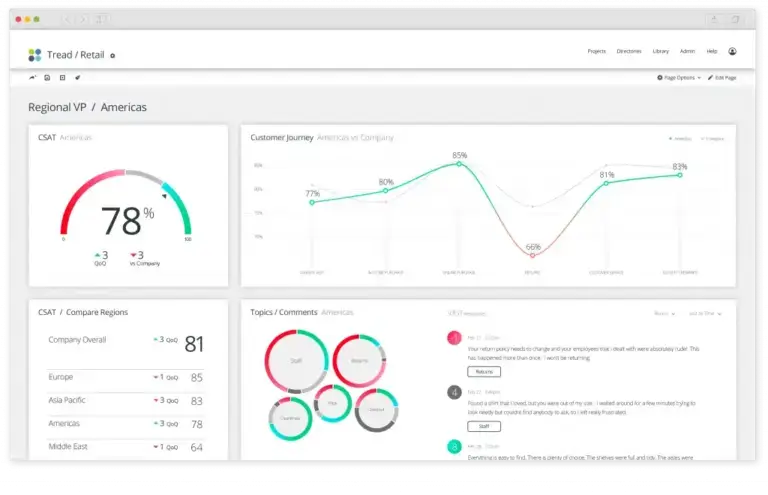
1. Make it visual
You can present data in a visual form, such as a chart or graph, or put it into a tabular form so it’s easy for people to see the relationships between variables in your crosstab analysis. Choose a graphic format that best suits your data type and clearly shows the results to the untrained eye. There are plenty of options, including linear graphs, bar graphs, Venn diagrams, word clouds and pie charts. If time and budget allows, you can create an infographic or animation.
2. Keep language human
You can express discoveries in plain language, for example, in phrases like “customers in the USA consistently preferred potato chips to corn chips.” Adding direct quotes from your natural language data (provided respondents have consented to this) can add immediacy and illustrate your points.
3. Tell the story of your research
Another approach is to express data using the power of storytelling, using a beginning-middle-end or situation-crisis-resolution structure to talk about how trends have emerged or challenges have been overcome. This helps people understand the context of your research and why you did it the way you did.
4. Include your insights
As well as presenting your data in terms of numbers and proportions, always be sure to share the insights it has produced too. Insights come when you apply knowledge and ideas to the data in the survey, which means they’re often more striking and easier to grasp than the data by itself. Insights may take the form of a recommended action, or examine how two different data points are connected.
Common mistakes in analyzing data and how to avoid them
1. Being too quick to interpret survey results
It’s easy to get carried away when the data seems to show the results you were expecting or confirms a hypothesis you started with. This is why it’s so important to use statistics to make sure your survey report is statistically significant, i.e. based on reality, not a coincidence. Remember that a skewed or coincidental result becomes more likely with a smaller sample size.
2. Treating correlation like causation
You may have heard the phrase “correlation is not causation” before. It’s well-known for a reason: mistaking a link between two independent variables as a causal relationship between them is a common pitfall in research. Results can correlate without one having a direct effect on the other.
An example is when there is another common variable involved that isn’t measured and acts as a kind of missing link between the correlated variables. Sales of sunscreen might go up in line with the number of ice-creams sold at the beach, but it’s not because there’s something about ice-cream that makes people more vulnerable to getting sunburned. It’s because a third variable – sunshine – affects both sunscreen use and ice-cream sales.
3. Missing the nuances in qualitative natural language data
Human language is complex, and analyzing survey data in the form of speech or text isn’t as straightforward as mapping vocabulary items to positive or negative codes. The latest AI solutions go further, uncovering meaning, emotion and intent within human language.
Trusting your rich qualitative data to an AI’s interpretation means relying on the software’s ability to understand language in the way a human would, taking into account things like context and conversational dynamics. If you’re investing in software to analyze natural language data in your surveys, make sure it’s capable of sentiment analysis that uses machine learning to get a deeper understanding of what survey respondents are trying to tell you.
Tools for survey analysis
If you’re planning to run an ongoing data insights program (and we recommend that you do), it’s important to have tools on hand that make it easy and efficient to perform your research and extract valuable insights from the results.
It’s even better if those tools help you to share your findings with the right people, at the right time, in a format that works for them. Here are a few attributes to look for in a survey analysis software platform.
- Easy to use (for non-experts)
Look for software that demands minimal training or expertise, and you’ll save time and effort while maximizing the number of people who can pitch in on your experience management program. User-friendly drag-and-drop interfaces, straightforward menus, and automated data analysis are all worth looking out for. - Works on any platform
Don’t restrict your team to a single place where software is located on a few terminals. Instead, choose a cloud-based platform that’s optimized for mobile, desktop, tablet and more. - Integrates with your existing setup
Stand-alone analysis tools create additional work you shouldn’t have to do. Why export, convert, paste and print out when you can use a software tool that plugs straight into your existing systems via API? - Incorporates statistical analysis
Choose a system that gives you the tools to not just process and present your data, but refine your survey results using statistical tools that generate deep insights and future predictions with just a few clicks. - Comes with first-class support
The best survey data tool is one that scales with you and adapts to your goals and growth. A large part of that is having an expert team on call to answer questions, propose bespoke solutions, and help you get the most out of the service you’ve paid for.
Tips from the team at Qualtrics
We’ve run more than a few survey research programs in our time, and we have some tips to share that you may not find in the average survey data analysis guide. Here are some innovative ways to help make sure your survey analysis hits the mark, grabs attention, and provokes change.
Write the headlines
The #1 way to make your research hit the mark is to start with the end in mind. Before you even write your survey questions, make sample headlines of what the survey will discover. Sample headlines are the main data takeaways from your research. Some sample headlines might be:
- The #1 concern that travelers have with staying at our hotel is X
- X% of visitors to our showroom want to be approached by a salesperson within the first 10 minutes
- Diners are X% more likely to choose our new lunch menu than our old one
You may even want to sketch out mock charts that show how the data will look in your results. If you “write” the results first, those results become a guide to help you design questions that ensure you get the data you want.
Gut Data Gut
We live in a data-driven society. Marketing is a data-driven business function. But don’t be afraid to overlap qualitative research findings onto your quantitative data. Don’t be hesitant to apply what you know in your gut with what you know from the data.
This is called “Gut Data Gut”. Check your gut, check your data, and check your gut. If you have personal experience with the research topic, use it! If you have qualitative research that supports the data, use it!
Your survey is one star in a constellation of information that combines to tell a story. Use every atom of information at your disposal. Just be sure to let your audience know when you are showing them findings from statistically significant research and when it comes from a different source.
Write a mock press release to encourage taking action
One of the biggest challenges of research is acting on it. This is sometimes called the “Knowing / Doing Gap” where an organization has a difficult time implementing truths they know.
One way you can ignite change with your research is to write a press release dated six months into the future that proudly announces all the changes as a result of your research. Maybe it touts the three new features that were added to your product. Perhaps it introduces your new approach to technical support. Maybe it outlines the improvements to your website.
After six months, gather your team and read the press release together to see how well you executed change based on the research.
Focus your research findings
Everyone consumes information differently. Some people want to fly over your findings at 30,000 feet and others want to slog through the weeds in their rubber boots. You should package your research for these different research consumer types.
Package your survey results analysis findings in 5 ways:
- A 1-page executive summary with key insights
- A 1-page stat sheet that ticks off the top supporting stats
- A shareable slide deck with data visuals that can be understood as a stand-alone or by being presented in person
- Live dashboards with all the survey data that allow team members to filter the data and dig in as deeply as they want on a DIY basis
- The Mock Press Release (mentioned above)
How to analyze survey data
Reporting on survey results will prove the value of your work. Learn more about statistical analysis types or jump into an analysis type below to see our favorite tools of the trade: