
When you want to conduct a survey analysis and compare the results for one or more variables with the results of another, there’s only one solution: cross-tabulation.
Cross-tabulation (also cross-tabulation or crosstab) is one of the most useful analytical tools and a mainstay of the market research industry. Cross-tabulation analysis, also known as contingency table analysis, is most often used to analyze categorical (nominal measurement scale) data.
At their core, cross-tabulations are simply data tables that present the results of the entire group of respondents, as well as results from subgroups of survey respondents. With them, you can examine relationships within the data that might not be readily apparent when only looking at total survey responses.
What is cross-tabulation? (The precise definition)
For a precise reference, a cross-tabulation is a two- (or more) dimensional table that records the number (frequency) of respondents that have the specific characteristics described in the cells of the table. Cross-tabulation tables provide a wealth of information about the relationship between the variables.
Cross-tabulation analysis has its unique language, using terms such as “banners”, “stubs”, “Chi-Square Statistic” and “Expected Values.” A typical cross-tabulation table comparing the two hypothetical variables “City of Residence” with “Favorite Baseball Team” is shown below. Are city of residence and being a fan of that team independent? The cells of the table report the frequency counts and percentages for the number of respondents in each cell.
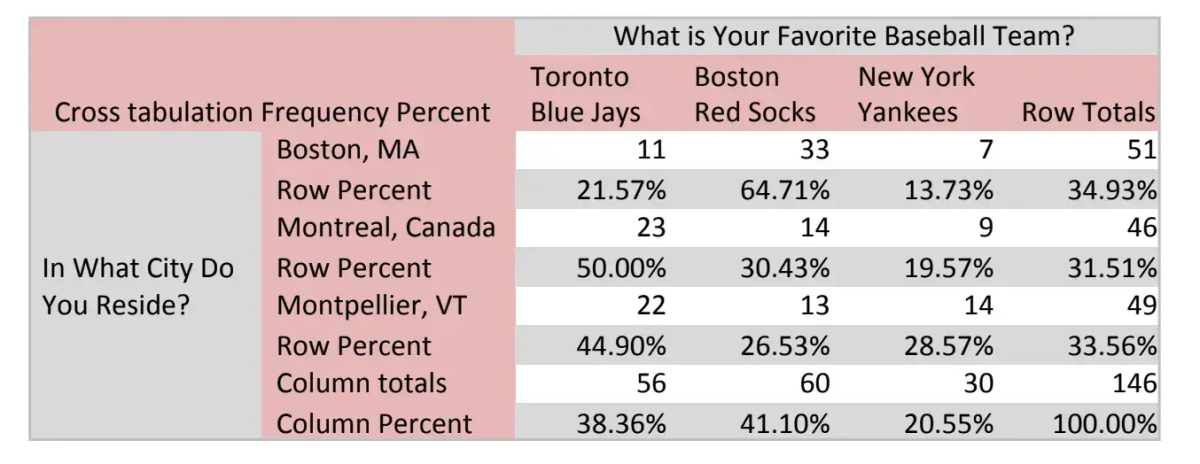
In this table, the text legend in the crosstab describes the row and column variables. You can create and analyze multiple tables in a side-by-side or sequential format. Tabulation professionals call the column variables in these multiple tables “Banners” and row variables “Stubs”.
Free eBook: The ultimate guide to conducting market research
When should you use cross-tabulation?
You typically use cross tabulation when you have categorical variables or data – e.g. information that can be divided into mutually exclusive groups.
For example, a categorical variable could be customer reviews by region. You divide this information into reviews per geographical area: North, South, East, West, or state, and then analyze the relationships between that data.
Another example of when to use cross-tabulation is with product surveys – you could ask a group of 50 people “Do you like our products?” and use cross-tabulation to get a more insightful answer. Rather than just recording the 50 responses, you can add another independent variable, such as gender, and use cross-tabulation to understand how the male and female respondents view your product.
With this information, you might see that your female customers prefer your products more than your male customers. You can then use these insights to improve your products for your male customers.
As such, using two variables – gender and product likability – along with cross-tabulation, you can get a more comprehensive breakdown of data sets to identify patterns, trends, or other useful information.
As a result, cross-tabulation is excellent for assessing categorical variables in market research or survey responses, as you can readily compare data sets to discover the relationship between two (or more) seemingly unrelated items.
Other uses of cross-tabulation
- Employee engagement and satisfaction: you might want to assess how employees, both male, and female, feel about their job roles currently. You could even conduct this research across departments and compare two or more variables to get a better understanding.
- Exit interviews: why are employees leaving and what could you do differently? Is there a correlation between employees leaving and progression, for example?
- Departmental issues: are issues caused by one or more variables and if so, are these issues more prevalent at specific job levels?
- Evaluation surveys at schools: how do students feel about the course material and is the time spent on the material sufficient enough?
- Product research and feedback: how do certain demographics feel about your product? What would they like to see and how does feedback differ from region to region? What about customer satisfaction?
But if you’re ready to go beyond surveys and start listening to what your prospects and customers have to say, make sure to check out our guide on using multiple listening channels.
What are the benefits of cross-tabulation?
As a statistical analysis method that allows categorical evaluation across a data set, cross-tabulation can help to uncover variables or multiple variables that affect a specific result or can aid in improving a specific outcome.
With the examples above, you should now have a good idea of how to cross-tabulation can be used in certain contexts to glean insights. But there are several other benefits to cross-tabulation:
- Error reduction: analyzing data sets can be confusing, let alone accurately pulling insights from them. Using cross-tabulation, you can make your data sets more manageable at scale (as they simplify them and divide them into representative subgroups).
- More insights: cross-tabulation looks at the relationships between one or more categorical variables to uncover more granular insights. These insights might go unnoticed with standard approaches (or require more work to reveal).
- Actionable information: as cross-tabulation simplifies data sets and allows you to quickly compare the relationships between them, you can uncover insights faster and apply new strategies as necessary.
These are the main benefits of cross-tabulation, but as a statistical analysis method, it can be applied to a wide range of research areas and disciplines to help you get more from your data.
How to do cross-tabulation analysis in Microsoft Excel
In Microsoft Excel, cross-tabulation tables (or crosstabs) can be automated using the Pivot Table. You can either use the Pivot Table icon in the toolbar or click on Data > Pivot Table and Pivot Chart Report.
Alternatively, you can press Insert and then click the PivotChart button. Once clicked, the PivotChart dialog box will open. Select the data that should be used in your crosstab analysis and select where you want it to be placed.
You can experiment with the individual parameters of the crosstab, but select the columns that you want to compare and analyze to get the information you need.
Cross-Tabulation With Chi-Square Analysis
The Chi-square statistic is the primary statistic used for testing the statistical significance of the cross-tabulation table. Chi-square tests determine whether or not the two variables are independent. If the variables are independent (have no relationship), then the results of the statistical test will be “non-significant” and we are not able to reject the null hypothesis, meaning that we believe there is no relationship between the variables. If the variables are related, then the results of the statistical test will be “statistically significant” and we can reject the null hypothesis, meaning that we can state that there is some relationship between the variables.
The chi-square statistic, along with the associated probability of chance observation, may be computed for any table. If the variables are related (i.e., the observed table relationships would occur with very low probability, say only 5%) then we say that the results are “statistically significant” at the .05 or 5% level.
This means that the variables have a low chance of being independent. Students of statistics will recall that the probability values (.05 or .01) reflect the researcher’s willingness to accept a type I error, or the probability of rejecting a true null hypothesis (meaning that we thought there was a relationship between the variables when there wasn’t).
Furthermore, these probabilities are cumulative, meaning that if 20 tables are tested, the researcher can be almost assured that one of the tables is incorrectly found to have a relationship (20 x .05 = 100% chance). Depending on the cost of making mistakes, the researcher may apply more stringent criteria for declaring significance, such as .01 or .005.
Computation of the Chi-Square Statistic for Cross-Tabulation Tables
The chi-square statistic is computed by first computing a chi-square value for each individual cell of the table and then summing them up to form a total chi-square value for the table. The chi-square value for the cell is computed as: (Observed Value – Expected Value)2 / (Expected Value). The chi-Square computations are highlighted in gray.
In this example table, we observe that the chi-square value for the table is 19.35, and has an associated probability of occurring by chance less than one time in 1000. We, therefore, reject the null hypothesis of no difference and conclude that there must be a relationship between the variables. We can observe the relationship in two places in the table.
The most obvious is in the chi-square value computed for each cell. We observe that the cells “Red Socks and Boston”, “Blue Jays and Montreal” and “Red Socks and Montpellier, Vermont” were the three cells where the number of observed respondents was greater than expected. We further note that when we examine the expected and observed frequencies, the “Yankees and Montreal”, “Red Socks and Montpellier, Vermont”, and “Red Socks and Montreal” frequencies were fewer than expected.
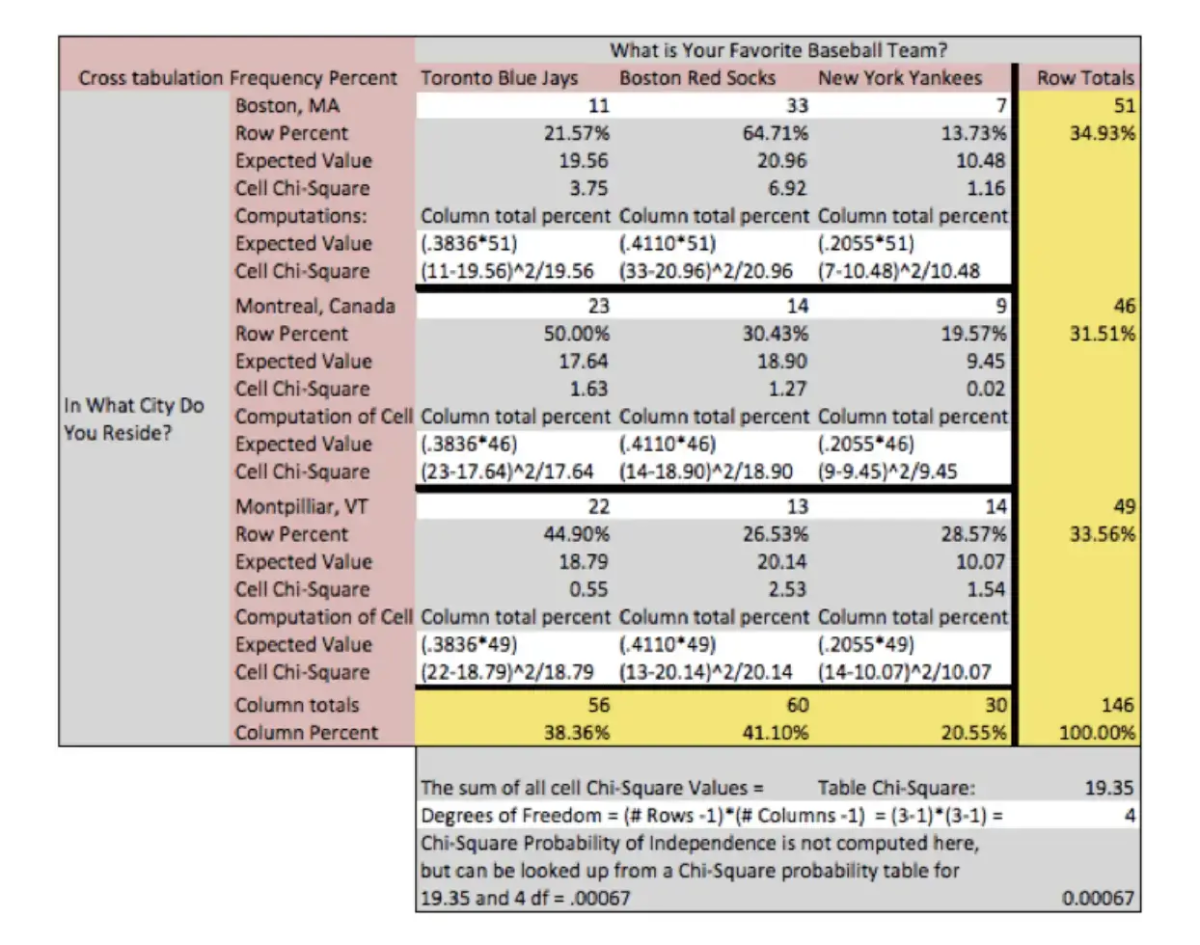
Because the cell chi-square and the expected values are often not displayed, these same relationships can be observed by comparing the column total percent to the cell percent (of the row total). In the cell “Red Socks and Boston” we would compare 41.10% with 64.71% and observe that more Red Socks fans liked Boston than expected. Caution is urged when interpreting relationships found in any statistical analysis. We often desire to “explain” or conclude “causality” from analyses when data either is not designed to or does not have the power to support such conclusions.
In the current table, we observe that “Red Socks and Boston” had the greatest delta between the number of observed and expected respondents, for any team preference and city of residence. However, we must be careful in concluding that the Red Socks caused respondents to move to Boston, or that Boston as a city of residence causes fan loyalty. Red Socks and Boston are the most observed fan and city relationship, but are most likely totally independent when considering other concepts or relationships.
Crosstabs and chi-square are powerful ways to analyze your survey data.
Learn how Qualtrics can make cross-tab analysis easy
Cross-tabulation: solved
By now you should have a better understanding of what cross-tabulation is and how it can be used to bolster your research and survey results across all areas of your business.
Of course, they are just one part of a much larger whole – a whole that can really help you to uncover breakthrough insights from your data and drive real change.
As the world around us changes at lightning speed, you and your research team face the tough task of understanding what’s happening and how you can move your organization forward using the data you capture.