 XM Knowledge Base
So much data, but where’s the insight?
Every day, we create roughly 2.5 quintillion bytes of data. And just to put that into perspective, there are 18 zeros in a quintillion, 18!
Of course, only a fraction of that data is relevant to your brand and business. This could be social media interactions with your prospects and customers, emails from interested parties, or feedback surveys.
So, even though your brand or business might not be generating 2.5 quintillion bytes of data each day, the vast majority of it can be used to improve your products, experiences, and services.
But the question is, where do you start? How can you harness the power of the data you collect — both in structured and unstructured formats — to understand what your prospects and customers struggle with, care about, and want to see next?
The answer? Topic modelling (also referred to as categorisation or taxonomy structures).
What is topic modelling?
In machine learning (ML) and natural language processing (NLP), topic modelling is an unsupervised statistical method for discovering abstract ‘topics’ that exist within a collection of documents. It scans or ‘mines’ text to detect frequently used words or phrases and groups them to provide a summary that best represents the information in the document.
For example, if an article includes: ‘football’, ‘score’, ‘goal’, ‘Manchester United’, and ‘Chelsea’, the topic model is football. Or if a document includes: ‘dogs’, ‘cats’, ‘hamsters’, ‘birds’, the topic model is animals.
As well as discovering the high-level topic models that exist within a document, topic modelling can highlight the degree to which they are referred to. This information is captured as a statistic (as topic modelling uses a mathematical framework), giving you a percentage breakdown of the topic, e.g. in an article that’s 60% about pizza and 40% about pasta, there would probably be 6 times more pizza-related words than pasta-related words.
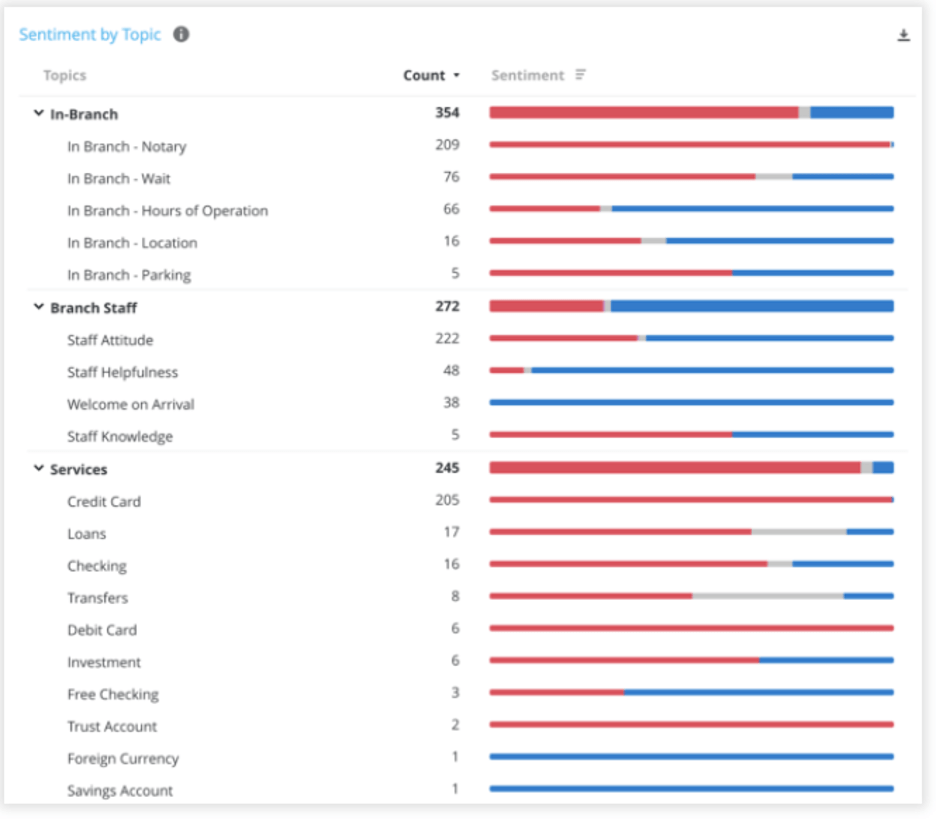
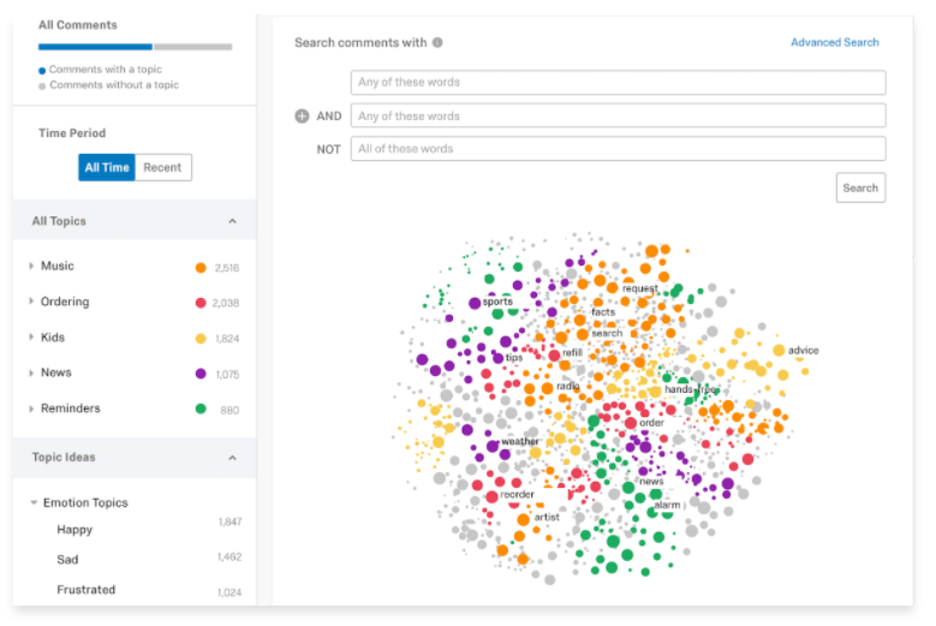
Image: Topic Modeling in Qualtrics
Of course, the statistical process of topic modelling is very complex, so here we’ll try to keep it as simple as possible so that you can truly visualise its benefits.
Key tip — The easiest way to look at topic modelling
Topic modelling looks to combine topics into a single, understandable structure. It’s about grouping topics into broader concepts that make sense for a particular business or issue.
Key tip — Text corpus: what does it mean?
Another thing you’ll often come across when reading about topic modelling is the term ‘corpus’. Corpus simply means a collection of written or spoken language which can be used for a variety of purposes, from helping to compile dictionaries to providing insight into how language is used.
Topic modeling vs topic classification
Topic classification is a supervised learning approach that uses rule-based systems (machine learning algorithms) that are manually trained using annotated data and predefined topics.
After evaluating the training data, these machine learning algorithms can accurately classify unseen texts based on their topics. Topic modelling, on the other hand, is an unsupervised learning approach in which machine learning algorithms identify topics based on patterns (such as word clusters and their frequencies).
In terms of effectiveness, teaching a machine to identify high-value words through text analysis is more of a long-term strategy compared to unsupervised learning (topic modelling). If you have a predefined list of topics for sets of texts, e.g. reviews or surveys, and want to label them automatically to extract value quickly, a topic classification algorithm would be more applicable.
What are the main topic modelling methods?
The three most common topic modelling methods are:
- Latent Semantic Analysis (LSA)
Primary used for concept searching and automated document categorisation, latent semantic analysis (LSA) is a natural language processing method that assesses relationships between a set of documents and the terms contained within. It uses singular value decomposition (SVD) to scan unstructured data to find those relationships. The word ‘latent’ indicates that the model discovers yet-to-be-found or hidden topics in a document.
What is SVD?
SVD is a method of representing a matrix as a series of linear approximations that expose the matrix’s underlying meaning structure. The goal of SVD is to find the optimal set of factors that best predict the outcome, and is used in LSA to find the underlying meaning of terms in various documents.
Back to LSA.
The core idea with LSA is to take a matrix of what we have — documents and terms — and decompose them into a separate document-topic matrix and topic-term matrix (or occurrence matrix). The first step is to generate a document-term matrix. Given (M) documents and (N) words in our vocabulary, we can construct an (M) X (N) matrix. Each row within the matrix represents a document, while each column represents a word (or vice versa). Each cell contains the number of times the word appears in the document. For example:
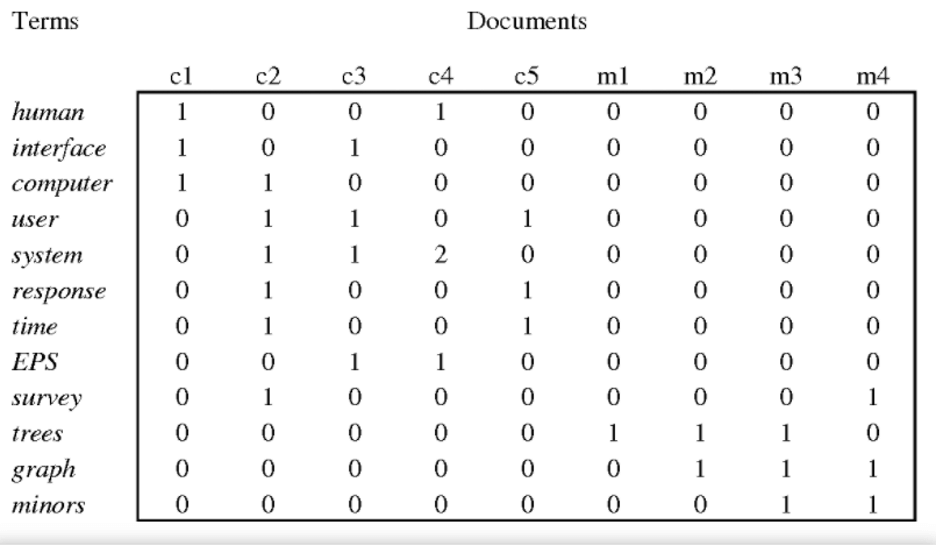
Image source: Semantic Scholar
Typically, the weighting of elements in this matrix is tf-idf (term frequency-inverse document frequency): the weight of an element in the matrix is proportional to the number of times the terms appear in each document.
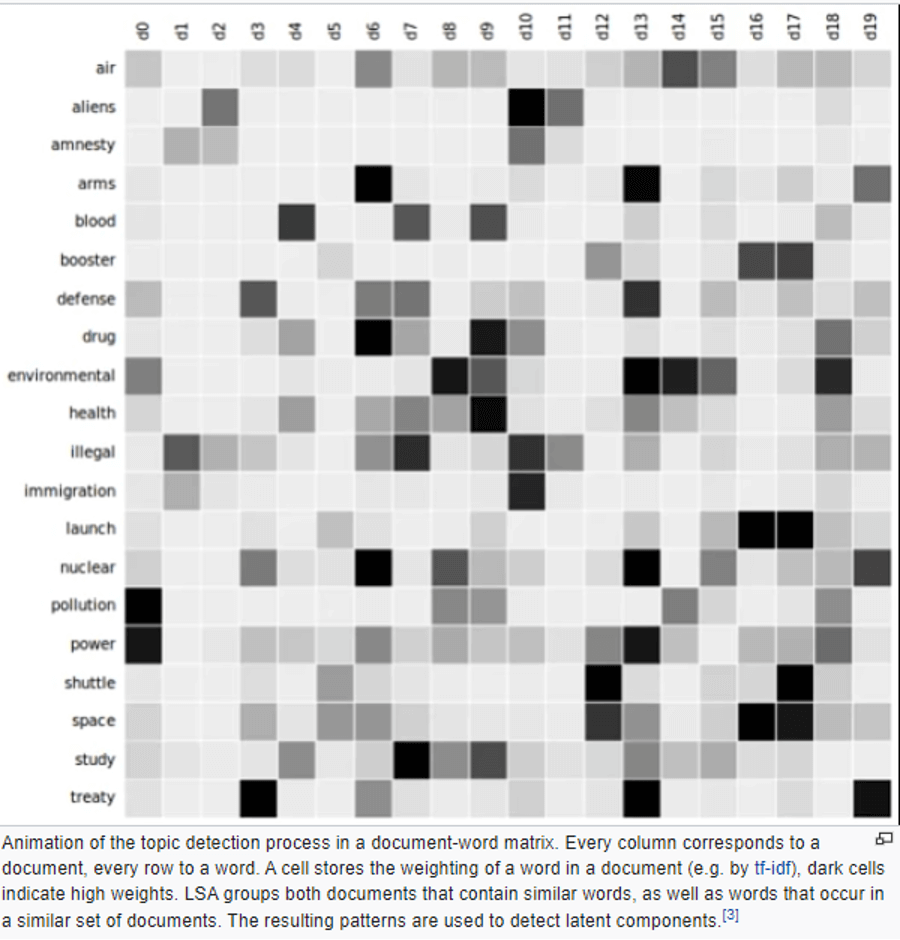
Image Source: Statistic Scholar
Having created the occurrence matrix, LSA uses a low-rank approximation (measuring the fit between the data and the variable, in this case, the topic), to:
- Eliminate unnecessary or inaccurate terms (e.g. anecdotal instances of terms)
- Reduce the size of the document for computational reasons (not enough resources)
- Reduce sparsity — the original document might list words in the document, whereas we’re interested in the words related to each document.
By using rank lowering, we can combine terms that have similar meanings or add related terms to words that share a similar meaning.
- Probabilistic Latent Semantic Analysis (pLSA)
Also known as probabilistic latent semantic indexing (pLSI), probabilistic latent semantic analysis (pLSA) is a statistical technique for analysing two-mode and co-occurrence data.
Compared to LSA which stems from linear algebra and downsizes occurrence tables (usually via SVD), pLSA is based on a mixture decomposition derived from a latent class model.
The core idea is to find a probabilistic model with latent topics that can generate the data we observe in our document-term matrix. In other words, pLSA helps us to determine the likelihood of certain words being used within certain topics.
- Latent Dirichlet Allocation (LDA)
In NLP, latent dirichlet allocation (LDA) is a generative statistical model that assumes documents are composed of words that help determine the document’s topic. From there, documents are mapped to specific topics based on the words they include.
The LDA topic model maps documents to a list of topics and assigns topics to arrangements of words, e.g. ‘atoms’ and ‘energy’ for a topic related to physics. This is based on the assumption that documents are composed of an arrangement of words and those words determine topics.
Without diving into the mathematics, the LDA model is guided by two principles:
- Every document is a mixture of topics
Documents can contain words from several topics in equal proportion. For example, in a two-topic model, Document 1 is 90% topic A and 10% topic B, while Document 2 is 10% topic A and 90% topic B.
- Every topic is a mixture of words
Imagine a two-topic model of English news, one for ‘politics’ and the other for ‘entertainment’. The most common words in the ‘politics’ topic might be ‘Prime Minister’, ‘Government’, ‘cabinet’, ‘Labour’, ‘Conservative’, while the entertainment topic could include ‘movies’, ‘television’, ‘actor’. Most importantly, words can be shared between topics, e.g. ‘budget’ could appear equally in both.
LDA estimates both of the above — the mixture of words associated with a topic and the topics that describe each document.
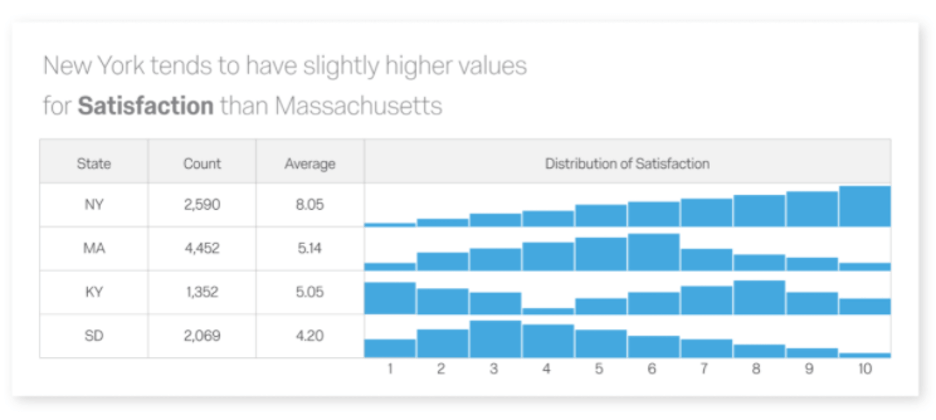
In the example below, you can see how latent dirichlet allocation reports a survey and divides all of the results into different categories associated with a certain topic.
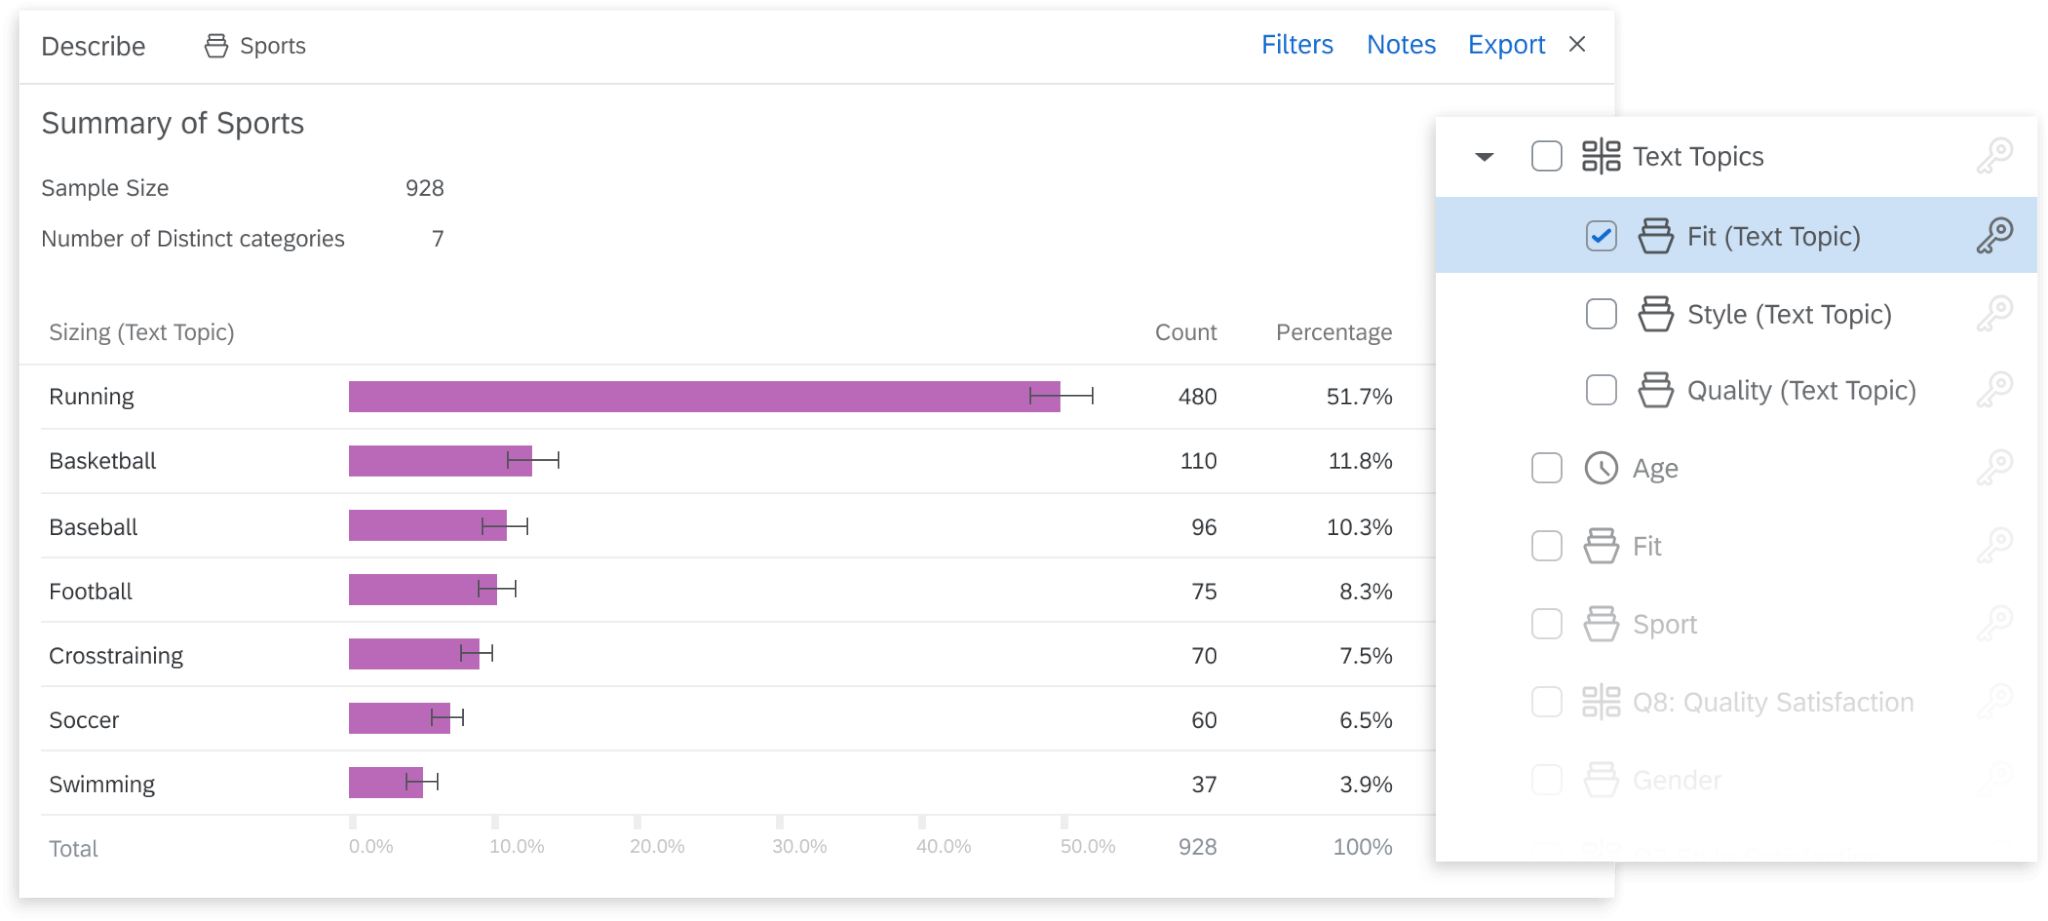
You can’t possibly read all of your customers’ survey responses, Qualtrics Text iQ™ utilises LDA to ensure you don’t have to.
Discover how by signing up for a free demo.
The benefits of topic modelling
Topic modelling enables you to look through multiple topics and organise, understand and summarise them at scale. You can quickly and easily discover hidden topical patterns that are present across the data, and then use that insight to make data-driven decisions.
For example, say you want to understand what people are saying about your product on social media. You could combine topic modelling techniques with sentiment analysis to discover which aspects or features (topics) of your product are being discussed most often. You can then use sentiment analysis to see if people’s experiences of your product are positive, negative, or neutral.
Similarly, what if you wanted to comb through customer service emails to understand your customer’s biggest challenges? You could export that unstructured data and use topic modelling tools to highlight and understand what your customers’ key issues (topics discussed) are. It then becomes incredibly easy to deliver a data-driven and actionable strategy to improve your service and empower users. This is great for understanding the voice of your customers (VoC) and where you can help.
Here’s what it can do for you:
- Mine relevant information at scale
Rather than sift through a large database of information — from social media posts to customer service emails — you can automate the text mining process using topic modelling algorithms. It’s fast, accurate and scalable, meaning you can evaluate as much data as you want.
- Real-time analysis
By combining topic modelling with other types of NLP, such as sentiment analysis, you can close gaps across your touchpoints to get a complete picture of the user experience. More importantly, because the whole process is automated, you can turn insight into action whenever, wherever.
- Consistent understanding of data
As you can extract meaning from your data at scale, you can understand interactions across every touchpoint, from surveys to customer feedback, and use that insight to create better experiences.
Check out the complete guide on topic modelling and text analysis.
Ultimately, topic modelling analysis puts you in an incredible position to analyse huge swathes of text data to extract relevant information in real-time and use it to create breakthrough experiences.
Business use cases for topic modelling
Teams spend hours trying to collate, sort and understand the data they receive, all in the hopes of turning that data into insight. Fortunately, topic modelling provides far more efficient methods for data and text mining, empowering your teams to identify what matters to your target audience. Here are just a few ways you can use topic modelling to achieve better outcomes.
- Automatically tag customer support tickets
With a topic modelling tool, your customer service team can mine support tickets to understand what the main problems are and if there are any patterns based on term frequency. Based on that information, they can create self-service content or direct support to help customers.
- Route conversations to the right teams based on topic
Rather than trying to work out who needs to speak to the customer, a topic modelling tool can tag conversations and then, using workflows, route them to the most appropriate team. For example, a conversation that includes the words ‘pricing’, ‘subscriptions’, ‘renewal’, or ‘billing issues’, could be sent to the accounting and/or billing department for resolution.
- Detect the urgency of support tickets
Text data, used in conjunction with sentiment analysis, can help you to uncover what customers are feeling and how urgent their queries are. For example, if a ticket includes the words ‘immediately’, ‘urgently’, or ‘right away’, you can get the appropriate team members on it as quickly as possible. With a rapid response, you can turn unpleasant situations into positive experiences and even avoid potential crises.
- Get better insights from conversations
How are your customers feeling? What are the most-talked-about topics or challenges that they’re facing? With topic modelling and sentiment analysis, you not only know what they’re talking about but also how they feel about those issues — and you can drive change at scale as a result.
- Act on customer feedback at scale
What if you could capture and analyse positive and negative feedback from customers at scale and identify trends across both? With topic modelling, it’s entirely possible to get a breakdown of both positive and negative experiences.
- Create data-driven, problem-focused content
Depending on what you uncover from the text data (regardless of source), you can work out what content would benefit your prospects and customers. For example, based on sales queries or customer support tickets, you might find that the terms ‘subscription options’ and ‘knowledge’ are trending and often found in the same documents. From this we can infer that your prospects and customers want to know more about your subscription options — so why not create a blog or guide to educate them?
- Improve sales strategy
If prospects and customers are talking about your product or service pricing or lack of transparency, for instance, being able to capture that information and relay it to your teams at scale can be transformative.
- Identify employee issues
If you send out an open-text employee engagement and satisfaction survey and want to quickly understand how employees feel about the business,
It’s never been more important to hear every voice — and now you can
Every touchpoint is an opportunity. An opportunity to delight your customers. An opportunity to educate prospects. An opportunity to drive meaningful change based on feedback from employees.
And it all starts with the data you collect and how you use it. By now, you should have an understanding of the basics of topic modelling and how it can be used to extract data and help turn it into actionable insight.
Truth is, organisations only have one chance to get the experience right. In a world where it’s never been easier to switch between brands and businesses, your prospects and customers will move on before you even notice they’re gone. According to our research, more than 60% of customers are likely to switch brands after just one poor experience.
That’s why you need tools like Qualtrics. Tools that can capture and act on experience data at every stage of the customer journey, so that you can get it right, every time.
Turn text responses into insight
With Text iQ, for example, you can uncover the most actionable insights from customer surveys and open text responses. It instantly analyses documents so that you can understand what, in your customers’ and employees’ own words, matters most.
Text iQ uses powerful machine learning and native language processing to discover patterns and trends in open text. Trending topics are brought to the attention of the people that need to see them most, and they’re integrated into all Qualtrics reporting functions, so you can specify topic hierarchies and much more.
The best part? It’s always listening and organising comments by topic and assigning sentiment scores so you know which parts of the journey to focus on next.
Make data-driven decisions and predict what happens next
What about the statistics you get from your surveys or NPS scores? With Stats iQ, you can uncover meaning in data, hidden trends and produce predictive models (e.g. models that can predict what would affect customer satisfaction). Stats iQ automatically runs the right statistical tests based on what you want to achieve and then translates the results into simple language that anyone can put into action.
For example, you can identify key experience drivers based on data from surveys or other sources and see how those drivers are affected by business changes. Using Stats iQ alongside Text iQ topics, you can build statistical models, set model parameters, and access deeper, richer insights.
Connect everything together
Let’s go one step further. With our integration with Usermind, the leading solution for customer journey orchestration, you can bridge experience gaps to acquire, grow and retain customers. Now you can:
- Get to know your customers better
Complement customer profiles with contextual data and use tools like Text iQ to analyse survey responses and open-text responses to understand what matters most.
- Analyse and shape customer journeys in real-time
Lead customers to the most efficient outcomes — see what’s causing friction across touchpoints and implement the actions to smooth them out.
- Deliver personalised experiences at scale
Orchestrate journey flows using out-of-the-box integrations with your systems.
If you’re ready to transform your business by leveraging your data to create breakthrough experiences, we’re with you every step of the way.
Check out Qualtrics DesignXM for yourself, and see how you can turn data into insight.
Turn data into insights with Qualtrics XM