Hi,
I am trying to create a chart in qualtrics using altair (https://altair-viz.github.io) library. I can create chart using other library such as chart.js but when I do the same procedure for altair it doesn't work. This is how I am trying to create the chart:
The exported survey is here:
altair.qsf
in heading: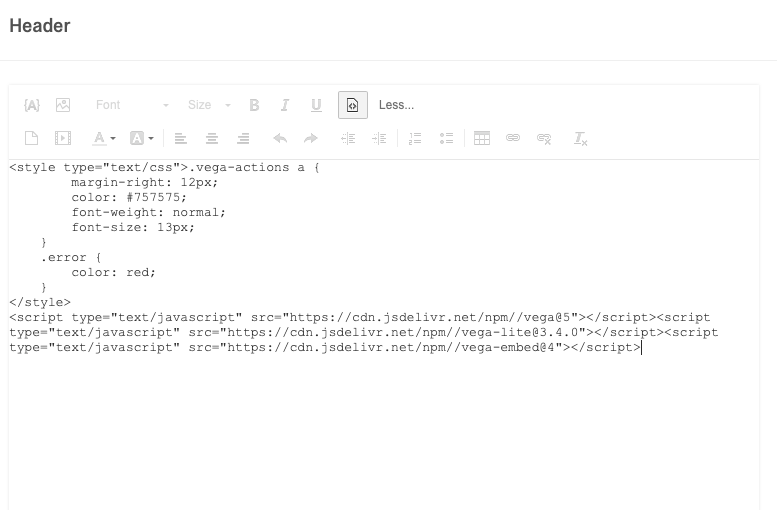
code:
in html:
in js: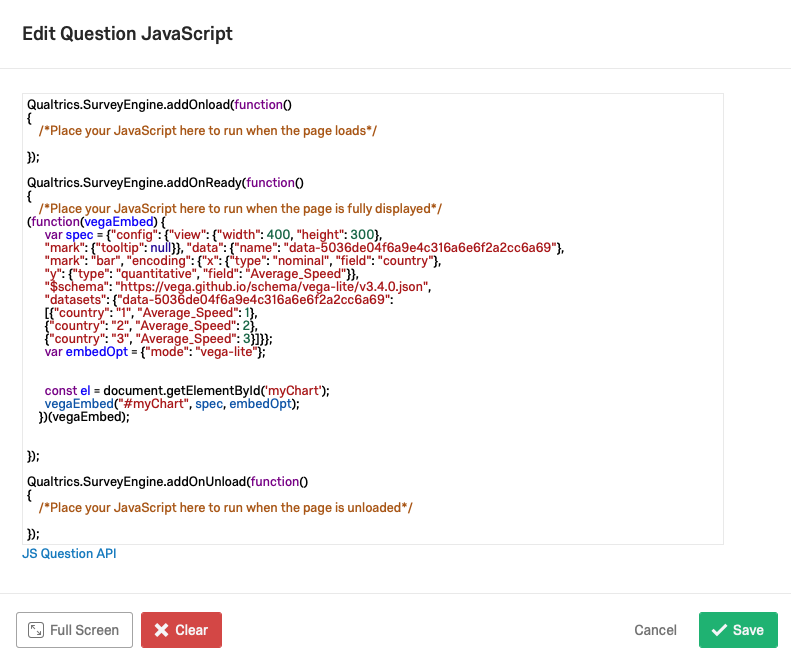
code:
Qualtrics.SurveyEngine.addOnReady(function()
{
/*Place your JavaScript here to run when the page is fully displayed*/
(function(vegaEmbed) {
var spec = {"config": {"view": {"width": 400, "height": 300},
"mark": {"tooltip": null}}, "data": {"name": "data-5036de04f6a9e4c316a6e6f2a2cc6a69"},
"mark": "bar", "encoding": {"x": {"type": "nominal", "field": "country"},
"y": {"type": "quantitative", "field": "Average_Speed"}},
"$schema": "https://vega.github.io/schema/vega-lite/v3.4.0.json",
"datasets": {"data-5036de04f6a9e4c316a6e6f2a2cc6a69":
[{"country": "1", "Average_Speed": 1},
{"country": "2", "Average_Speed": 2},
{"country": "3", "Average_Speed": 3}]}};
var embedOpt = {"mode": "vega-lite"};
const el = document.getElementById('myChart');
vegaEmbed("#myChart", spec, embedOpt);
})(vegaEmbed);
});
Can anyone help me with this? Is it possible that Qualtrics does not support altair?

How to create chart using altair visualization library


Can you either export the survey, or put both the header and the js in code block, so we can copy and paste and recreate it in our local instance? Try to type it in from a jpg is pretty time consuming.
Hi,
Thank you for your reply. Sure! I edited my question.
Here is the exported survey:
altair.qsf
Leave a Reply
Enter your username or e-mail address. We'll send you an e-mail with instructions to reset your password.