


I have collected different score via constant sum question in my survey. Now i want to create a table in dashboard from the results. The dashboard should look like this: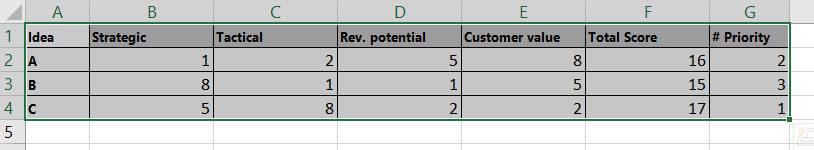 These numbers I will collect through surveys. The respondent will rate each idea based on criteria. Then i will need to collect the total score for each idea and then rank it based on the priority basis. I would like to reflect these results in a dashboard or reports. Can anyone give me few suggestions on how to approach this ?
Best answer by MaiaH
View original
