I would like participants to see their results in a graph on the last page of the survey. I set up scoring and used piped text to show the numerical values. I would like to add in graphs. I cannot find a way to create these graphs in Qualtrics, so I created them externally and would like to only show the appropriate graph to the participant based on their scoring (i.e score=8 so show bar graph that portrays this) . Branching is the only way I see to do this. However, I need them to all be on the same page and branching does not seem to allow for this.
I would also like for participants to have the option to email the results to themselves. I set up an automatic email, but I need them to remain anonymous and cannot record their email. Is there a way to keep the automatic email but not record participants' emails?
Any help would be greatly appreciated! Thanks!

Score Profiles for Participants and Hidden Answers
Userlevel 1

Userlevel 7
 +38
+38
morganm Have you tried using branch logic to create an embedded data variable for the charts? Save your image in the Graphics Library. Find the image and click on the wheel and choose copy URL. Fill the URL into the appropriate space of the code in DisplayGraph embedded data (see picture below to check syntax). Then the page where you want to show the chart is the same for everyone (pipe in embedded data variable DisplayGraph).
Survey Flow: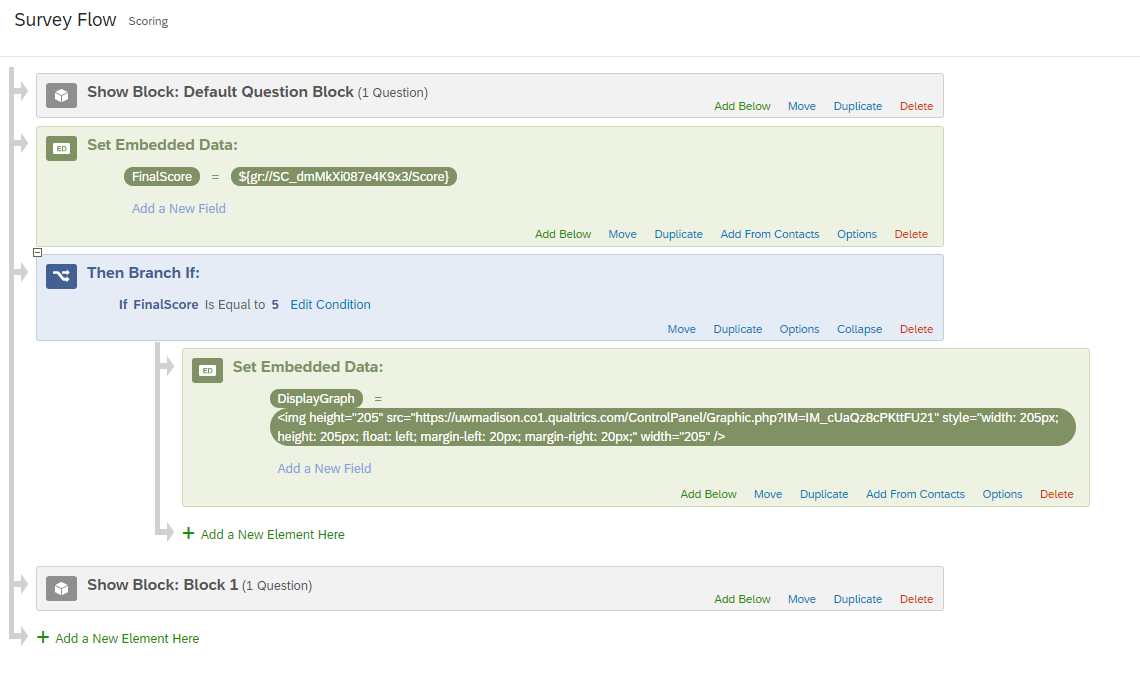
Survey: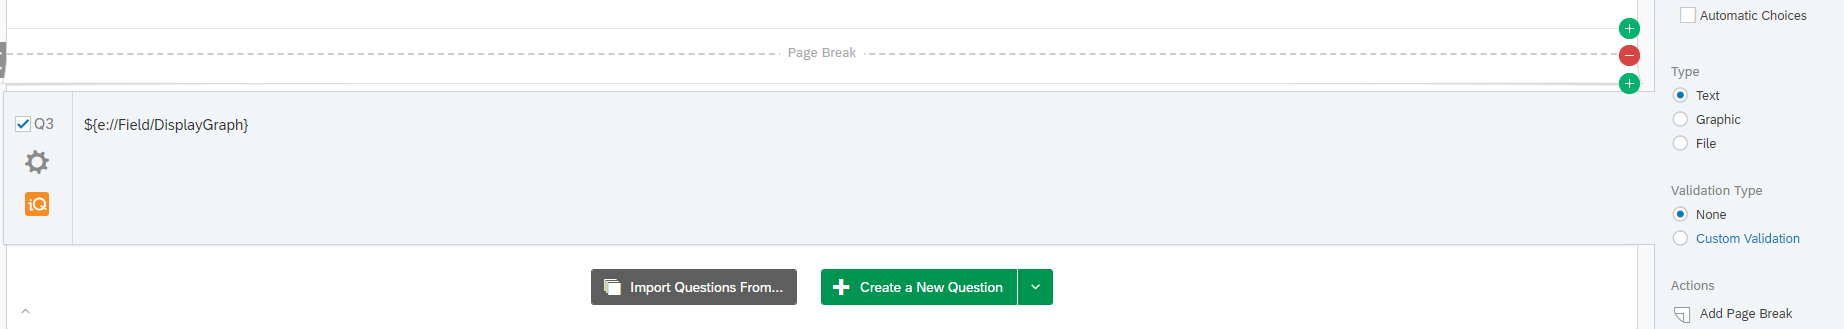 Result when I score a 5:
Leave a Reply
Enter your username or e-mail address. We'll send you an e-mail with instructions to reset your password.