

I have a matrix question with only text entry items and I need to find a way to make a report that is essentially structured the same way as the question itself. See screenshot below. This can be done in Results Reporting or New Reporting. I have not been able to find a solution because of how Qualtrics treats text responses. Screenshot of question below and QSF attached. 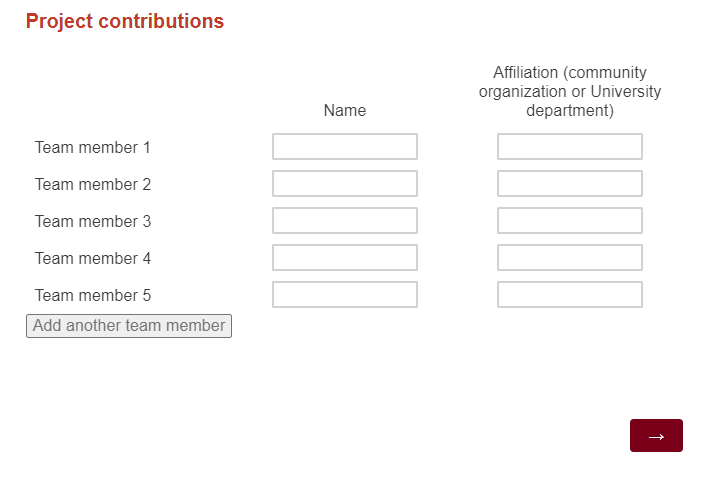 Qualtrics_Community_Help.qsf

Help needed to make a table look decent in reporting

Userlevel 3
 +6
+6
Hmmmm. You should be able to do this in paginated reporting by adding in the columns. Let me try a bit of testing and get back to you, because I could swear I've done this or something similar to it.
I've tried but it was just not looking right. I ended up just setting up a live connection with Google Sheets and putting a hyperlink to the Google Sheets within the report
Userlevel 3
+6
Okay, so I found a way that MIGHT work for you.
What I did here was to make one table for each team member (name, affiliation). They are "stacked" on top of each other, so what you see in this image is actually three separate tables.
To get the Team Member column, I just put in a text field, and used some spacers (highlighted so you can see them) to space them out so they'll look right in the PDF.
That's about the best solution I could find. Hope it helps you!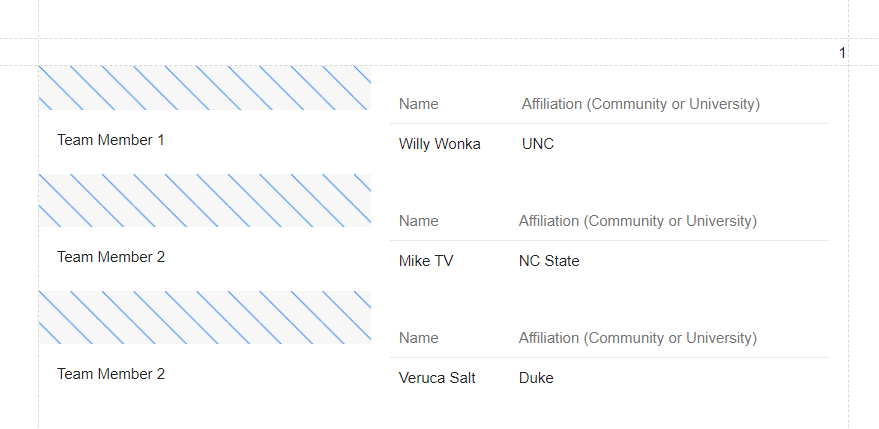
Leave a Reply
Enter your username or e-mail address. We'll send you an e-mail with instructions to reset your password.