
Best answer by Swanand_Chavan_Ugam
View original
Trend data by month in crosstab
Trying to trend the number of responses in each month over a 6 month period. The banners would be the months (Jan, Feb) and include anyone who was recorded as a complete in that month. Any help is appreciated.

Userlevel 7
 +33
+33
Hi @Kelsodeluca , Where you want to show this response table in excel or vocalise or report.
Hey @bansalpeeyush29 ,
Ideally both within the report and excel. I know I can simply export the data filtered by data and create the table in excel. Just hoping there is a simpler solution.
Ideally both within the report and excel. I know I can simply export the data filtered by data and create the table in excel. Just hoping there is a simpler solution.
Userlevel 7
+33
You can only create pivot table in excel using two columns "month and number of completes" for report you have to manually add.

Userlevel 5
+19
@Kelsodeluca - I do understand your query and here is what you can do to achieve this:
In Cross Tab
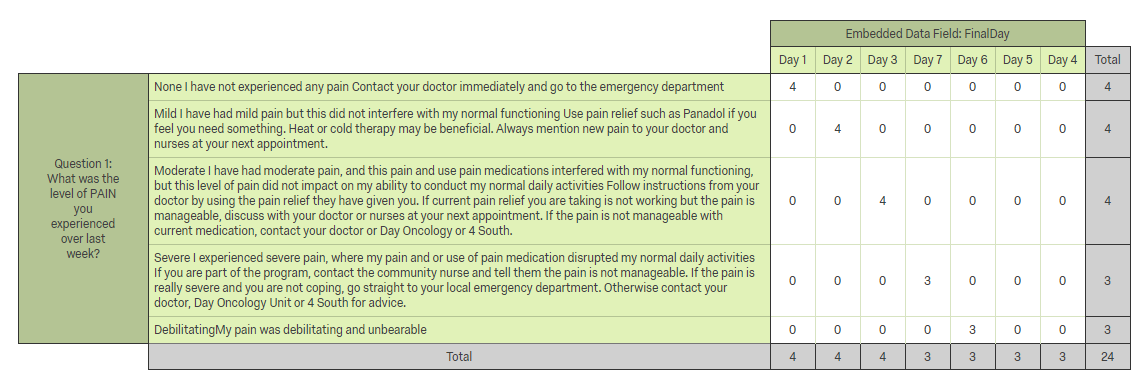
Create 2 embedded variables in survey, one each to capture day / week and other one to maintain the counts. In crosstab feature, we are able to access embedded variables + actual questions but not the count hence this might be a good option...refer to the image below as an example. I have created one day variable which is used at the top.
!
In Reports
Go to paginated reports [under "Reports" tab --> Reports]. Here you can create a report based on the metadata variable Finished and apply a breakdown by End Date (Month)
Hope one of the above works for you
In Cross Tab
Create 2 embedded variables in survey, one each to capture day / week and other one to maintain the counts. In crosstab feature, we are able to access embedded variables + actual questions but not the count hence this might be a good option...refer to the image below as an example. I have created one day variable which is used at the top.
!
In Reports
Go to paginated reports [under "Reports" tab --> Reports]. Here you can create a report based on the metadata variable Finished and apply a breakdown by End Date (Month)
Hope one of the above works for you
Leave a Reply
Enter your username or e-mail address. We'll send you an e-mail with instructions to reset your password.