Best answer by Kate
View original
Reporting

Userlevel 3
 +8
+8
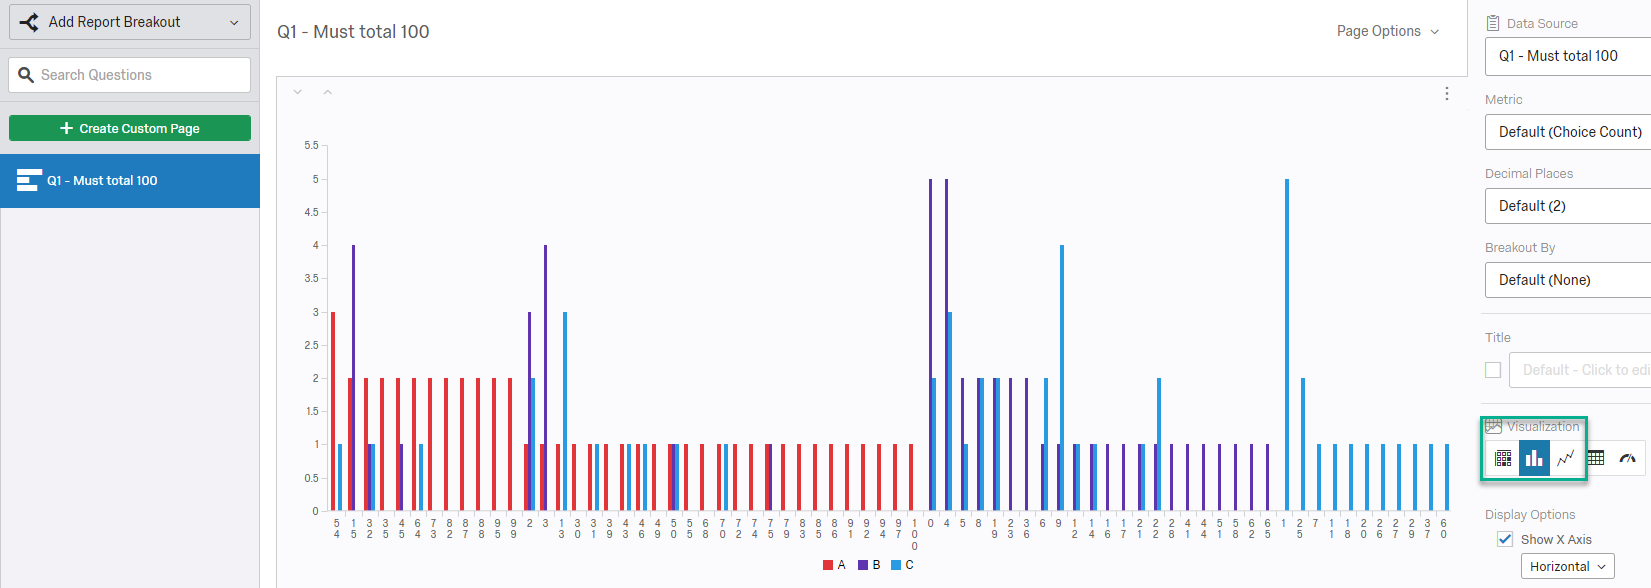
Hello, I have a constant sum question that I would rather show in a bar chart instead of the stats graph. Any ideas?


There is a visualizations option on the right hand side- toggle on "bar chart".
!
!
Userlevel 3
+8
Hello, thank you for your response...the constant sum questions contains (3) statements. Meaning: please allocate 100 points across statement 1, statement 2, statement 3. Total must be 100. I tried what you suggested and it does not provide the layout I was hoping. Any other suggestions would be helpful. Thank you so much!
Reports is really limited in is functionality. If that is not the bar chart you are hoping for, then you need to export and create your own report, or get some sort of additional dashboarding tool.
Userlevel 3
+8
Thank you! I sort of thought so, but I wanted to be sure I wasn't missing anything ")
Leave a Reply
Enter your username or e-mail address. We'll send you an e-mail with instructions to reset your password.