How to include benchmarks/percentiles into 360 reports | XM Community
Solved

How to include benchmarks/percentiles into 360 reports

  • 17 October 2019
  • 6 replies
  • 70 views

Badge +1
Hello, I want to show the benchmarks/percentile into 360 reports. how to upload the benchmarks into a 360 project? Does this include custom programming?

Any help or idea around this would be helpful
icon

Best answer by ClairJ 17 October 2019, 14:28

View original

6 replies

Userlevel 5
Badge +15
Hi @salma2019 , I just replied to your product idea. I'm not sure there is a way to upload a completely custom benchmark. However, I have two ideas for workarounds. The first would be to use the assessment-wide values as your benchmark. Implementing this is pretty easy. Just create a rater category titled "Benchmark" and set it to include the subject's evaluations AND the evaluations of others, plus whatever else you want. You can then use this as a data source in your graphs.

The other workaround is quite clunky, but I think it would work. You could create a copy of your assessment, and then fill it with fake data to produce the benchmarks you want...you'd really just need to enter one respondent with the exact scores you want. Then, as before, create a rater category in your report titled "Benchmark" and set the data source to be this fake assessment. It will pull in the data you set as your benchmark.

Let me know if anything above is not clear!
Badge +1
HI Clair,

Thank you so much for the ideas. I want to show the 75 and 95th Percentile of overall 360 surveys we have done so far in our organisation.

I would go with the second idea of fake assessment may be this will help. let me try and get back to you. Thank you again for quick solutions.


Thanks,
Salma
Badge +1
HI Clair,

Just wanted to check is it possible to show percentiles across each category of raters? please see an image below for what i am looking out for. With a fake survey i can include data but how can is how them across category in graphical format?
!


Thanks,
Salma
Userlevel 5
Badge +15
Hi Salma,

Unfortunately I'm not aware of a way to do this. 😕 
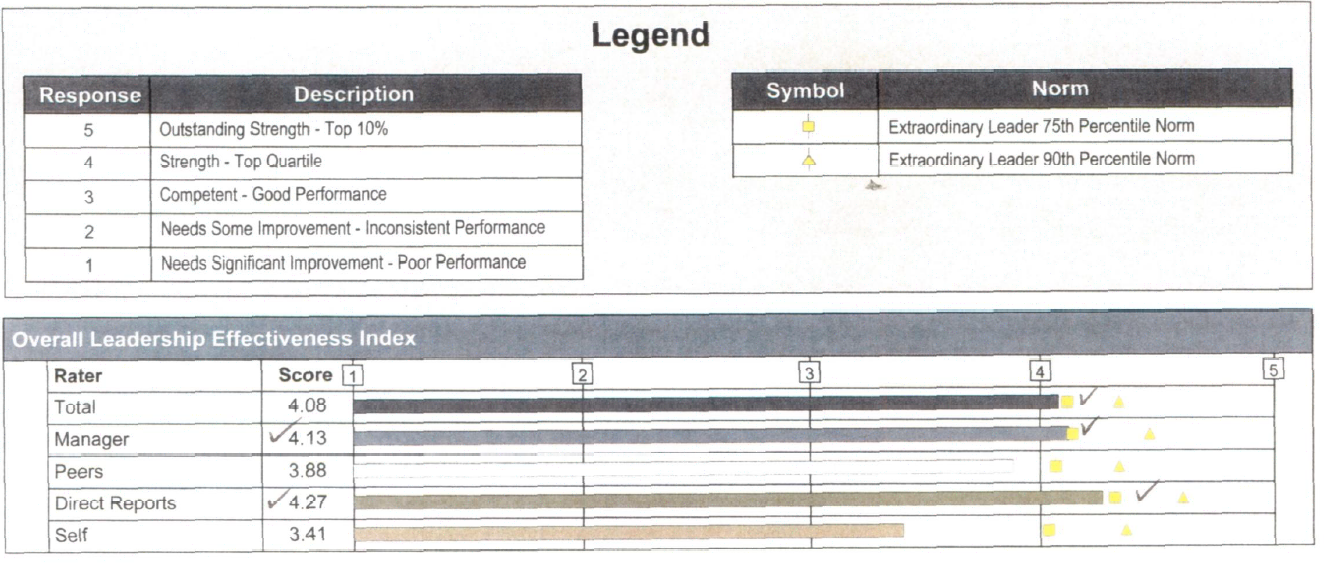
You would just have to bring it in as another reporting category that would show up as a bar in your graphs. I definitely think this would be a great thing to suggest as a product idea.

Clair
Badge +1
If i get them as a bar graph then there will be so many bar graphs as we need to show the comparison across each rater category. Let me see what best can be done around it.

Thank you!
Userlevel 5
Badge +15
Ah, I see. Yes, that's difficult. Sorry...I'm out of solutions beyond that!

Leave a Reply