
I am Giang Pham (Annie), a PhD student at RMIT Melbourne.
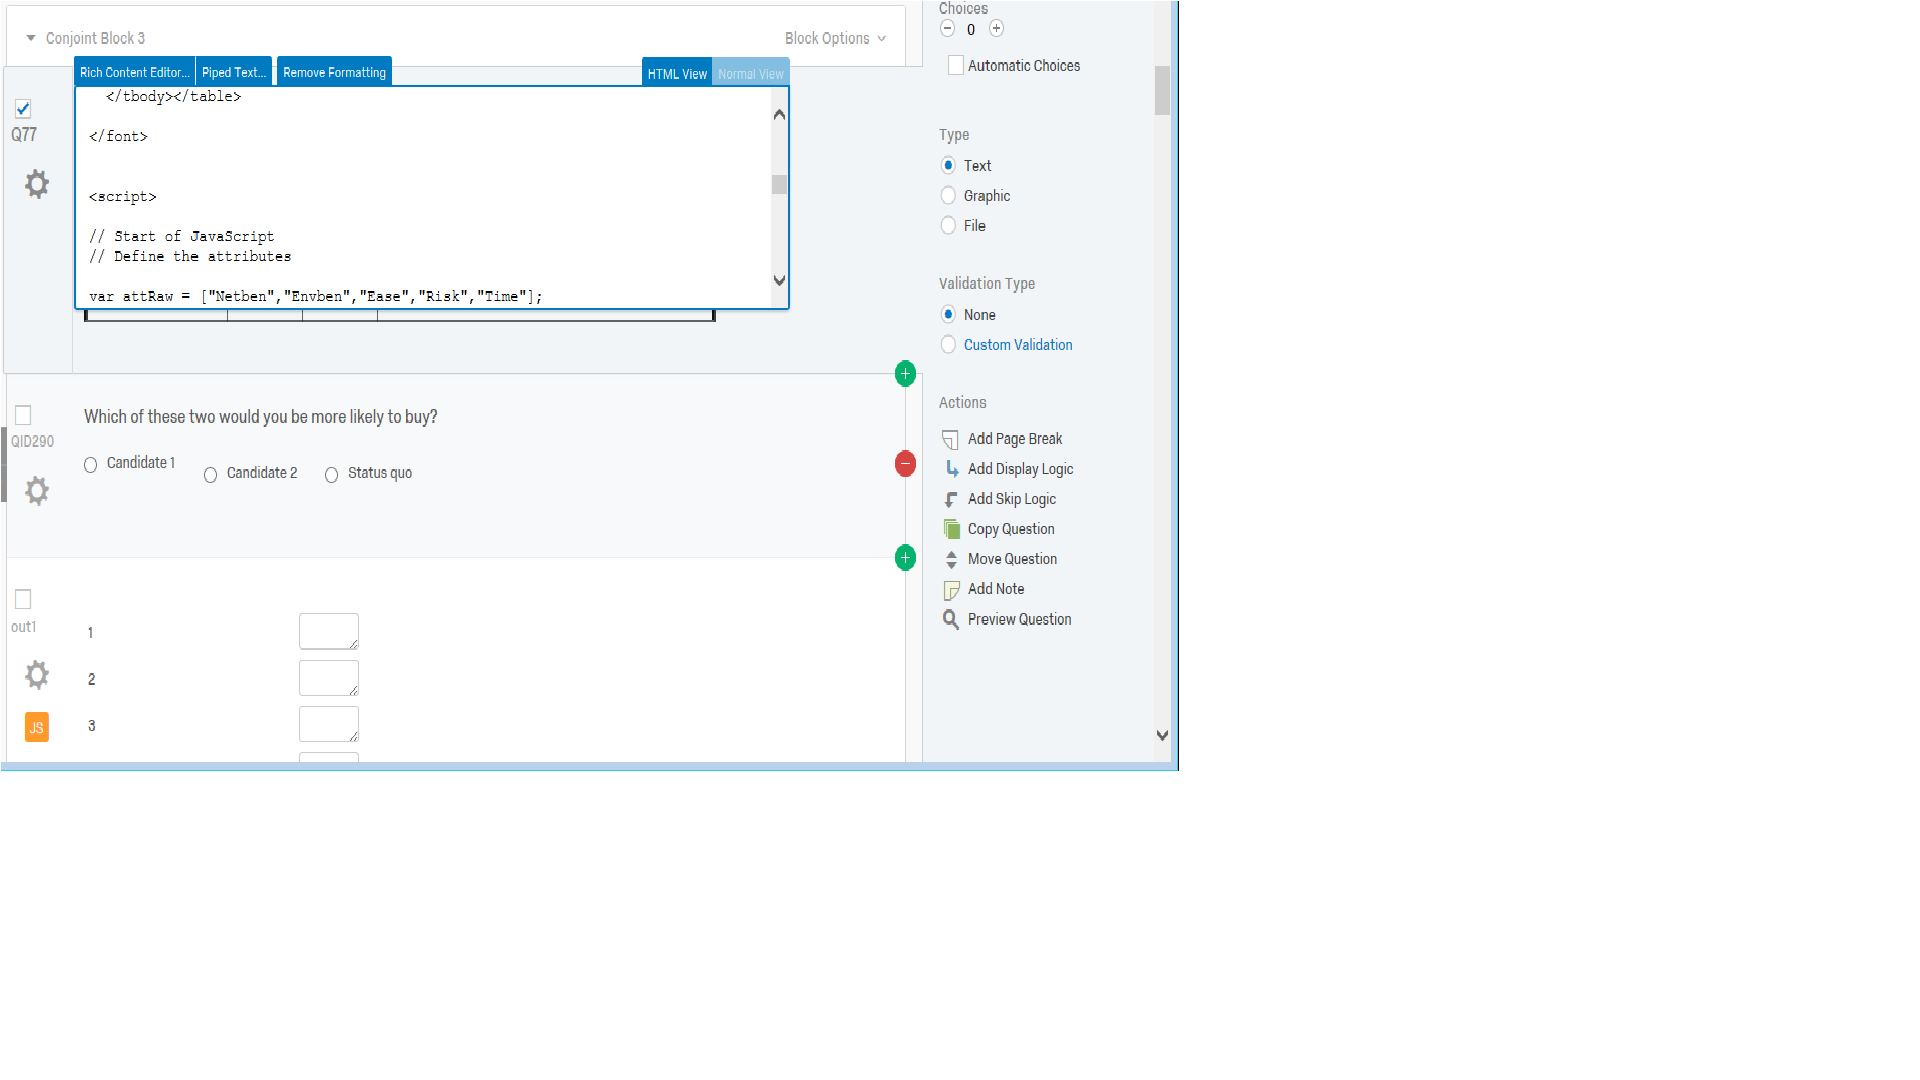
I am designing choice experiment (i.e. conjoint Analysis) in Qualtrics based on a template provided online by Kyle A. Dropp. (http://kyledropp.weebly.com/conjoint.html)
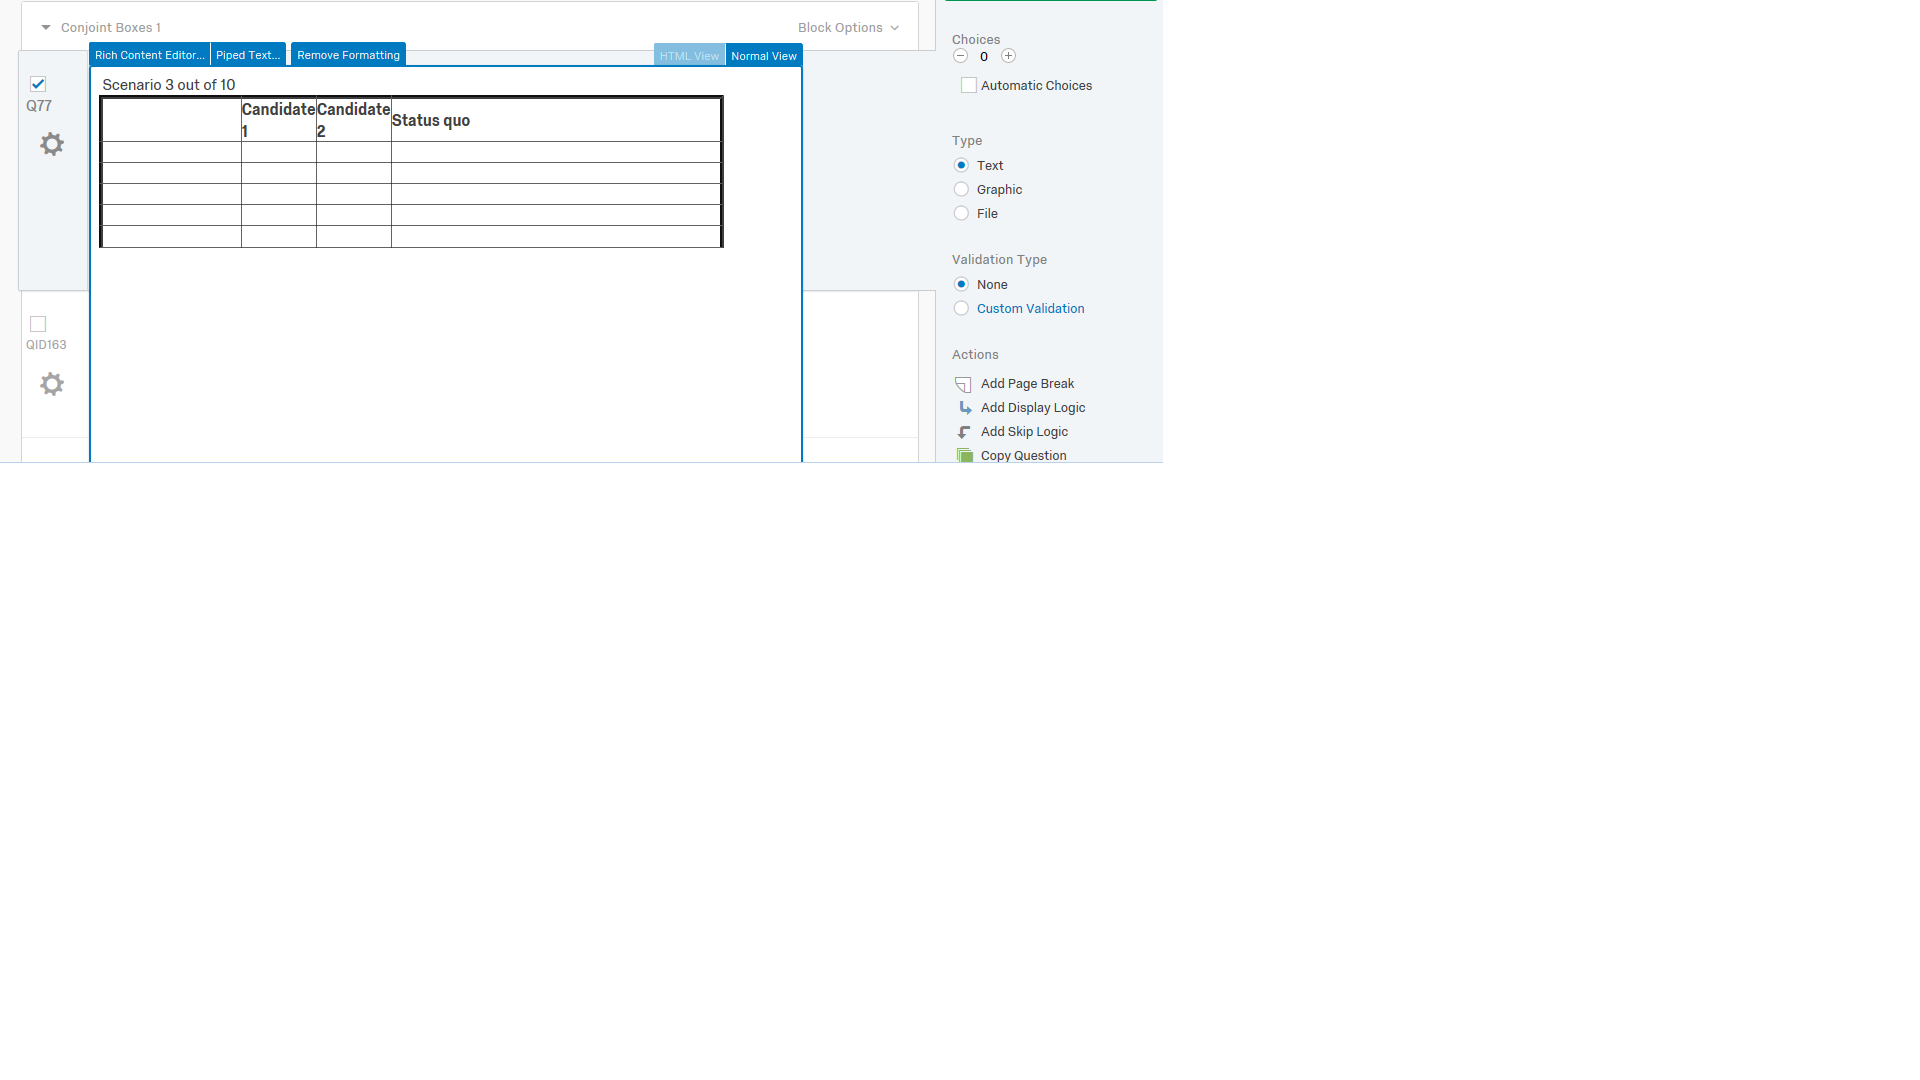
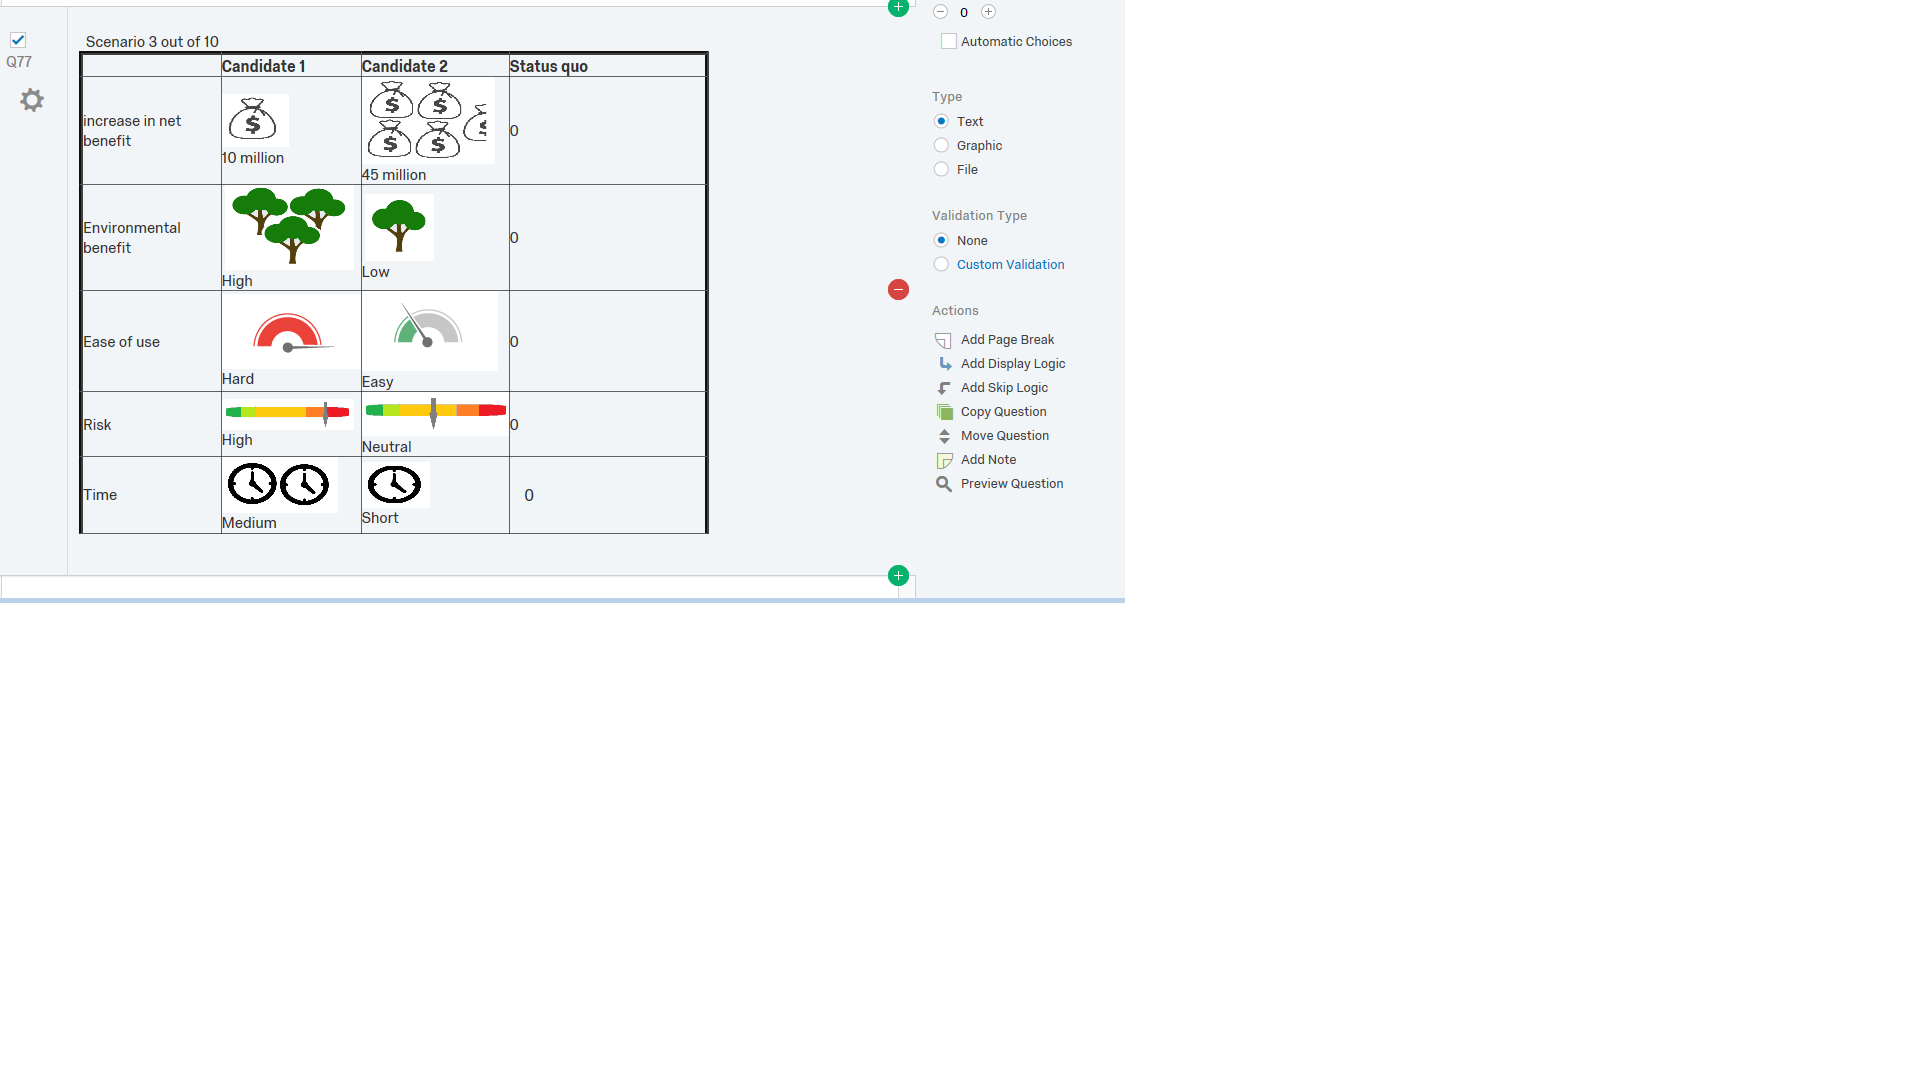
I have followed their instructions but in my experiment I want to add images which allow participants to visualize the levels of each attribute.
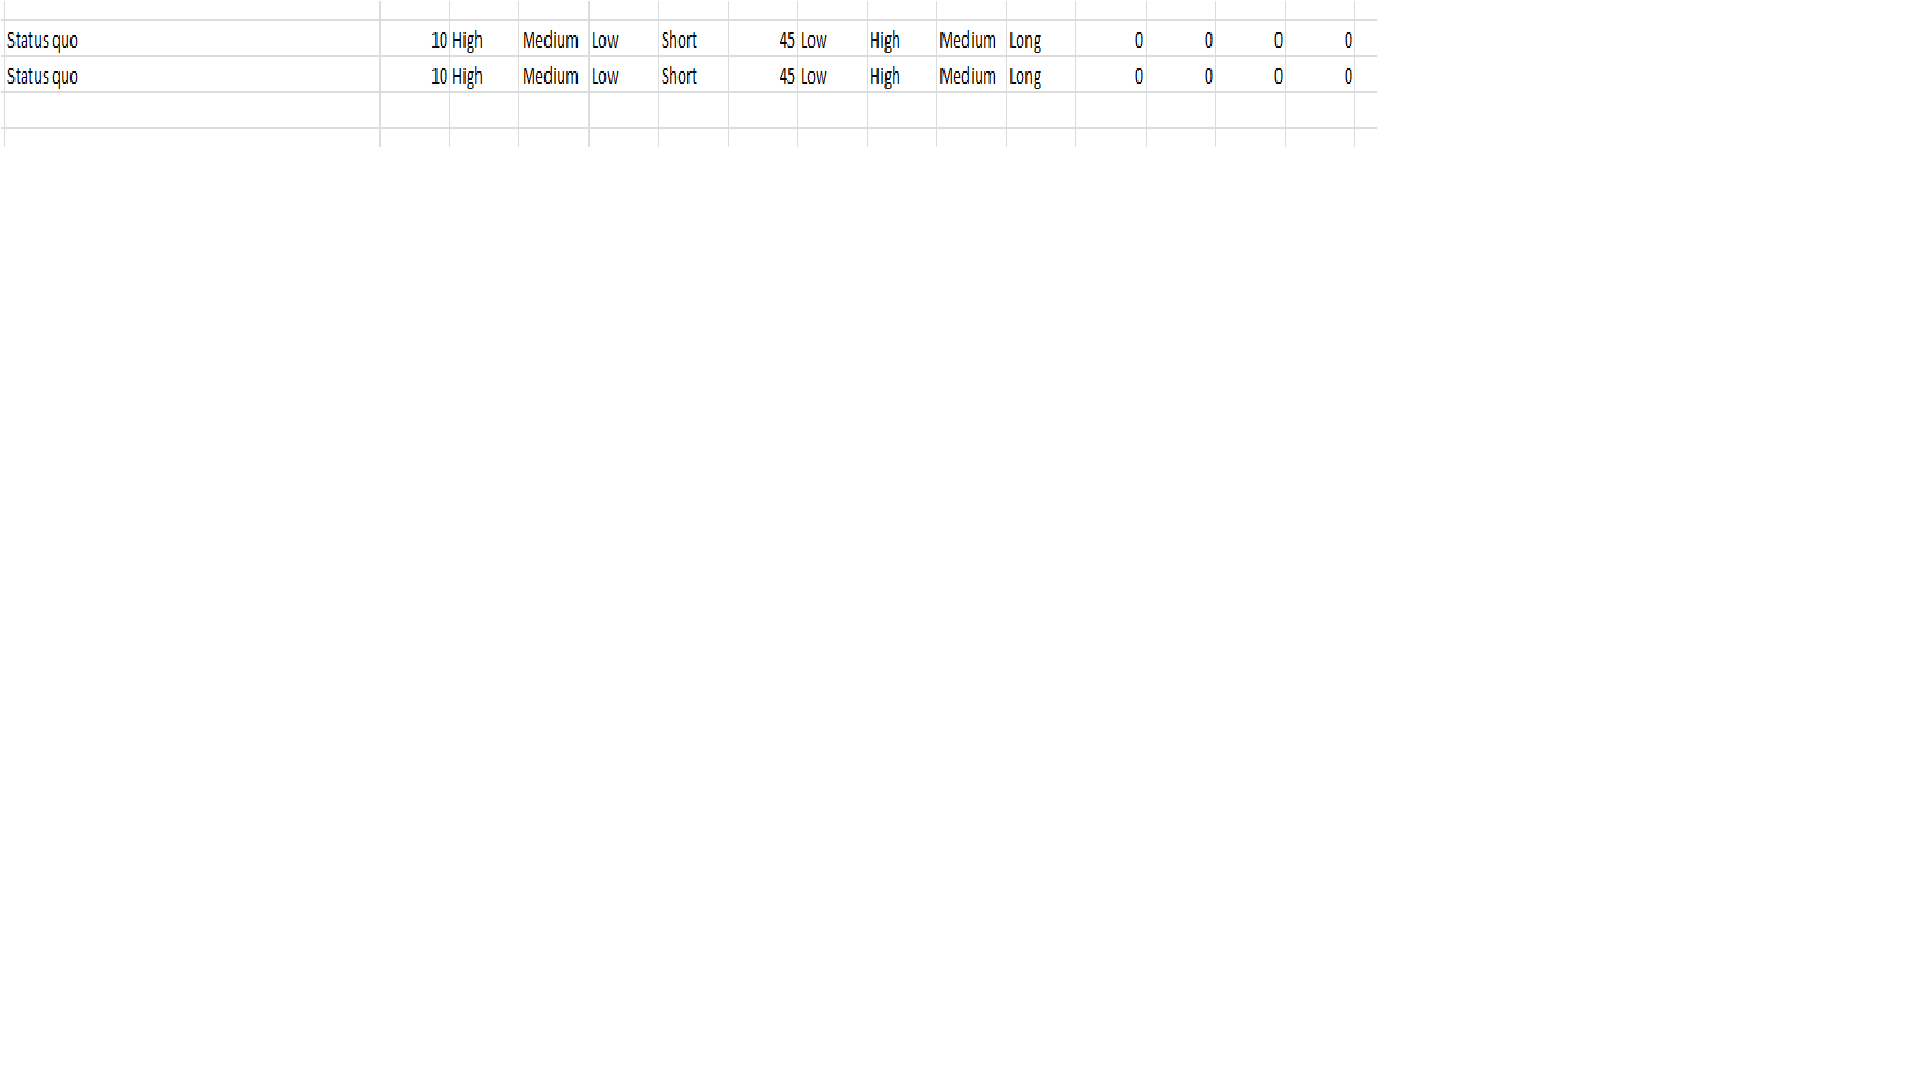
However, once I insert images to the given table (which is coded by html code), all of the information on participants’ choices disappears from the data file.
Could anyone please help me solve this problem? If it helps, I could provide an example of the problem using Team Viewer.
Best answer by TomG
View original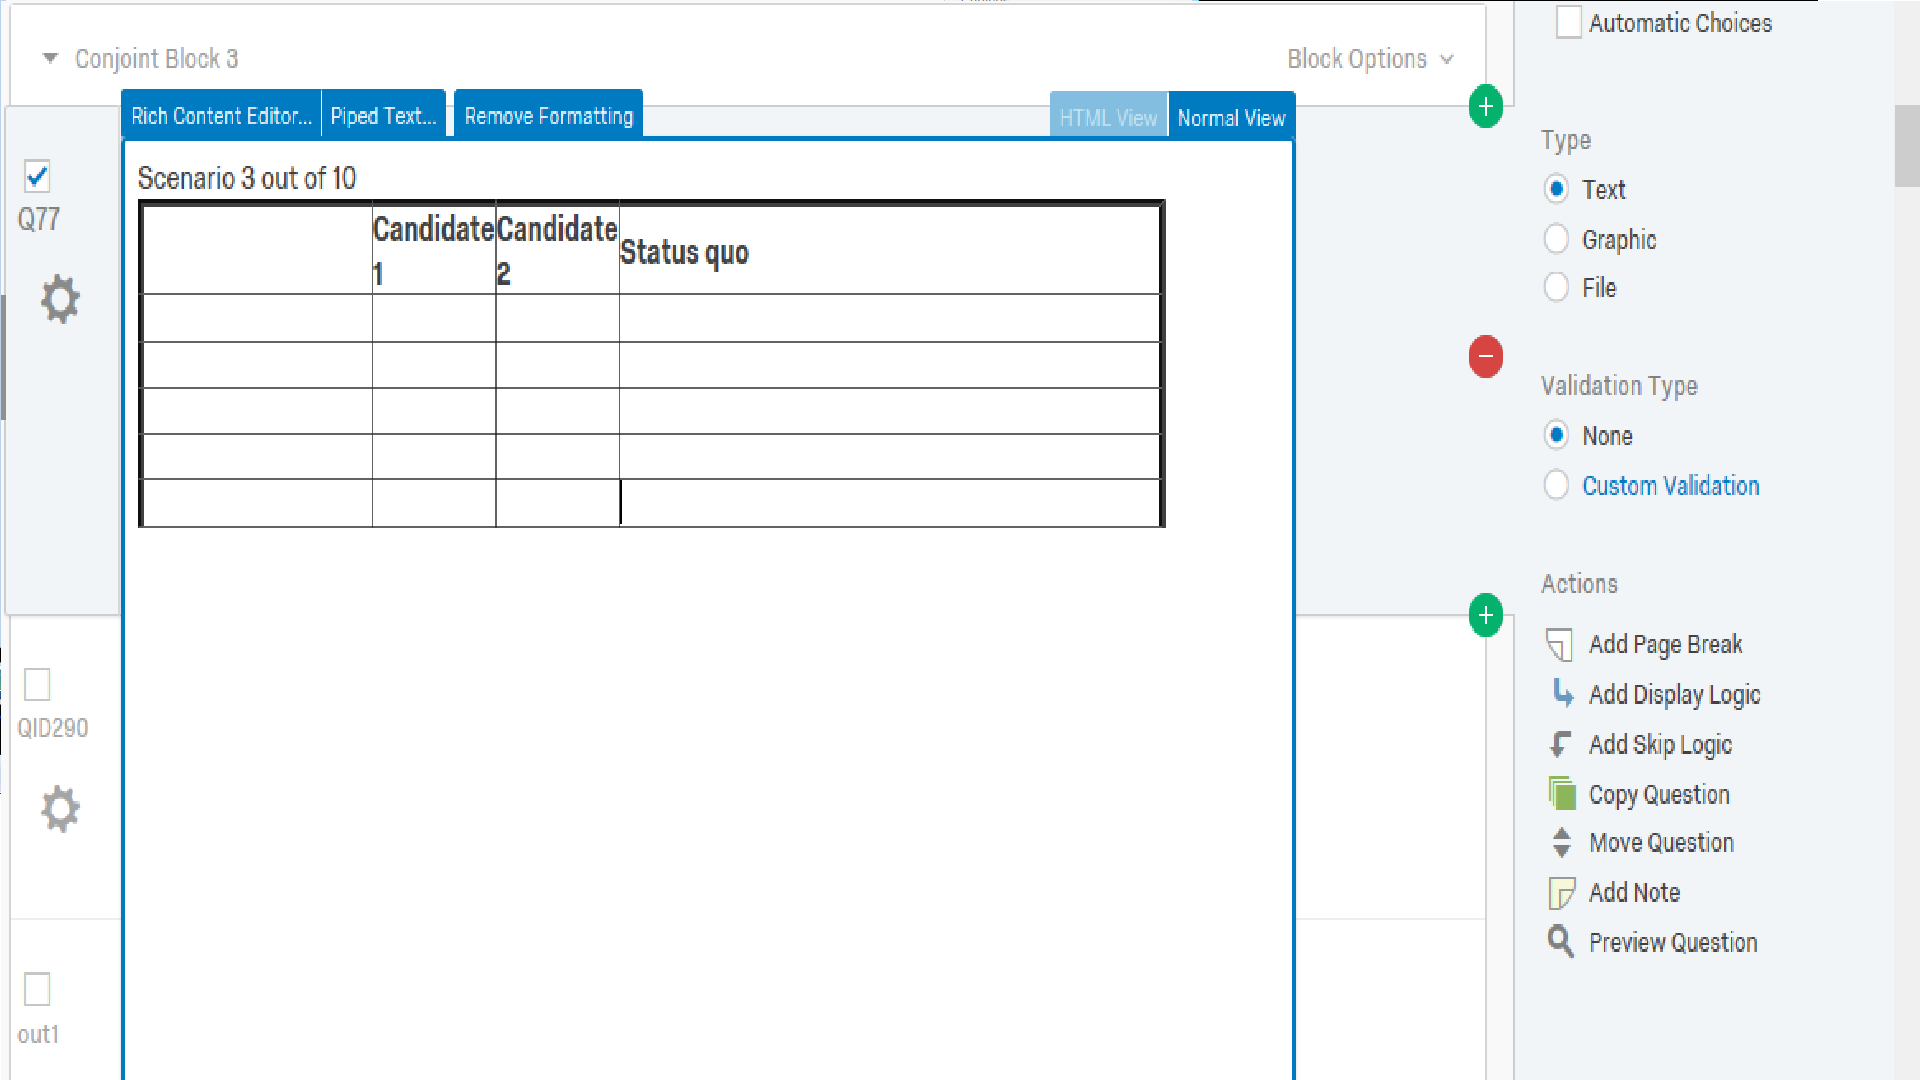


 )
) 