 XM Knowledge Base
What is NPS? (Net Promoter Score definition)
NPS stands for Net Promoter Score, which is a common metric used in customer experience programs. An NPS score measures customer loyalty by looking at their likelihood of recommending a given business.
Your NPS score is measured with a single-question survey and reported with a number ranging from -100 to +100, where a higher score is desirable.
NPS® is often held up as the gold standard customer experience metric. First developed in 2003 by Bain and Company, it’s now used by millions of businesses to measure and track how they’re perceived by their customers. NPS scores provide a snapshot of your overall customer experience; if customers are more likely to recommend your business, that naturally points to a high level of customer satisfaction and a positive customer journey.
NPS measures customer perception based on one simple question:
“How likely is it that you would recommend [Organization X/Product Y/Service Z] to a friend or colleague?”
Respondents give a rating between 0 (not at all likely) and 10 (extremely likely) and, depending on their response, customers fall into one of 3 categories to establish an NPS score:
- Promoters respond with a score of 9 or 10 and are typically loyal and enthusiastic customers.
- Passives respond with a score of 7 or 8. They are satisfied with your service but not happy enough to be considered promoters.
- Detractors respond with a score of 0 to 6. These are unhappy customers who are unlikely to buy from you again, and may even discourage others from buying from you.
Get started with our free NPS survey template
How do you calculate Net Promoter Score?
It’s simple to calculate your final NPS score – just subtract the percentage of Detractors from the percentage of Promoters.
For example, if 10% of respondents are Detractors, 20% are Passives and 70% are Promoters, your NPS score would be 70-10 = 60.

Detractors
(score 0-6) are unhappy customers who can damage your brand and impede growth through negative word-of-mouth.

Passives
(score 7-8) are satisfied but unenthusiastic customers who are vulnerable to competitive offerings.

Promoters
(score 9-10) are loyal enthusiasts who will keep buying and fuel growth by referring others.

What’s a good Net Promoter Score?
As we outline in this article about setting NPS goals, Bain & Company suggests the following scoring framework:
- Above 0 is good,
- Above 20 is favorable,
- Above 50 is excellent, and
- Above 80 is world-class
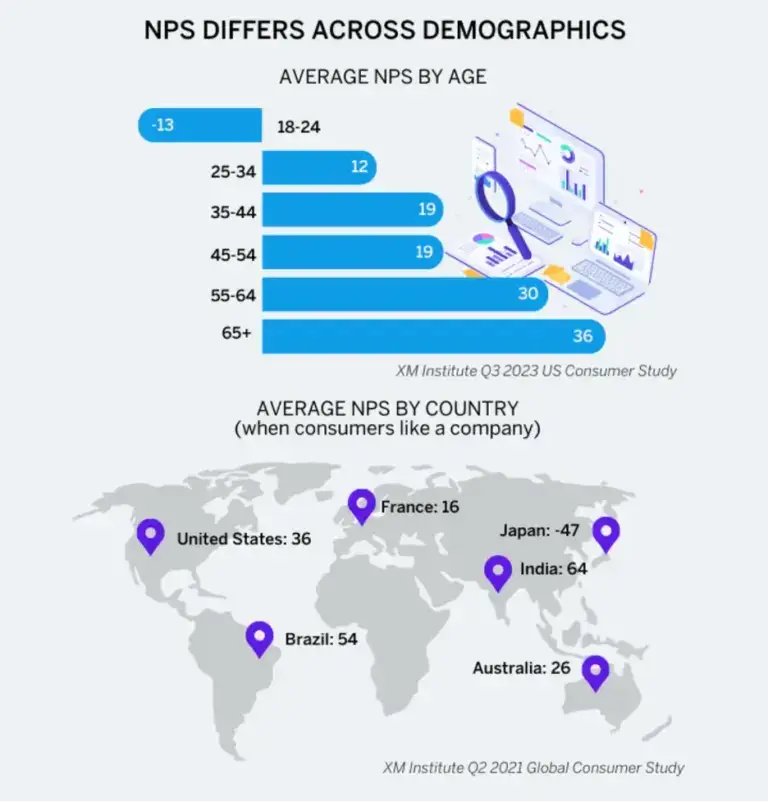
Ok, so you should shoot for ‘world-class’, right? Well, yes and no, While it might be easy to look at a scale that goes up to 100 and interpret that only 100 will do, in reality, it’s tricky to point to a single Net Promoter Score as being ‘good’ in absolute terms. That’s because different industries all have different benchmarks.
In research conducted by the Qualtrics XM Institute, for instance, the grocery industry was found to have an average NPS of 30 and the video streaming sector 29, while the consumer payments industry’s average was -6. Complicating things further, NPS survey responses often vary by age and location, with different demographics having different opinions on what constitutes a recommendable experience.
What that means is that it’s unwise to think about your NPS score in a vacuum. Instead, you should have two clear points of focus:
- How your Net Promoter Score stacks up relative to competitors in your market
- How your score improves over time.
That second point is probably the most important. NPS isn’t an isolated, fixed metric – it’s more like a temperature check that you take at repeated intervals. And, crucially, it’s what you do between those intervals to improve the customer experience that counts.
Transactional vs. relational NPS programs
Relational NPS surveys are deployed on a regular basis (i.e.- quarterly or annually). The goal here is to get a periodic pulse on your customers and understand how they feel about your company overall. This data is used to check the health of your customer relationships year-on-year and provide a benchmark for company success.
In other words? You’re using NPS as a barometer for the relationships you have with your existing customers.
Some companies, however, use ‘transactional NPS’ surveys, which are sent out after a customer interacts with your company (i.e.- a purchase or support call) with a view to better understand how that individual interaction went.
While the aim here is to try and understand customer satisfaction on a granular level and provide feedback about a very specific topic, that’s actually not a great fit for the way NPS works – so we don’t recommend using NPS on a transactional basis.
NPS is, at heart, a means to measure an overall relationship. If you go too granular with it, you run the risk of annoying customers by asking them for their opinion too soon, or on too small an interaction.
What can you measure using NPS?
You can measure almost anything using an NPS score. In addition to understanding the overall NPS for your organization, you can track scores for everything from individual products, stores, web pages, or even staff members.
Consider implementing NPS into marketing or customer experience strategy because it can be used with industry NPS benchmarks to see how you’re doing compared to your competitors. It will help you understand your target market better and see how they respond to your product or service, social media campaigns, and customer service agents. The goal is to gain loyal customers who become brand evangelists instead of consumers.
Get started by measuring your NPS score with this free template
The perils of employee NPS (eNPS)
While most Net Promoter Score surveys are designed to collect customer feedback they can also be used to measure employee sentiment, or what is commonly referred to as employee net promoter score (eNPS). eNPS measures how likely your staff members are to recommend your company as a place to work.
Qualtrics recommends against using eNPS to measure employee feedback in favor of other more comprehensive survey methodologies – like employee engagement surveys.
That’s because eNPS lacks the complexity an engagement survey has; it’s only one question, it doesn’t give you a complete picture of employee health, and you won’t know where to make improvements once you get the data.
Get started with our free NPS survey template
In fact, there are a range of limitations in using NPS in the EX field:
- Unlabeled scale points and poor readability
- Employees’ biases around how NPS works
- Smaller sample sizes make for a higher margin of error
- Complex, unscorable employer-employee relationships
- Limited actionable insights
How to run surveys and collect NPS customer feedback
How do you create an NPS Survey?
NPS surveys are relatively easy to create (in fact free templates like ours mean the work is done for you) but you must think about the long-term data use when deciding how you’ll administer them.
You could use survey software, but that will limit your ability to take action on the results because it only measures one metric. We recommend using a Customer Experience Management solution or NPS software to get a comprehensive view of your customers. Customer experience management solutions allow you to keep track of all the interactions your company has with your customers, both current and potential.
You can then use NPS data to see which touchpoints have high NPS scores and which touchpoints have lower scores.
Demographic questions
It’s not uncommon to start an NPS survey with demographic questions like age, gender, income, etc. This response data can be helpful when you are creating segmentation during your research and analysis. Try to avoid demographic questions in the survey if they are not needed, or you can get the answers from data you already have in other systems, like a CRM or customer database. Remember, the fewer survey questions the better.
The Net Promoter Score question
This is the core question that we mentioned earlier which will be the primary way you measure your score. The other questions mentioned are used to make the data easier to analyze and follow up with the respondent to address their feedback.

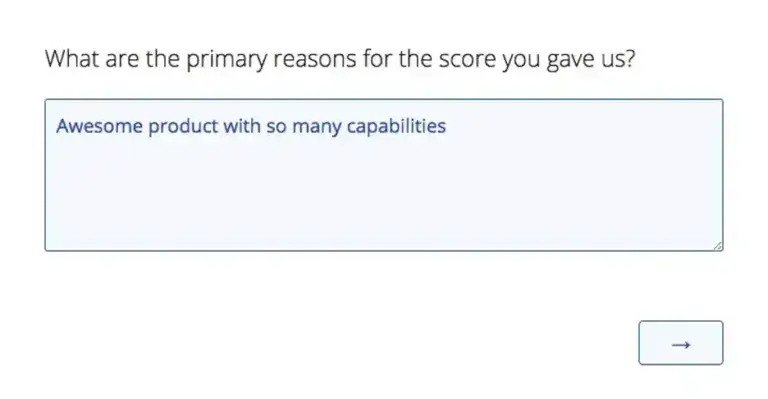
What’s the reason for your score?
In this open-text question, you ask the customer what their primary reason for giving the numerical score in the previous question is.
This will help you discover the drivers for promoters and detractors in your responses. Going through the open text feedback can be a time-consuming process, so consider using a text analysis tool like Text iQ. If you are fielding more than a few dozen responses in your distribution a text analysis tool will save you a lot of time.
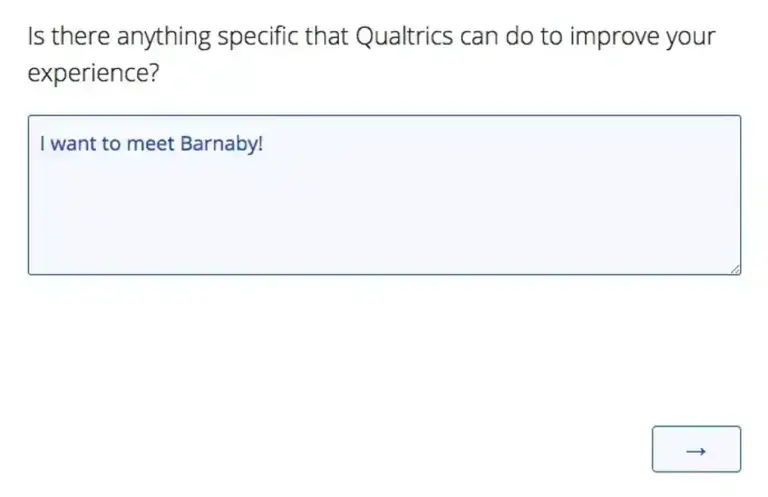
How can we make your experience better?
In this question, you ask the respondent to suggest what you can do to improve their experience. This can be helpful if you are planning to do close-loop follow-up and customer ticketing with your responses.
If you know this answer you already have a headstart to resolving the issue directly with the customer. Keep in mind, that not all cases will need both the “reason for your score” and “how could we improve” questions as many times that will have the same answer. For example, if the reason they gave a bad score was, “long call waiting times”, the way to improve the experience will probably be to “shorten wait times”.
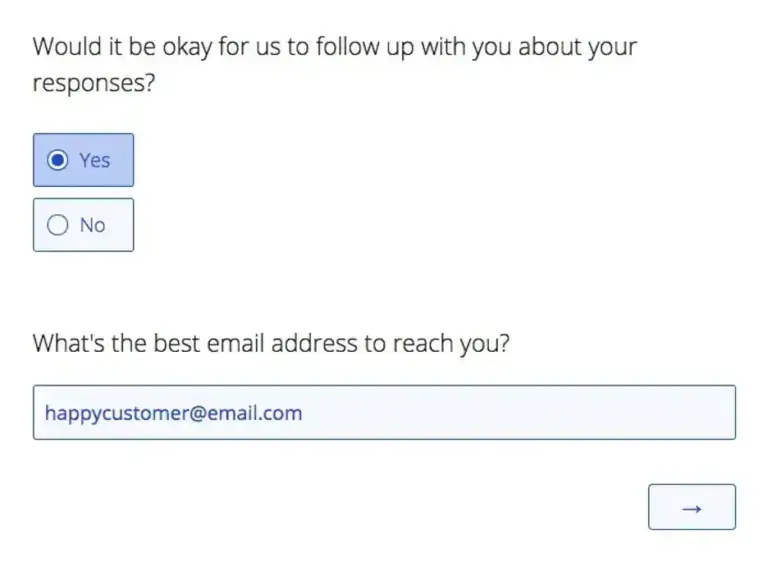
Permission to follow up with the customer
It’s a good practice to ask the survey respondent if you can follow up with them if needed, but not everyone will want to talk to someone about their issues. Depending on how your survey was distributed, you may or not have that customer’s email or phone number, so don’t forget to ask for it if you need to.
Don’t ask for this information if you can get their contact info with metadata from another system, similar to the demographic question mentioned earlier.
Learn more about Net Promoter Score questions
What can you do with your NPS score?
NPS is an indicator. It provides an overall metric to track and allows you to monitor product, service or organization improvements. But there is so much that influences NPS.
A such, it’s important to think of NPS as part of an ongoing process of improvement. The customer experience that dictates NPS scores is made up of a huge number of touch points, interactions and channels – digital and physical, during pre-purchase and in post-sale customer support. Every time you run an NPS survey and calculate your score, you have an opportunity to measure against past performance and work out how you can improve things for next time.
But because NPS is the signal, rather than the source, that means collecting other data sets around the customer experience. Contact center software and customer experience management software can help here; you’re looking for tools that can analyze interactions across channels and highlight trends. If customers are having to make repeated contact about the same issue, for example, you’ll know that something needs to be fixed along the customer journey.

Abandoned carts and rage clicks might indicate a UX issue. Long agent handling times or low script compliance will result in poor customer service. A spate of high ‘effort score’ interactions probably means there’s a common issue creating an experience gap that needs closing.
The more data you can collect and analyze alongside your NPS score, the more you’ll be able to understand what’s driving your customer experience, allowing you to prioritize your improvements to have the biggest impact on your customers.
It’s only when you can find and act on trending issues – quickly – that you’ll be able to build the kinds of relationships with your customers that drive high NPS scores.
Put simply? NPS is a benchmark – one that can always be improved by proactively improving each aspect of the customer experience.
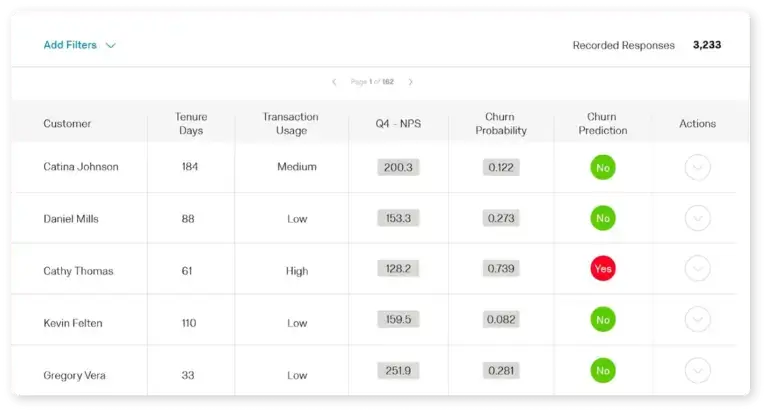
Using NPS survey responses as input into a customer churn model
Layering customer churn data on top of customer experience metrics like NPS can help you predict when a customer is likely to cancel or unsubscribe from your service. This can help you link your experience data (X-data) to operation data (O-data), and it can help you build systems and customer journeys that better mitigate against churn.
In the past, creating a customer churn model was the work of advanced statisticians, but with Qualtrics® Predict iQ, you can set up a model and start identifying customers who are likely to leave and have a customer care team to follow up with them.
Segmentation in your NPS survey responses
Segmenting your customer’s NPS scores is a powerful way to see if you notice patterns that suggest ways to improve certain touchpoints or experiences. Segmentation can be done by behavior, demographic, social class, or market.
What’s most important here is to solicit NPS scores along the entire customer journey – to ask for feedback through the customer’s preferred channel, at the right moment, and then monitor those metrics over time as you make changes.
Net Promoter®, NPS®, NPS Prism®, and the NPS-related emoticons are registered trademarks of Bain & Company, Inc., NICE Systems, Inc., and Fred Reichheld. Net Promoter ScoreSM and Net Promoter SystemSM are service marks of Bain & Company, Inc., NICE Systems, Inc., and Fred Reichheld.
Get started with our free NPS survey template