 XM Knowledge Base
Customer service is a core component of excellent customer experience (CX). It matters at every customer touchpoint, and has the power to impact your sales – 52% of U.S. customers have switched providers in the last year because of poor experiences.
Using the right metrics can help you keep tabs on where you are now, where you’re doing well with customers and how you need to improve. We’ve laid out the key points, so you can begin adding them to your strategy.
Free eBook: How to get your customer service right, every time
What are customer service metrics?
Customer service metrics are the units of measuring the state of your customer’s happiness levels, which in turn indicates if your customers will buy more, respond well to, and advocate for your brand.
The top customer service metrics you should measure are:
- Customer Satisfaction (CSAT)
- Customer Effort Score (CES)
- Net Promoter Score (NPS)
- Social media metrics
- Customer churn
- First response time
- Overall resolution rate
- First contact resolution rate
- Customer ticket request volume
- Average ticket handling time
Why are customer service metrics important?
You can be carrying out great sales or marketing initiatives to enhance your customers’ shopping or user experiences, but if you’re not measuring their impact you won’t know how successful you’ve been, or where and how you need to improve. Not to mention all that time, energy and money wasted.
They can answer performance questions, like:
- How well are the support teams functioning to provide first-class service?
- How far do our brand, product, or service key messages resonate with our customers?
- What do our customers really think of us?
- How easy do we make it for customers to engage with us?
- How efficient are the sales processes within our organization?
Explaining experience (X-data) and operational (O-data) metrics
As experts in customer experience, we’ve helped over 11,000 brands to improve their results. We do this by looking at metrics for operational data (O-data) and experience data (X-data).
Operational data. Sales revenue is only one metric (O-data). It’s the data your brand sees – the number of new customers, website visitors, call center volumes, sales figures and more. It’s useful, but it presents only part of the picture – how something has performed in the past and what exactly happened.
Enter…
Experience data. (X–data) provides the context for how customers have actually experienced the service – and importantly ‘why?’ they feel the way they do about your brand. This is human feedback that points to the gaps between what you think is happening and what’s really happening. Using experience data allows you to see the big picture so you can focus your efforts in areas that are most likely to improve the outcomes of the business.
Both types of data are needed for the best picture of what your customers do, desire and feel, and how you can help them. Measure your customer relationship by using these metrics that cover these two data types.
CX Study: Learn how to increase the ROI of your customer experience
The top 10 customer service metrics to measure
1. Customer Satisfaction (CSAT)
CSAT (Customer Satisfaction) is a commonly used key performance indicator to track how satisfied customers are with your organization’s products and/or services.
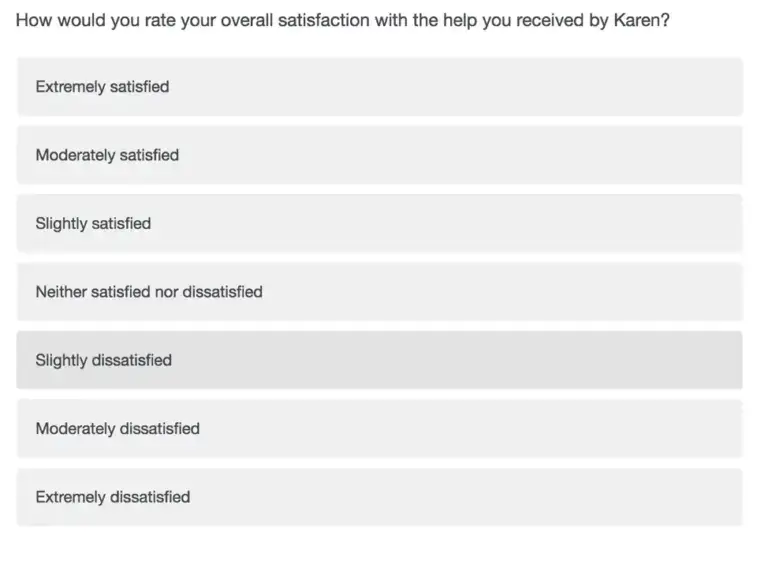
As an experience metric, CSAT uses multiple questions to focus on specific parts of the customer experience. For example, it might ask ‘How would you rate your overall satisfaction with the telephone service you received?’ Or it might ask about the helpfulness of the assistant or how satisfied you were with the delivery experience. The customer is then given a scale 1-5 to record their answer.
How to measure it: Calculate the (Number of satisfied customers [those who answered with 4s and 5s] / Number of survey responses) x 100 to get the percentage of satisfied customers.
Only responses of 4 (satisfied) and 5 (very satisfied) are included in the calculation, as it has been shown that using the two highest values on feedback surveys is the most accurate predictor of customer retention.
Start measuring CSAT today with our free customer satisfaction survey template
Tip: Measure customer satisfaction after each interaction with a customer service agent. These ratings can be measured over time to analyse how certain agents or teams are performing.
2. Customer Effort Score (CES)
CES is a single-item experience metric that measures how much effort a customer has to exert to get an issue resolved, a request fulfilled, a product purchased/returned or a question answered.
The idea is that the customer will be more loyal to brands that are easier to do business with. By focusing on reducing customer effort, you’ll create a better experience for your customer.
How to measure it: In your surveys to customers, you ask questions that can be answered with numerical information. Then, you calculate the scores to get an average score.
For instance, if you ask, “On a scale of 1-7, how much effort was involved to get your question answered?”, you would take the average number to summarize the data into one value.
Tip: You might be tempted to see the CES results as either black or white. But there are shades of grey that come out when you combine your information with the other metrics in this list.
For instance, your customer may have a great relationship with your company but had a bad interaction this one time. If you only looked at CES you would think he wouldn’t be a loyal customer, but that might not be the case.
3. Net Promoter Score (NPS)
NPS stands for Net Promoter Score which is an experience metric used in customer experience programs. It’s often held up as the gold standard customer experience metric.
NPS scores are measured with a single-question survey and reported with a number from 0-100, a higher score is desirable. Customers are bucketed into promoters (score of 9 or 10), passive (score of 8 or 9), and detractors (score of 0-6). This will allow you to gain a bigger picture of loyalty.
How to measure it: Calculate the (Percentage of Detractors) – (Percentage of Promoters). The result is your NPS score. Ideally, you want this number to be as close to 100 as possible, and your score can be altered over time if you recheck it at intervals.
For example, if 10% of respondents are Detractors, 20% are Passives and 70% are Promoters, your NPS score would be 70-10 = 60. This is good, but you have some areas you can improve – below is an example of a company changing its detractors into brand promoters over time.
Tip: If you’re thinking this is similar to [1. CSAT], you’re right. The difference is that CSAT measures customer satisfaction with a product or service, whereas Net Promoter Score (NPS) measures customer loyalty to the organization.
Start measuring Net Promoter Score today with our free template
4. Social media metrics
Many customers voice both their frustrations and praises on social media, yet few brands embrace it and respond back. This creates a frustrating, one-way experience for the consumer.
By tracking social media experience metric data, you not only know when to respond to a customer, but understand what feedback they’re providing, so you can put better systems in place to address issues and keep what’s working.
These indicators of performance include:
- brand mentions over time
- negative comments
- technical or account questions
- the number of questions that could be answered through other support material
How to measure it: Take the above criteria and complete these each month, to measure and analyze its month-to-month variation and to understand overall trend directions.
Tip: Invest in a social media strategy with the social media team, or at the very least know how to view and collect data from each social media platform.
For example: some platforms, like LinkedIn Analytics, have their own complementary data platform, which don’t appear on the main site by default. This can catch out the best of people.
5. Customer churn
Customer churn, also known as customer attrition, in its most basic form is when a customer chooses to stop using your products or services. This experience metric is trickier to measure because there’s no one predictor of churn. You must look at both operational insights (e.g. declining repeat purchases, reduced purchase amounts) whilst their experience along the customer journey is foundational to predicting if they will churn.
For example, a customer who has declined in recent visits and gives a lower Net Promoter Score after their latest shopping experience, could have an increased probability of churning.
How to measure it: Identify what factors might make your customers churn, and then measure them month-on-month. But that’s not all, consider what you need to do to retain them, and what the underlying issues are that need resolving.
Tip: Alternatively, Predict IQ is a user-friendly tool to help you identify customers and accounts likely to churn, by analyzing the data for you. (Book a Predict IQ demo to see how it works.)
What do you ask customers? If you’re ready to start surveying your customers with X and O-data, check out our next article: What questions should I ask on a customer service survey?
6. First response time
According to research by Forrester, 77% of consumers say valuing their time is the most important thing a company can do to provide a great customer experience. When a customer reaches out with a question or concern, they want a fast reply, so measuring first response time can be a useful operational metric to ensure customer queries are being solved quickly.
While it’s beneficial to send an automated reply to show that their feedback has been logged, what really matters is how quickly and easily that feedback is acted on. Use these benchmarks as a starting point when responding to customer queries or concerns:
- Email or online form – 24 hours or less
- Social media – 60 minutes
- Phone – 3 minutes
- Live chat and messaging – Instant
How to calculate it: Calculate the (Time of first response – time of customer request). This will give you the [#minutes/hours/days] first response rate. Then, try to beat it.
Tip: When you get negative reviews or comments online, some people would rather not rush into a response. While this is true, leaving a response too late is another risk. In these cases, think ahead about a framework that employees can use to action these replies quickly in the right way. Read our dealing with negative reviews online article for more ideas.
7. Overall resolution rate
When your customer has a question or complaint, your goal is to close the loop and resolve the issue. If you don’t respond or can’t provide adequate support, the customer may be reluctant to do business with you again. Rising resolution rates can indicate the effectiveness of your customer support team, making this operational metric worth your time.
How to calculate it: Calculate the (Total number of tickets / the number of tickets solved) to get the overall resolution rate metric.
Tip: Take time to sort out the data into groups and analyze the frequent questions or complaints. With this knowledge, create a FAQ or ‘cheatsheet’ that deals with these, so that you can help your customers self-resolve or speed up the time to resolution.
8. First contact resolution rate
Customers don’t like to be bounced around from agent to agent and want their issues resolved on the first point of contact. The first contact resolution rate measures how many cases require only one contact from the customer.
It can be a good operational metric to watch out for, as a high first contact resolution rate will likely correlate with CES – the customer will produce less effort if they only have to contact your organization once.
How to calculate it: Calculate the (number of incidents resolved on the first contact / total number of incidents) to get the first contact resolution rate.
Tip: In addition, you can also measure the average number of replies it takes for a customer to get their issue resolved, and the amount of time it takes from when the customer submits the ticket to resolution.
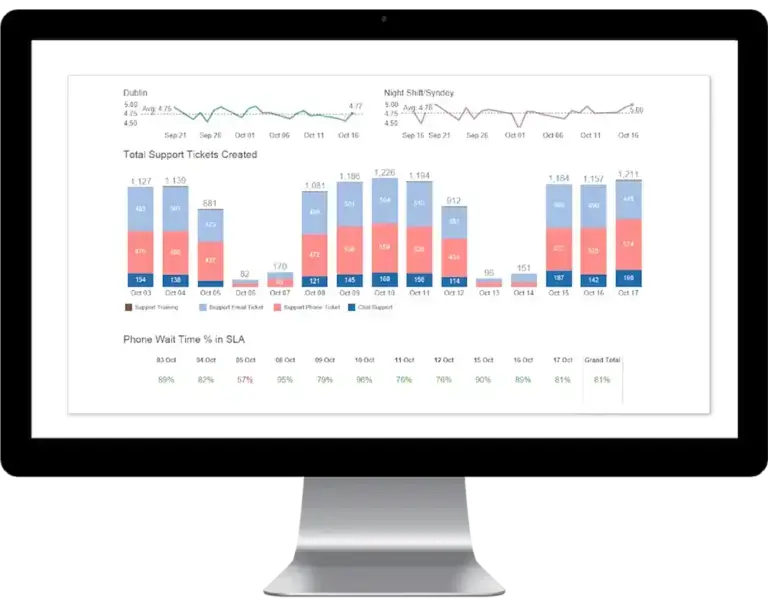
9. Customer ticket request volume
While it’s good that customers are interacting with your company and you have an accessible ticketing system, getting too many requests can indicate an issue. Keeping tabs on this operational metric can flag this issue before it becomes a real problem.
How to calculate it: Compare the amount of support tickets month over month or week over week. Pay particular attention if the number of tickets spikes after a new product or feature release.
Tip: If you have an overwhelming amount of tickets, you either need to hire more customer support agents or look into a potential problem with your UI/UX. You could also try updating your support articles so customers can get help on their own.
10. Average ticket handling time
The handling time measures the amount of time an agent actually spends working on a single case. The shorter the time, the more efficient your team is. It’s important not to focus on this operational metric alone, because agents may rush through customer tickets instead of focusing on great customer service to improve it.
How to calculate it: Your goal is a shorter handling time, so your agents can be more effective. Have a time-tracking system where agents manually or automatically track their time per ticket, and review the average time over a period of a week and a month.
You could also compare it to last year’s data, so you can see if there has been a long-term change.
Tip: There will naturally be times that customer agents will be caught up on longer calls. Don’t ignore them. Single out these and explore what the matter was about, as these could point to underlying issues for improvement in the experience, or process optimization.
Making data-informed decisions
Of course, there’s more to customer experience and service than just keeping tabs on metrics.
Action has to be taken to make sure the insights you get are useful – and that you actually make improvements to your service.
Rather than just focusing on the data, you need to look at metrics as a way to measure your customer relationship health, not as the end of your customer relationship efforts.
Metrics alone will only get you so far. Instead, use these to inform your customer experience program that has action at its heart. And then use these metrics to track the impact of your actions. This is how to get the most out of your customer service metrics.
CX Study: Learn how to increase the ROI of your customer experience