-

Qualtrics Platform -

Customer Journey Optimizer -

XM Discover -

Qualtrics Social Connect
Running a Pulse Program with a Hierarchy (EX)
About Pulse Programs
An employee pulse program is an employee feedback program designed to collect feedback on a more frequent basis, usually quarterly or monthly. Pulse projects are characterized by shorter surveys that track how the same participants respond to the same set of questions over multiple periods. This page will walk through how to run a pulse program using Employee Engagement projects.
General Overview of a Pulse Program
Below is an overview of the main steps for running a pulse program. Click a linked section for information, or continue scrolling to start at the beginning.
- Creating the First Pulse
- Building the survey
- Uploading participants & generating a hierarchy
- Distributing the pulse
- Building the dashboard
- Distributing the dashboard
- Creating Subsequent Pulses
- Copy project
- Import participants, generate hierarchy, & map units
- Distributing the pulse
- Map historical data
- Making comparisons
- Distributing the dashboard
- Repeat the “Creating Subsequent Pulses” workflow for each pulse
Creating the First Pulse
Step 1: Building the Pulse Survey
Building a pulse survey is no different than building a regular Engagement survey. Below is a list of resources to get you started on building your survey:
- Creating & Editing Questions
- Question Behavior
- Look and Feel
- Survey Flow
- Survey Options
- Survey Tools
Pulse programs are characterized by short surveys and straightforward questions. Visit this page for best practice advice from our Qualtrics subject matter experts. Click here to download a document with sample questions developed by our EX team for measuring engagement and manager effectiveness.
Step 2: Uploading Participants & Generating a Hierarchy
After building your survey, you should upload your participants with any relevant metadata, and then generate your org hierarchy. Follow the below workflow to upload participants and generate your hierarchy.
- Hierarchy Basic Overview: Use this page to decide what type of org hierarchy makes sense for your organization.
- Preparing Your Participant File for Import: Use this page to learn how to configure your participant file for your desired org hierarchy setup.
- Importing Engagement Participants: After creating your participant file, follow the instructions on this page to upload your participants.
- Generate Your Hierarchy: After importing participants, generate your org hierarchy. This step varies slightly depending on which type of hierarchy you choose. See Generating a Parent-Child Hierarchy or Generating a Level-Based Hierarchy.
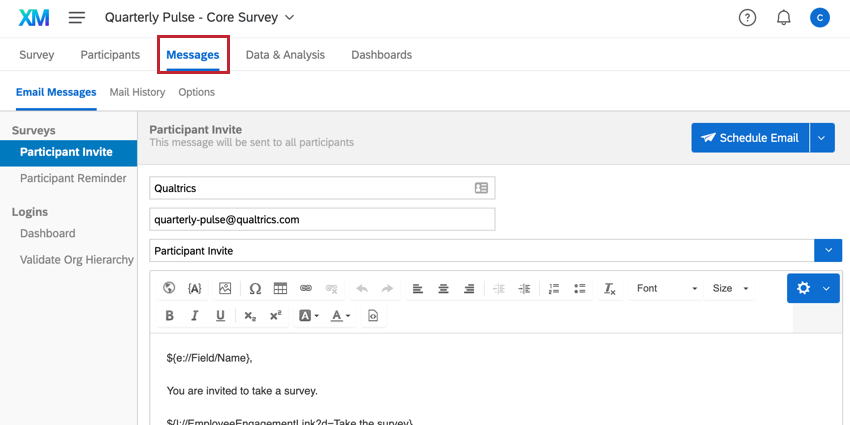
Step 3: Distributing the Pulse
Once you’ve added participants and created an org hierarchy, it’s time to launch your pulse program! To distribute your pulse, head over to the Messages tab and configure your Participant Invite. See the Email Messages support page for more information.
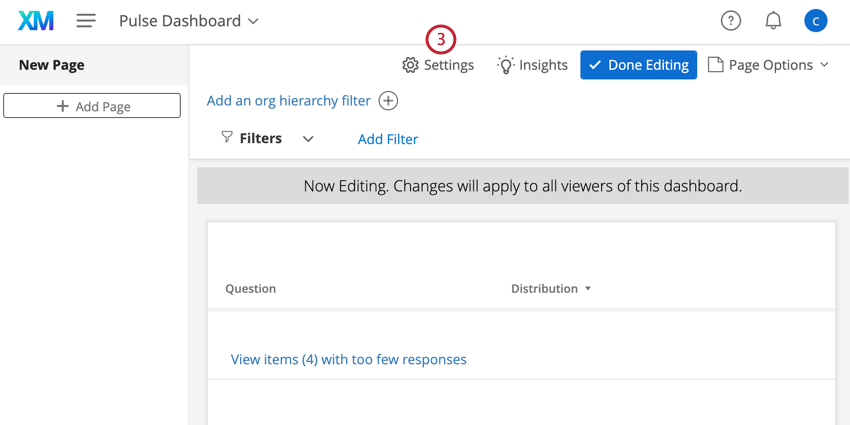
Step 4: Building Your Dashboard
Now it’s time to begin building your dashboard for visualizing data across multiple pulses. This dashboard will be the template for all of your dashboards during the pulse program. As you run additional pulses, you will map your historical data into the newest pulse’s dashboard. More information about data mapping will come when we run our additional pulses. Let’s focus on getting the dashboard up and running first. See the below resources for guidance building your dashboard:
- Reporting on Your Engagement Project Results: This page contains an overview of the features available in a dashboard.
- Adding & Removing a Dashboard: This page explains how to create a new dashboard.
- Dashboard Basic Overview: This page explains how to edit your dashboard.
Step 5: Distributing the Dashboard
Once your dashboard is built, it’s time to share the dashboard with your participants! To do this, you will give your participants permission to access the dashboard, and then send them a dashboard login email. We recommend using roles to make giving dashboard access to many participants easy.
See the support page on Configuring Dashboard Access for more information on giving access to your dashboard.
Creating Subsequent Pulses
You’ve run your first pulse project, and now you’re ready for the next pulse. This section walks through the steps needed to run additional pulses for your program. You will need to follow the below steps for each additional pulse you’d like to run.
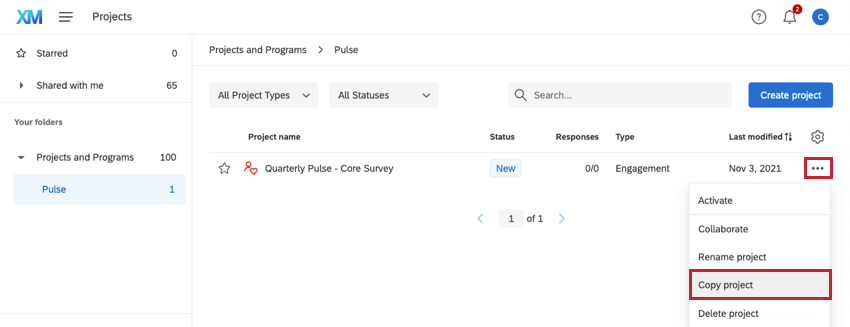
Step 1: Copy the Original Pulse
The first step is to copy the original pulse project. This will copy the survey and dashboards, but does not copy any other aspects of the project, such as participants, org hierarchy, or data.
After copying the project, make any adjustments you need to the survey. Usually, this is only superficial text edits, such as editing dates or leadership names. If you want to add or remove questions to your pulse survey, please follow the below guidelines:
- If adding a new question or answer choice, keep in mind that you won’t have historical data for the newly added question. Therefore, you won’t be able to report on trends until the next pulse.
- If removing a question or answer choice, do not delete it! Instead, hide it with impossible display logic.
Attention: You’ll generally want to keep your survey questions the same (i.e. avoid adding and deleting questions and answer choices when possible), as that will allow you to visualize trends over time more easily. This also has the added benefit of providing a consistent survey experience for your employees.
Step 2: Importing Participants, Generating Your Hierarchy, and Mapping Hierarchies
Next is to set up your participants and hierarchy for your next pulse. This is made easy by exporting your previous participant list and hierarchy, and importing them into your next pulse.
- In the original pulse project, navigate to the Participants section of the Participants tab.
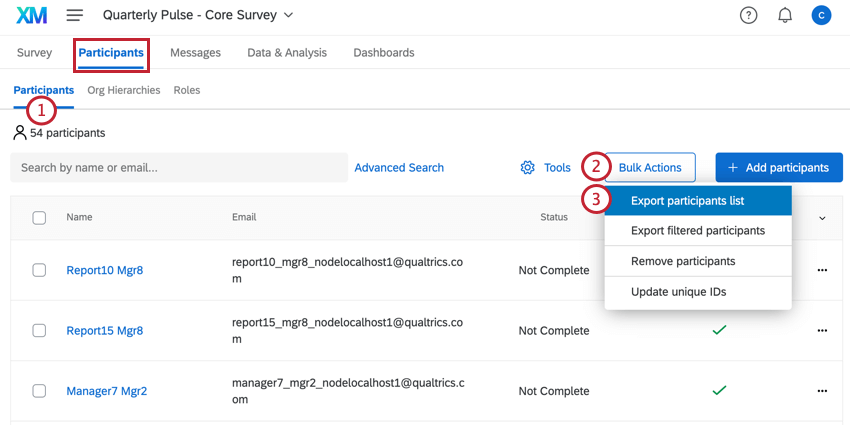
- Click Bulk Actions.
- Select Export participants list.
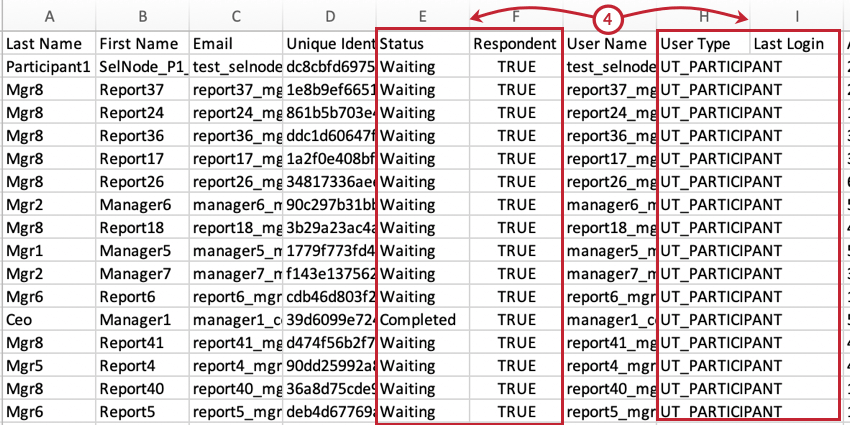
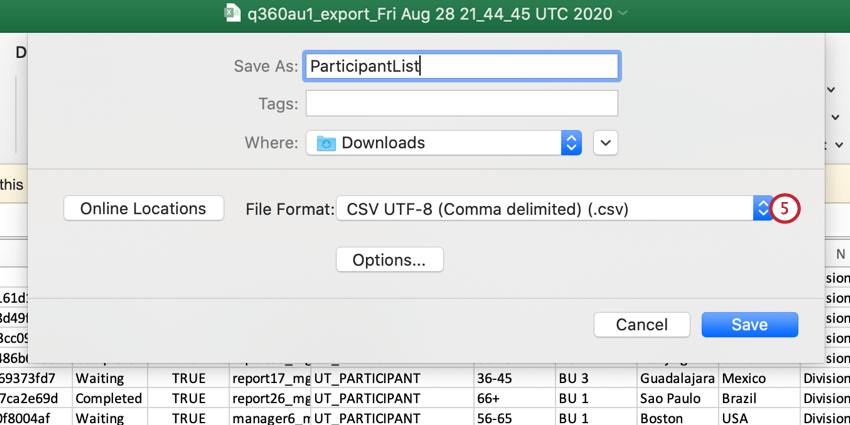
- Open your CSV file in a spreadsheet editor and delete the Status, Respondent, User Type, and Last Login columns from the file.
- Save your file as a CSV or TSV with UTF-8 encoding.
- Navigate to the Participants section of the Participants tab in the new pulse project.
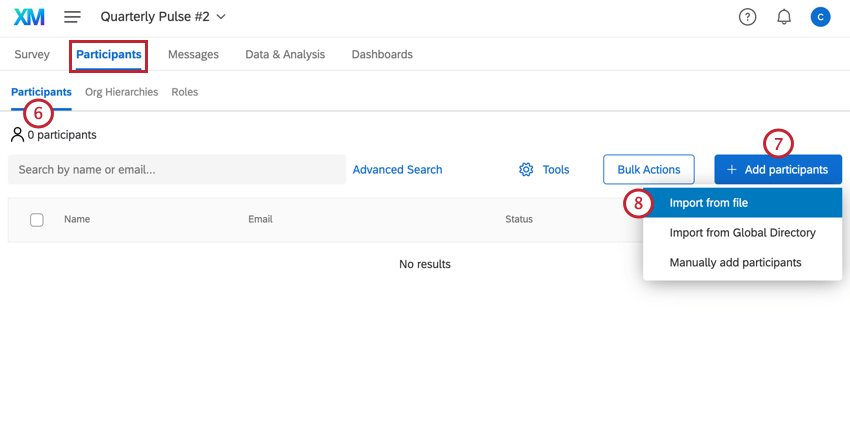
- Click Add Participants.
- Select Import from file and import your participant file.
- After your participants have finished importing, go to the Org Hierarchies section.
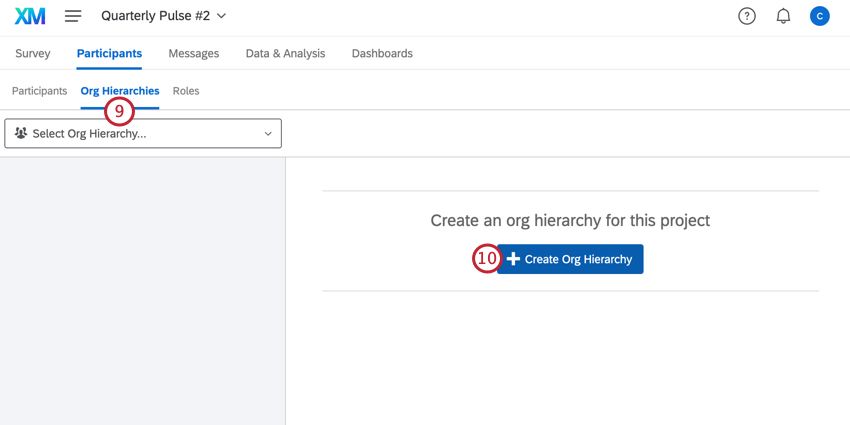
- Click Create Org Hierarchy to generate your hierarchy. Use the same settings as when generating your original hierarchy.
- Click Hierarchy Tools.
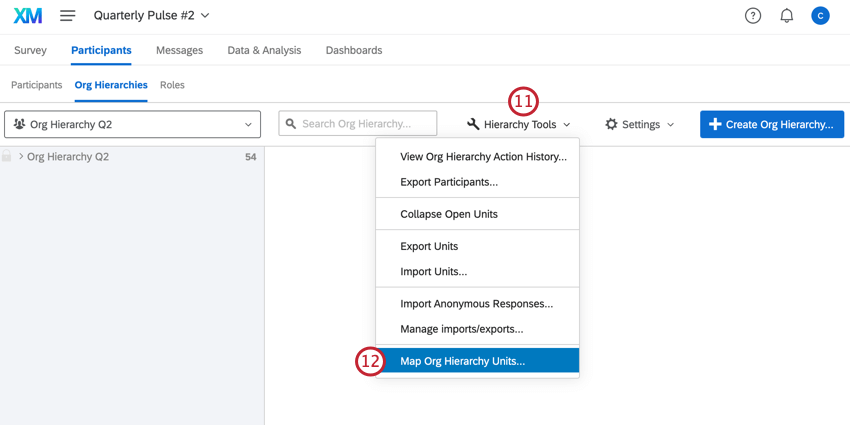
- Select Map Org Hierarchy Units.
Qtip: You will need to map units for all historical projects you want to display in your dashboard. As you run more pulses, you will need to make sure that every pulse is mapped correctly. For example, if you have a quarterly pulse and would like to view data across three previous pulses, you will map the current hierarchy to the hierarchy of each of the three previous pulses. In total, you will have three separate hierarchy mappings.
- Choose your historical project.
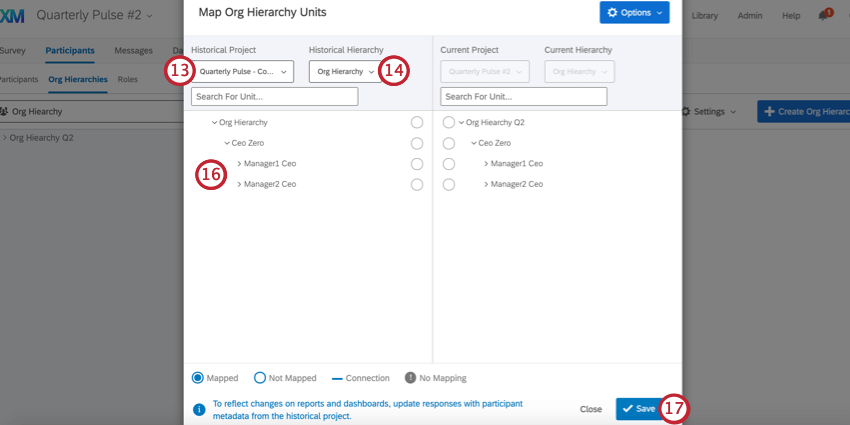
- Choose the hierarchy.
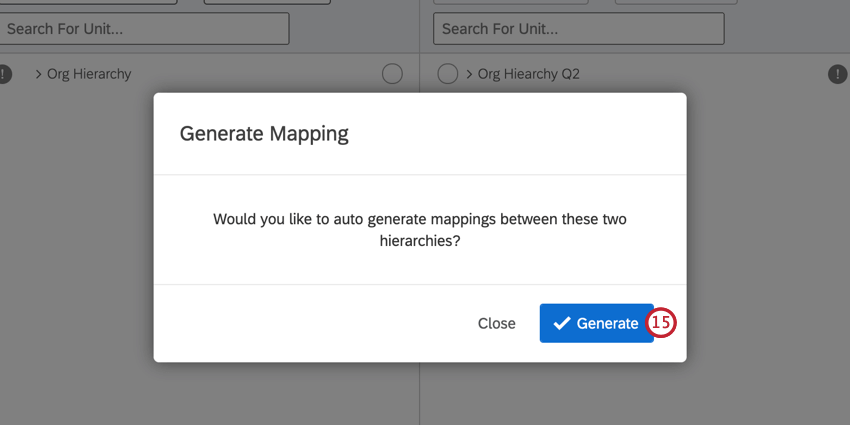
- A popup will appear to automatically map your units. If your hierarchies haven’t changed much, click Generate and most of the mapping will be done for you.
- If needed, make any adjustments to the mapping. See How to Map to Historical Units for more information.
- Click Save.
Step 3: Distributing the New Pulse
All pulses are distributed in the same way. To distribute your pulse, head over to the Messages tab and configure your Participant Invite. See the Email Messages support page for more information.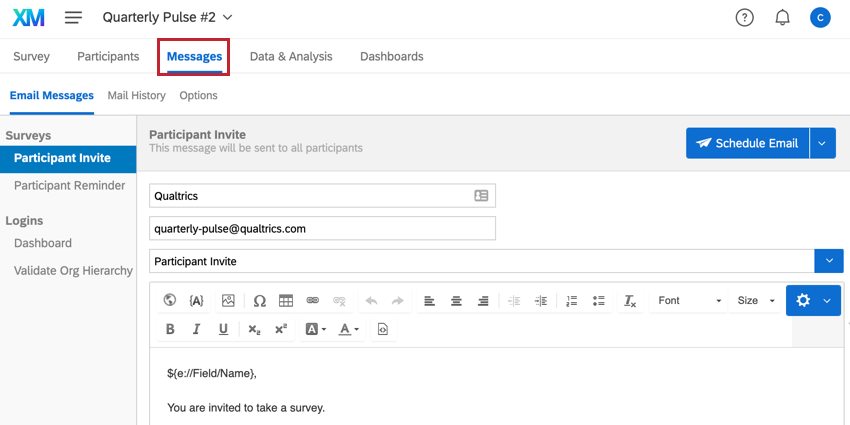
Step 4: Mapping Historical Data
After completing your next pulse, you will now need to visualize your data across pulses in one dashboard. To do this, we’ll map the historical data into the most recent pulse’s dashboard.
- In the most recent pulse project, go to the Dashboards tab.
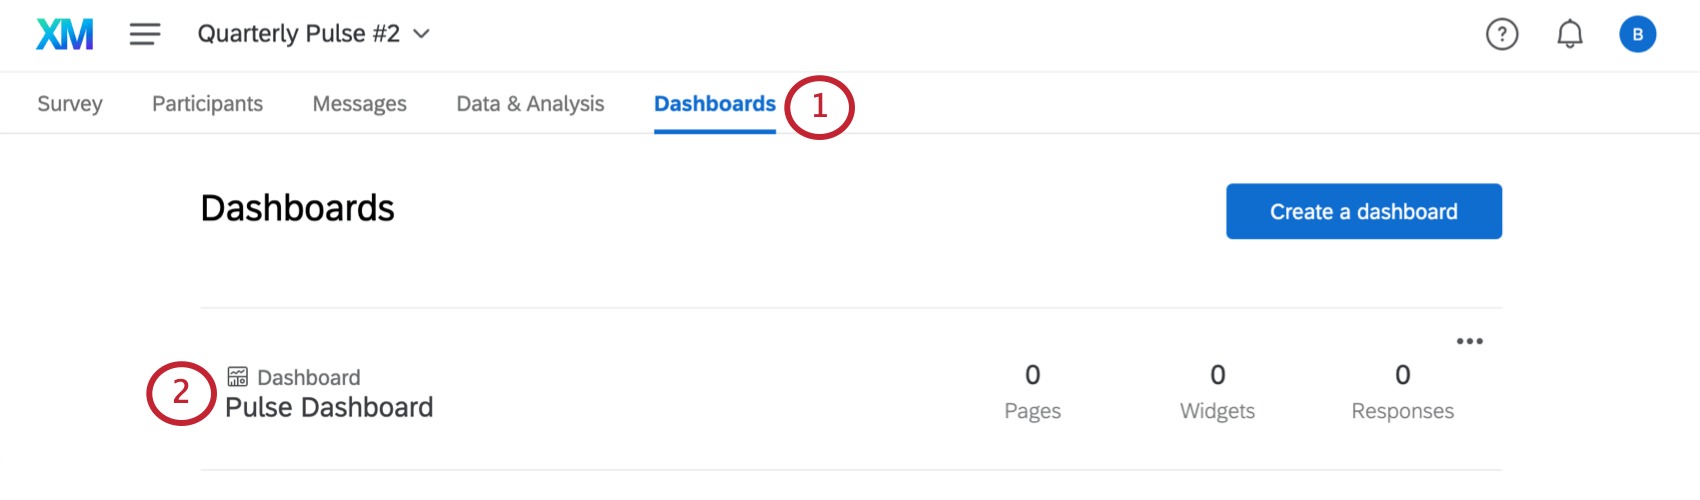
- Select your dashboard.
Qtip: If you built a dashboard in the project that you copied to make the pulse, then the dashboard will copy too. This will save you time on having to reconstruct your dashboard widgets every time you run a new pulse. However, please note that any recode values you set up in the original dashboard will not carry over to the copy and will need to be reconfigured.Qtip: If using the copied dashboard, make sure to open the dashboard and double check that everything is still set up the way you want it before continuing.
- Click Settings.
- Go to Dashboard Data.
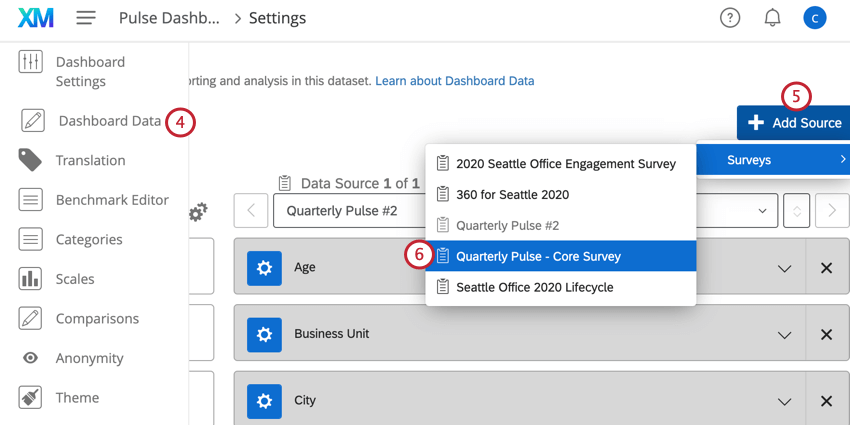
- Click Add Source.
- Hover over Surveys and select your pulse project.
Qtip: Repeat steps 5 and 6 for all pulses you want to display in the dashboard.
- If needed, adjust your field mapping. If you only made superficial text edits to your project, then you don’t need to adjust your mapping. You will only need to manually adjust your mapping if you’ve added or removed questions, Embedded Data, or metadata.
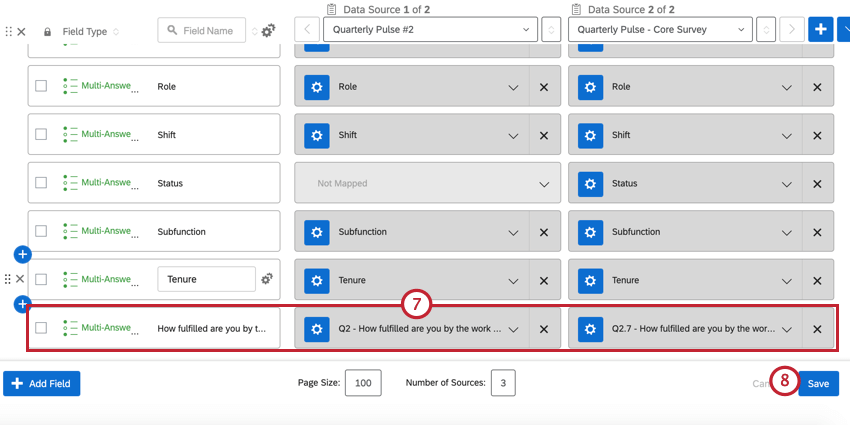
- Click Save.
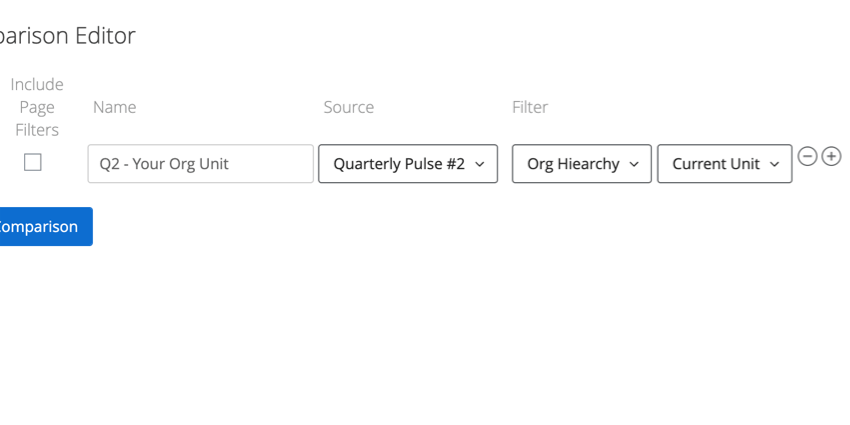
Step 5: Making Comparisons
After mapping your pulses, you will want to create comparisons to show how data changes over time. Usually, you’ll create at least one comparison for every historical pulse you want to display in your dashboard.
- Navigate to the Comparisons tab.
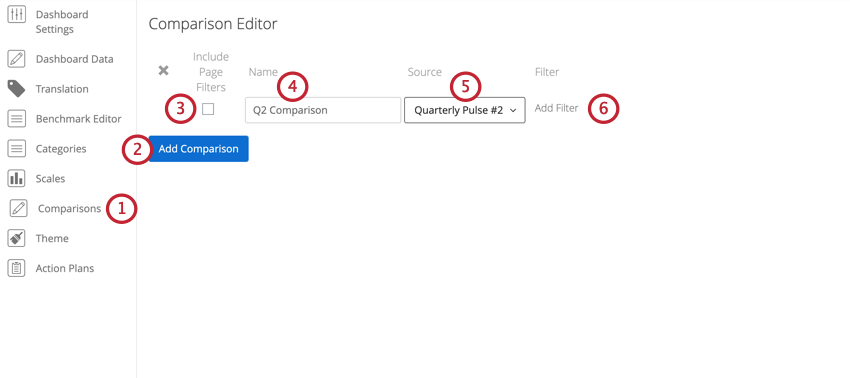
- Click Add Comparison.
- Enable Include Page Filters if you want the filters on the dashboard pages to apply to the comparison. If you want this comparison to stay static, keep this option unchecked.
- Give your comparison a name.
- Choose the project that will be the Source for the comparison.
- If desired, click Add Filter to filter the comparison by metadata or hierarchy
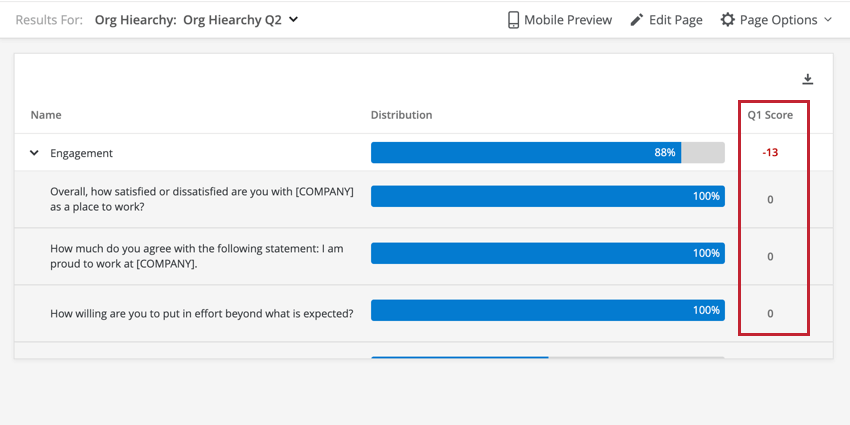
The following widgets can display comparison data:
- Heat Map Widget
- Demographic Breakout Widget
- Question List Widget
- Scorecard Widget
- Bubble Chart Widget
- Engagement Summary Widget
- Focus Areas Widget
Step 6: Distributing the Dashboard
You’ll distribute your dashboard the same way you did your previous pulses. To do this, you will give your participants permission to access the dashboard, and then send them a dashboard login email. We recommend using roles to make giving dashboard access to many participants easy.
See the support page on Configuring Dashboard Access for more information on giving access to your dashboard.
Step 7: Repeat the “Creating Subsequent Pulses” Workflow For Each Pulse
Congratulations on completing another pulse in your program! For each additional pulse you want to run, complete the steps in the Creating Subsequent Pulses section. You will need to complete these steps every time you create a new pulse project.