-

Qualtrics Platform -

Customer Journey Optimizer -

XM Discover -

Qualtrics Social Connect
Dashboard Data (EX)
About Dashboard Data
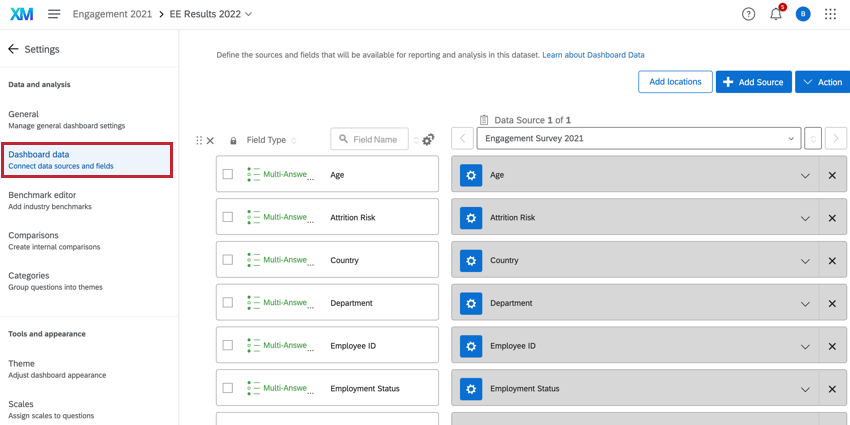
The dashboard data tab consists of all the fields (questions and metadata) available in your dashboard. It tells the dashboard what format these fields should be in so that they are compatible with the correct widgets. This is also where you can add additional sources to include in your dashboard.
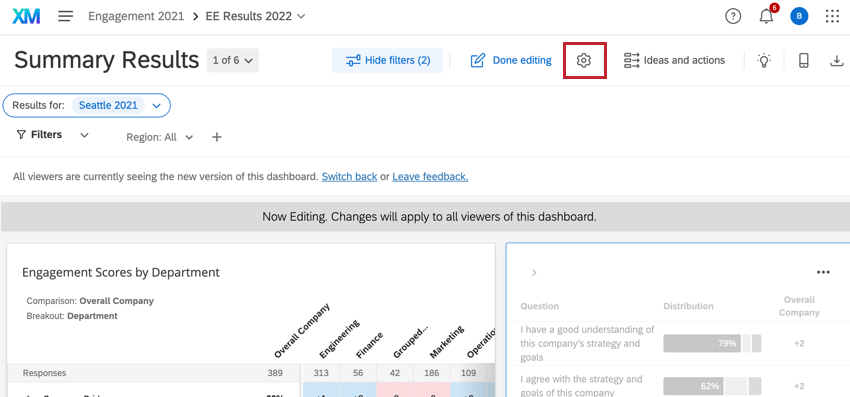
You can access dashboard data by opening your dashboard, going to the Settings, and selecting Dashboard data.
Mapping Fields
Whenever you create a new dashboard, many of your fields will be automatically mapped for you. However, when you add variables or metadata to your project after the dashboard has been generated, these fields are not automatically added to the dashboard data, so you will need to map these fields manually.
- In your dashboard’s Settings tab, go to the Dashboard Data.
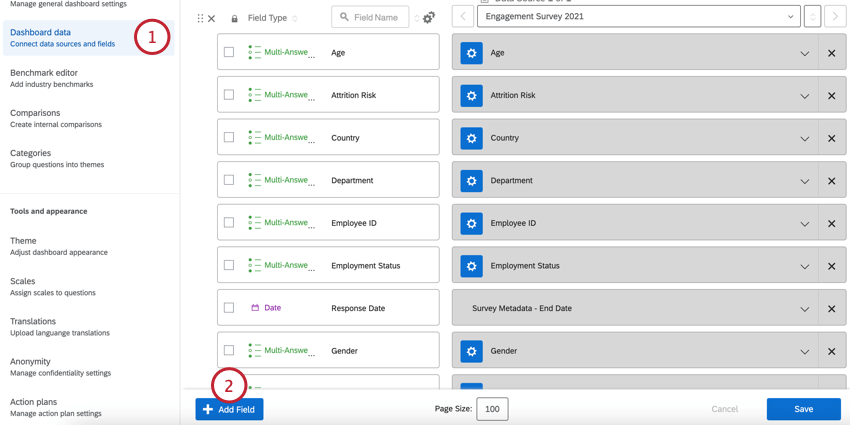
- Click Add Field.
Qtip: Updating the field’s name will not affect your survey and will only be visible within the dashboard.
- Type a name for your field. This can match the question or metadata name exactly, or be something totally different.
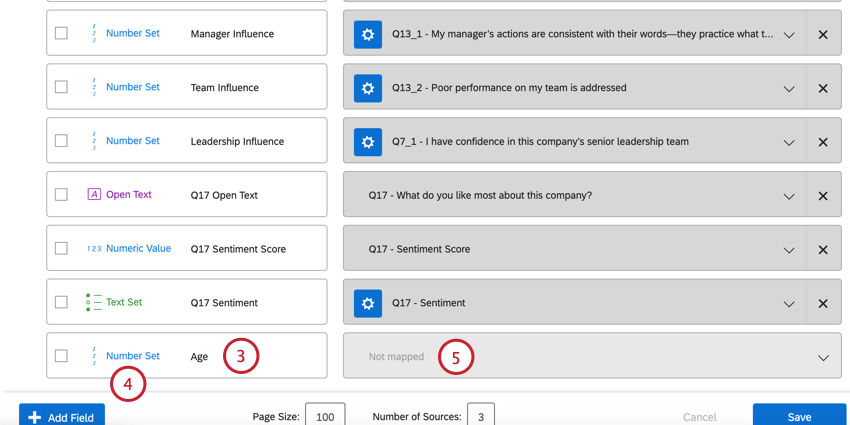
- Select a field type. This will determine what kind of widgets are compatible with the data, so read the linked support page carefully!
- Click Not mapped and select the field you want to map from the dropdown.
Qtip: If you’re not seeing the field you wish to map, try clicking Show All.
- If you don’t like the field you mapped and want to start over, click the X to the right of the field to unmap the field.
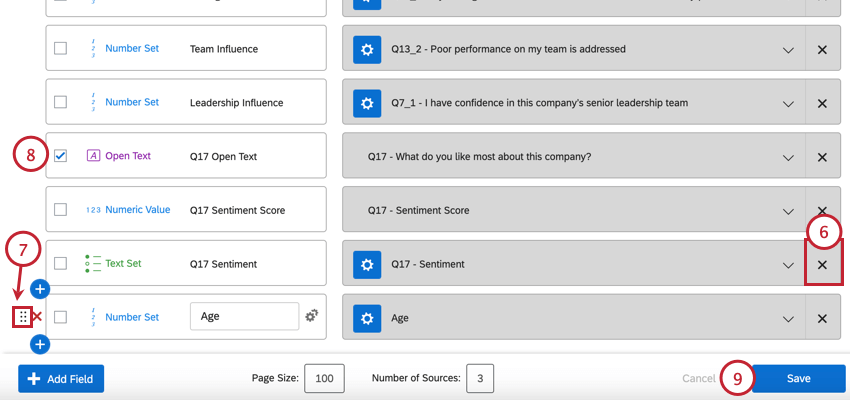
- To reorder a field, hover over the field, click the reorder icon, and drag the field to the desired spot.
- To mark a field as sensitive, check the box.
Qtip: Fields marked as sensitive will be hidden to dashboard viewers, unless the participant has special permission to view sensitive fields. See our Permissions section for more details on how to enable or disable these permissions.
- Once you are satisfied with your changes, click Save.
Deleting Fields
- In your dashboard’s Settings tab, go to Dashboard data.
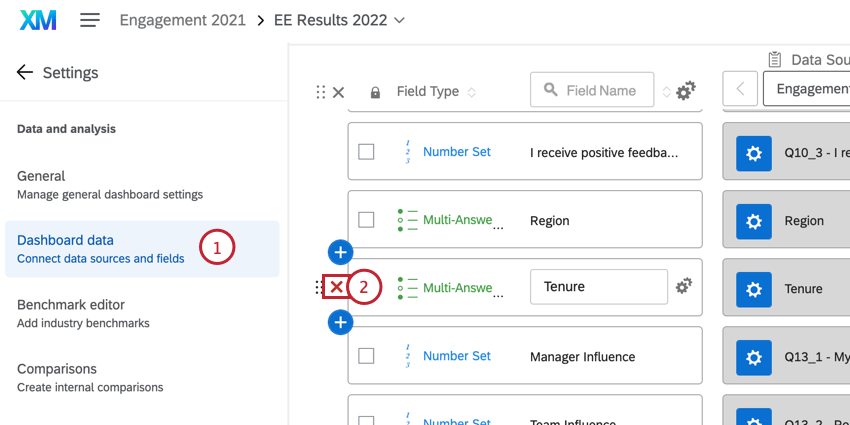
- Hover over the field you want to delete, then click the X.
- Confirm that you want to delete the field by selecting Delete Field.
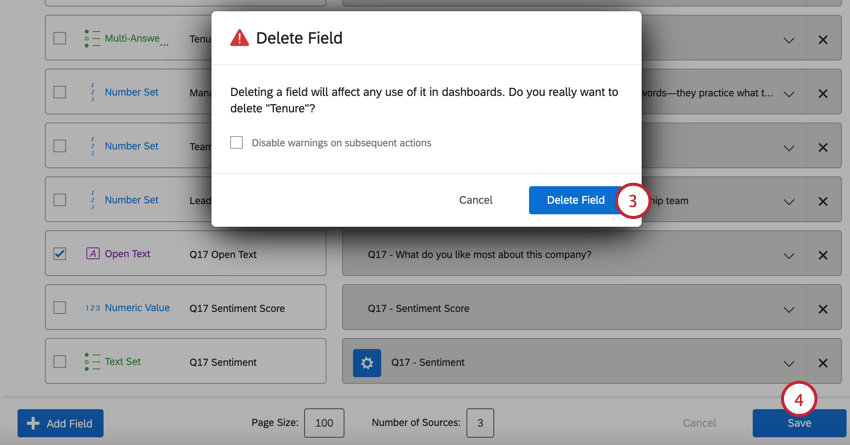 Qtip: If you’re deleting a lot of fields and don’t want to be warned every time, select Disable warnings on subsequent actions. This warning will come back if you leave the dashboard data and return.
 - Click Save before leaving your dashboard data.
Recoding Fields
If your data isn’t populating in the widgets the way you want it to, you can recode values in the dashboard. Recoding allows you to group data or change how it appears in widgets – for example, by conveniently shortening how choices are labeled, and changing text to numbers. Only Text Set, Multi-Answer Text Set, and Number Set field types can be recoded.
Recoding Fields
- In your dashboard’s Settings tab, go to Dashboard Data.
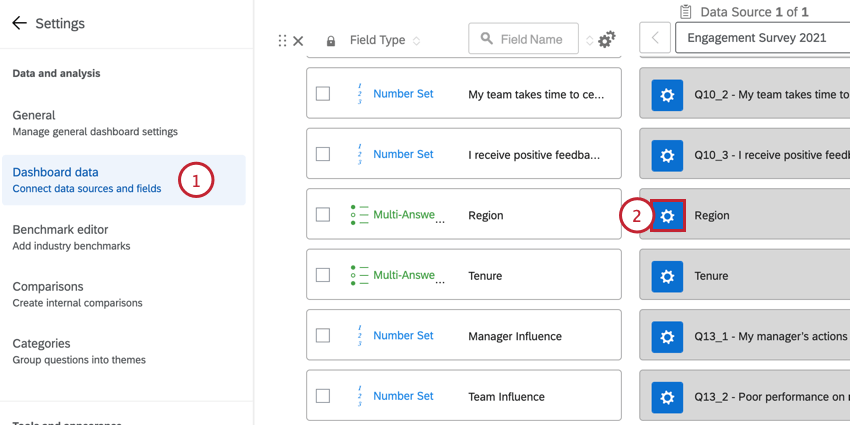
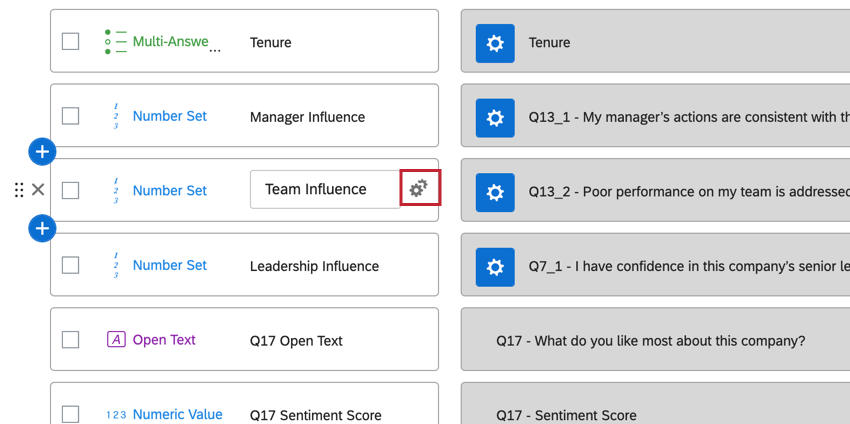
- Click on the field settings icons next to the field whose recode values you want to change.
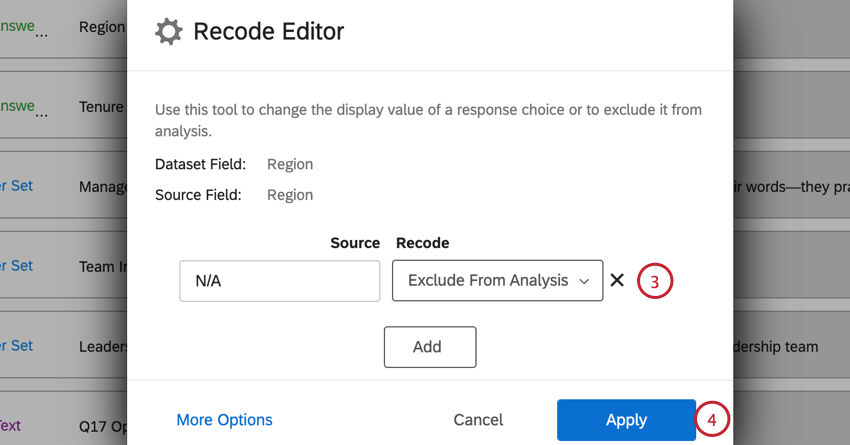
- Change the recode values for any of the labels. This may be an open field, or a dropdown menu.
 Qtip: Note that the recode values are limited to the field type that you have designated. For example, if you want to recode a 7 point agreement scale into 2 agreement “groups” (e.g. Agree or Disagree), the field type must be Text Set or Multi-Answer Text Set instead of a Number Set, because the recoded values will be text instead of numbers.Attention: Fields mapped as a Number Set may only be recoded in whole integers, i.e. 1, 2, 3, etc.
 - Click Apply.
- Click Save before leaving the dashboard data.
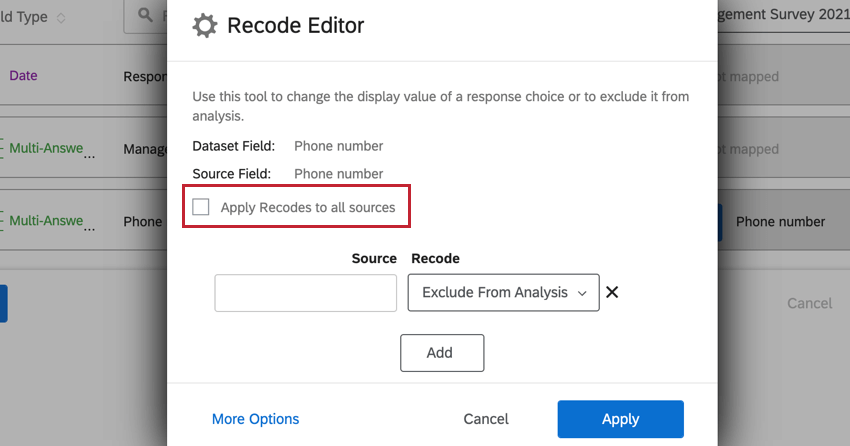
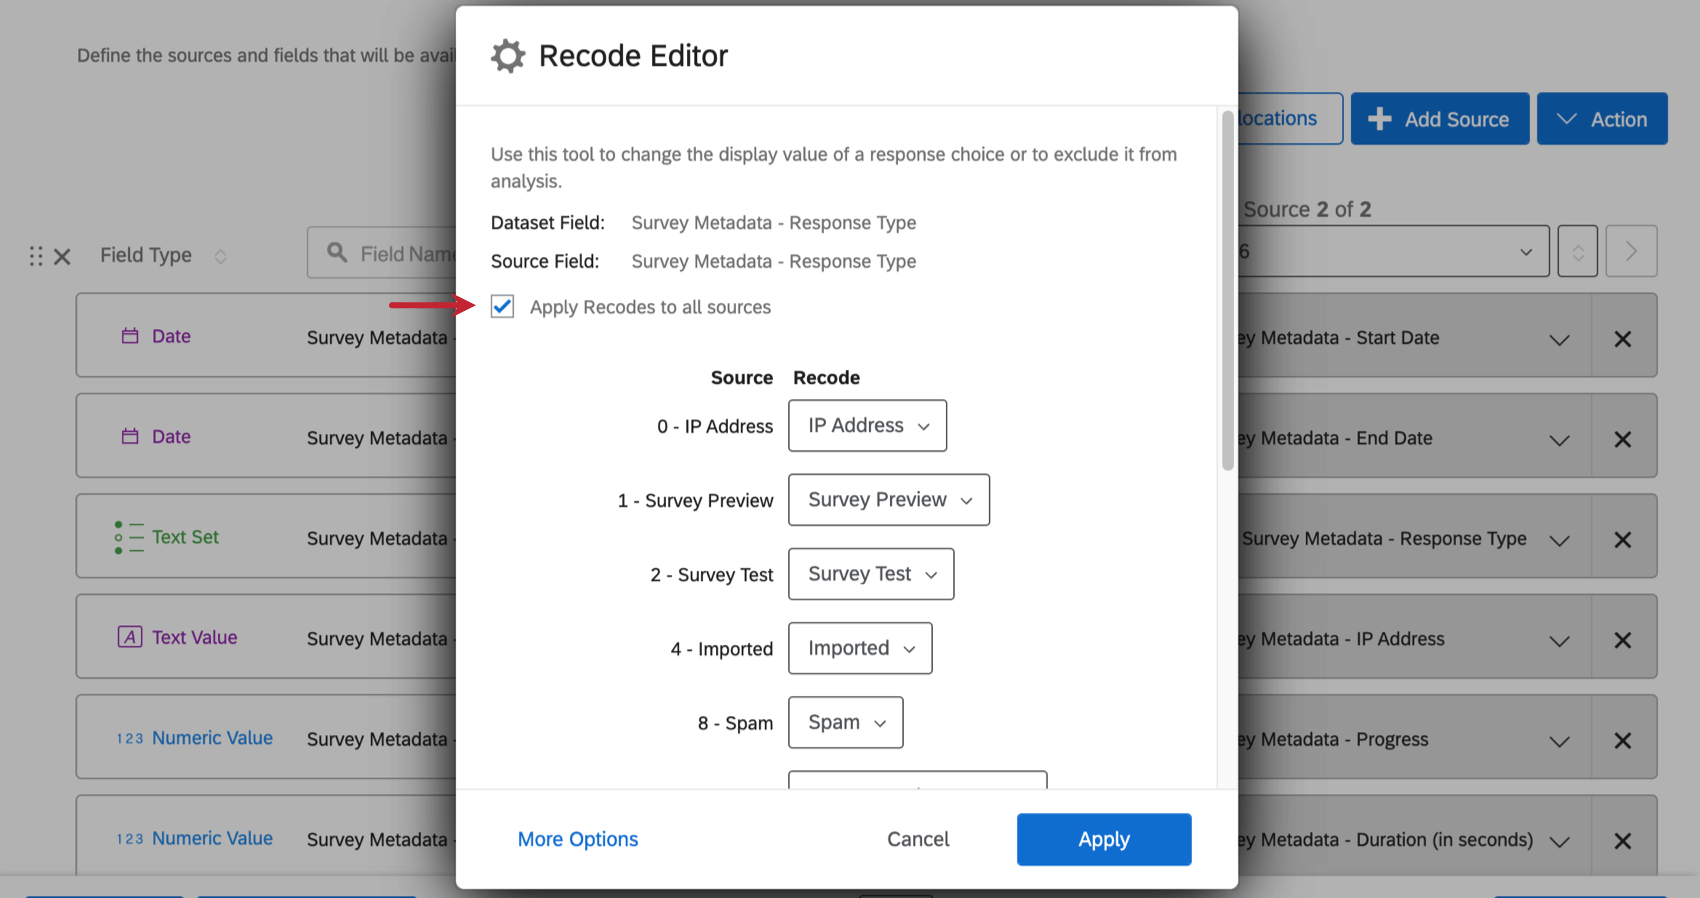
Qtip: If you have multiple sources mapped in your dashboard, and would like the change you’re making to be applied to the field across all dashboard sources, you can select Apply Recodes to all sources before you save. For example, you’d like to exclude the Department “Sales” from analysis. Apply Recodes to all sources ensures that for the “Department” field in the 2017, 2018, and 2019 projects mapped in the dashboard, Sales is excluded from analysis.
“Apply Recodes to all sources” only works for changes made in that session. If you saved, forgot to apply all, and then went back and applied all, your previous change won’t be pushed to the other dashboard sources. Only new changes you make will be applied.
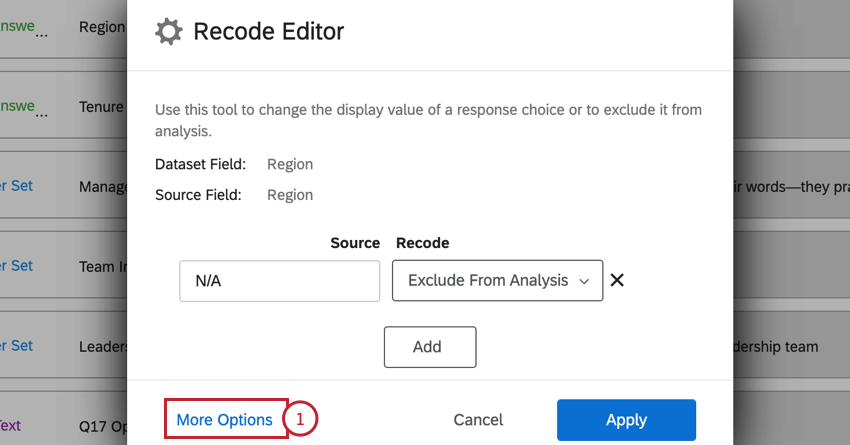
Changing Labels
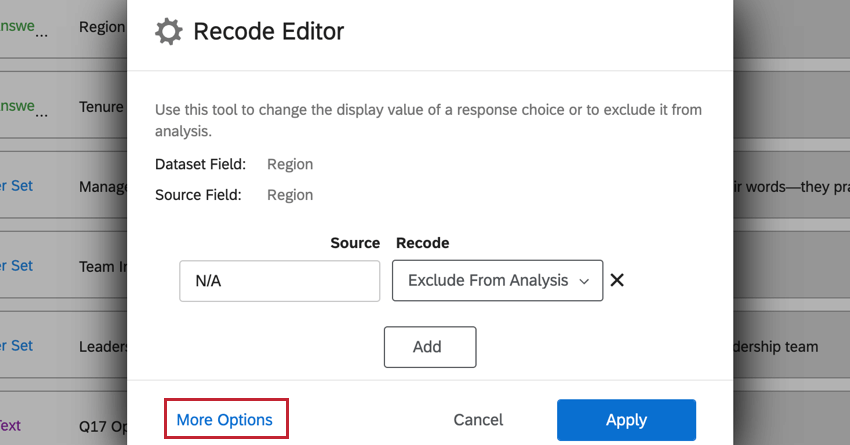
You can change the way values are labeled for Text Set and Multi-Answer Text Set fields. Click More Options in the lower-left of the recode editor.
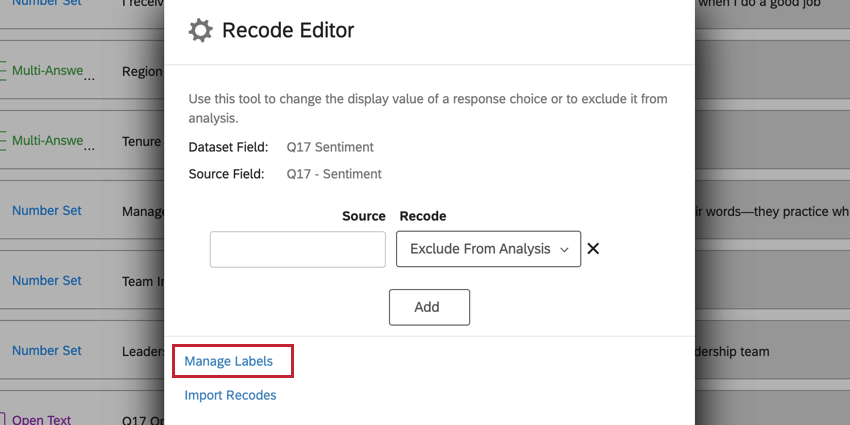
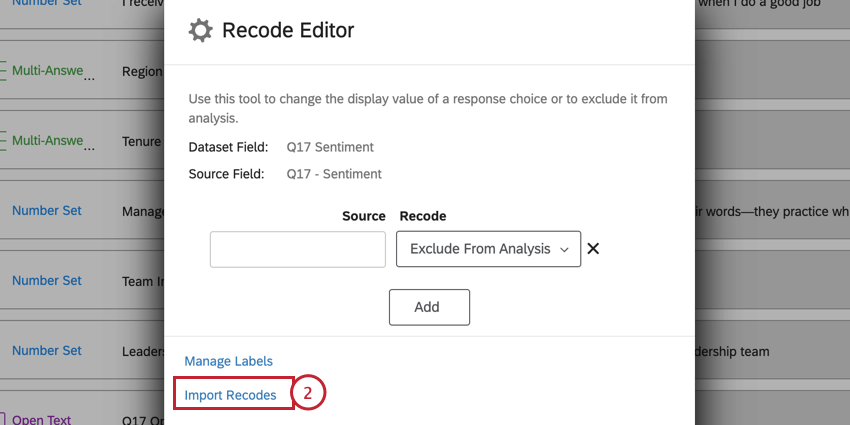
Then, click Manage Labels.
Once opened, you have the freedom to change spelling, capitalization, and/or wording of how these values will appear when loaded into your dashboard’s widgets.
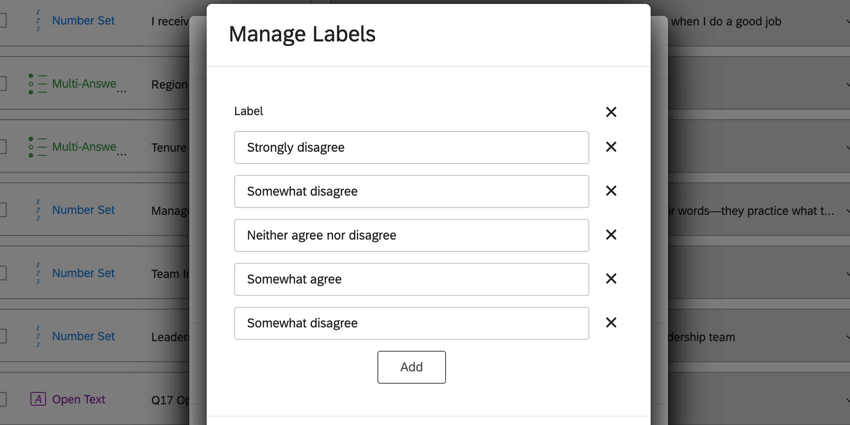
You can add additional labels by clicking Add, or remove labels by clicking X.
Importing Recode Values
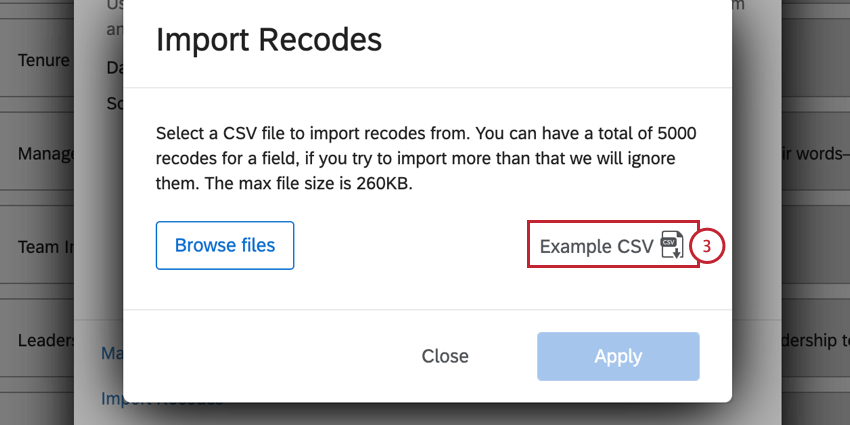
If your field has many values you need to edit, you can choose to import an Excel spreadsheet saved as a CSV with your recode values, instead of typing each one manually.
- In the recode window, click More Options.
- Click Import Recodes.
- Download the Example CSV. This file contains the current recode values for your field.
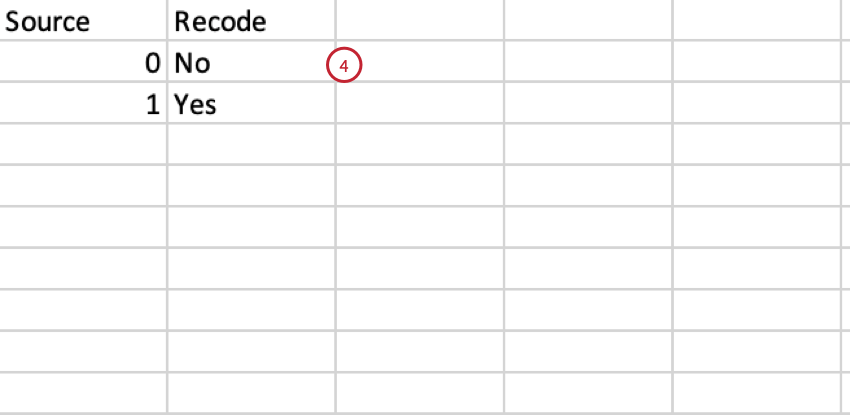
- In your CSV, the Source column will list all the possible values of your field. In the Recode column, enter the recode you want for each value.
- Click Browse files to upload your CSV.
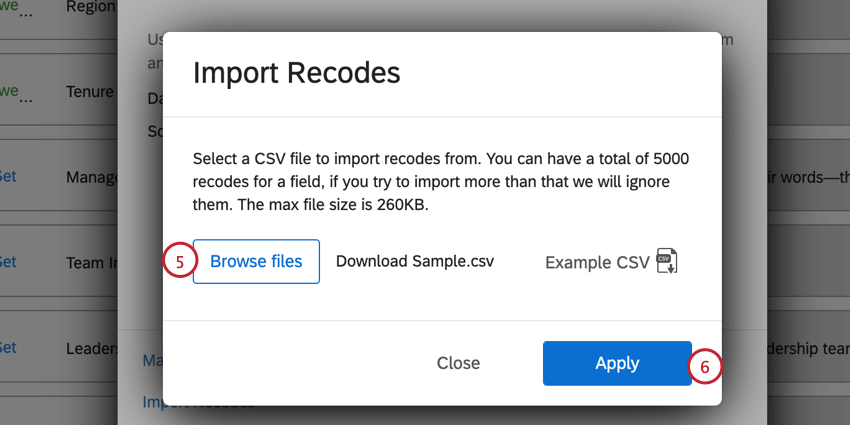
- Click Apply.
Cleaning Up Data
Another use case for recoding values is for cleaning up and consolidating inconsistent data. For example, if some of your values for a single metadata field are “US,” some are “USA,” and some are “United States,” Qualtrics will interpret these as 3 different values. You can correct or group these inconsistent values by recoding them all to one value, like “US.”
Alternatively, if your metadata field had values of “US,” “UK,” and “SK,”, you may want to recode them to be “United States,” “United Kingdom,” and “South Korea” to make them more understandable when they display on the widgets.
This is also very useful when mapping multiple years’ projects together if your metadata values change from one year to the next.
Apply Recodes to All Sources
When you’re editing the recode values of an type of field and you have added multiple sources to your dashboard, you can easily apply the changes you’re making to the same field across all of your sources. Select Apply recodes to all sources before you save your changes.
Recode Editor Error Messages & Troubleshooting
You may encounter a few different error messages when recoding your fields. These errors are built to preserve your data’s integrity and prevent incorrect analysis of engagement results. Below is a list of common error messages, their causes, and how to fix them.
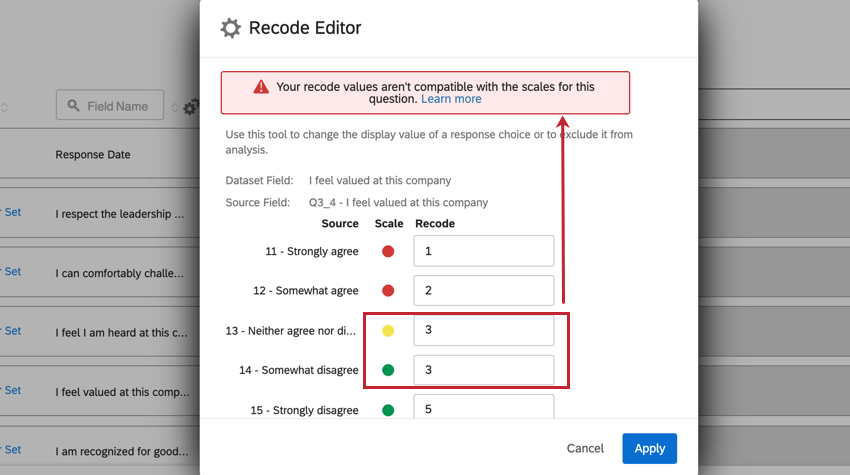
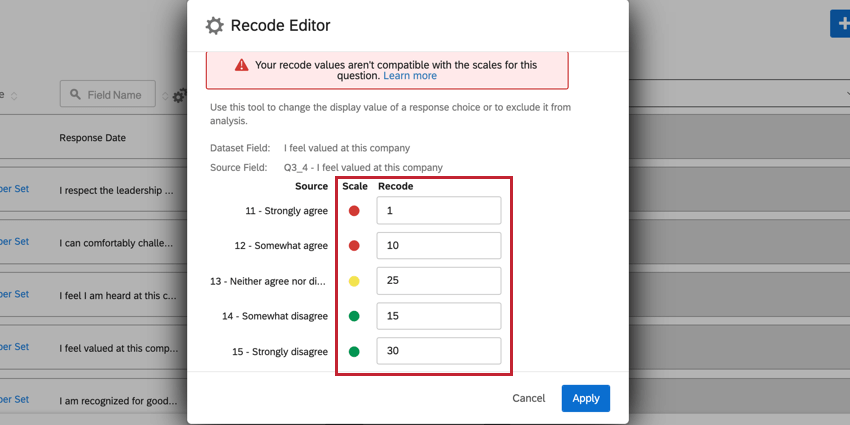
- Your recode values aren’t compatible with the scales for this question. This error appears when you are attempting to assign the same recode value to multiple scale points and the scale points are in different favorability categories. To fix this, you’ll either need to assign your scale points different recode values, or change your scale so that the scale points are in the same favorability category.
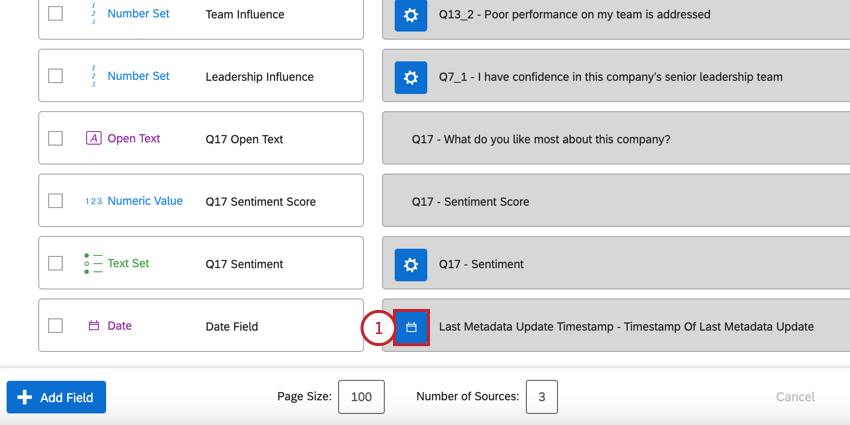
Changing a Field’s Date Format
- Click on the recode symbol.
- Define which Format and Timezone apply to your data.
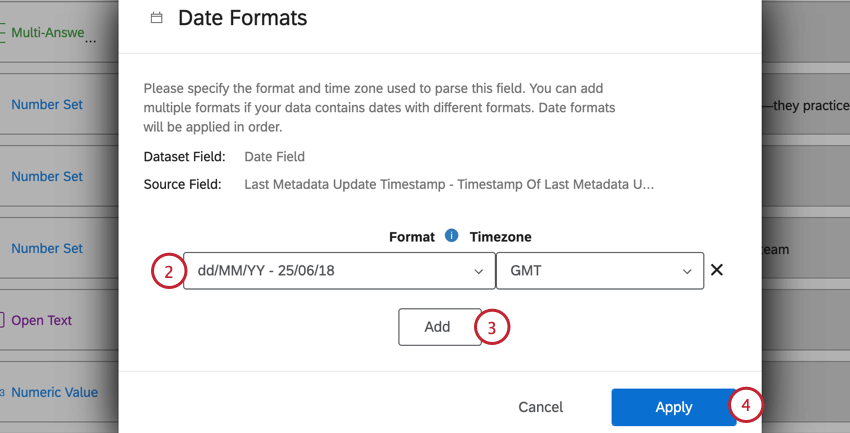
- Click Add to add additional formats and time zones.
- Click Apply.
Adding a Custom Date Format
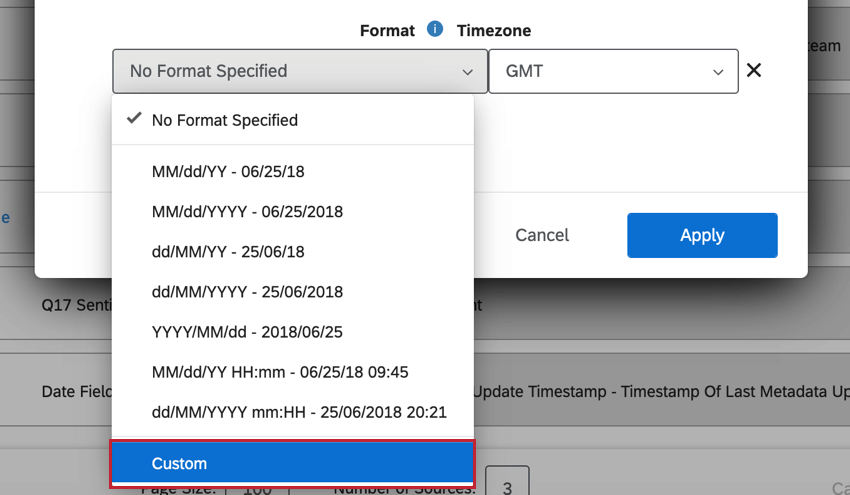
If you select Custom, you can define your own special date format.
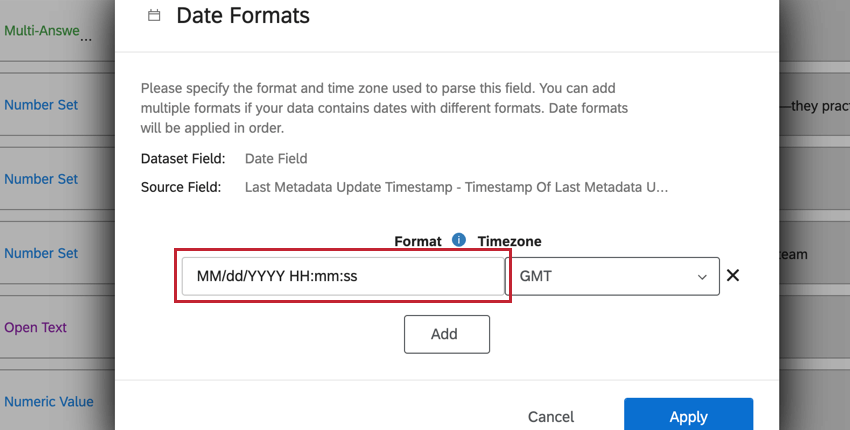
To specify a custom format, please use the following symbolic syntax:
| Symbol | Meaning | Presentation | Examples |
| G | era | text | AD |
| C | century of era (>=0) | number | 20 |
| Y | year of era (>=0) | year | 1996 |
| x | weekyear | year | 1996 |
| w | week of weekyear | number | 27 |
| e | day of week | number | 2 |
| E | day of week | text | Tuesday; Tue |
| y | year | year | 1996 |
| D | day of year | number | 189 |
| M | month of year | month | July; Jul; 07 |
| d | day of month | number | 10 |
| a | halfday of day | text | PM |
| K | hour of halfday (0~11) | number | 0 |
| h | clockhour of halfday (1~12) | number | 12 |
| H | hour of day (0~23) | number | 0 |
| k | clockhour of day (1~24) | number | 24 |
| m | minute of hour | number | 30 |
| s | second of minute | number | 55 |
| S | fraction of second | number | 978 |
| z | time zone | text | Pacific Standard Timee; PST |
| Z | time zone offset/id | zone | –0800; –08:00; America/Los Angeles |
| , | escape for text | delimiter | |
| ‘ ‘ | single quote | literal | ‘ |
For example, if you have date and time data in this format: Tue, 10–25–2015, 8:42pm should be presented in the Date Format field as E, MM–dd–yyyy, K:ma.
Time Zones
The time zone is generally set to the time zone of your Qualtrics account. However, it is best practice to verify the correct time zone for the field you are adding.
Adding Additional Sources
If you’ve run multiple Employee Experience projects of the same type (e.g., multiple engagement surveys), you can compare and contrast their results in the same dashboard. If the surveys contained the same questions or metadata, you can even map over which fields are the same for more dynamic comparisons.
How to Add Sources
- Navigate to Dashboard data in the Settings tab of your dashboard.
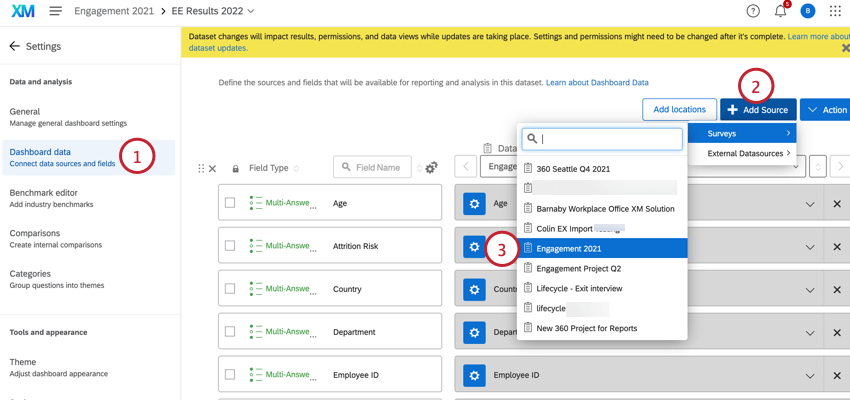
- Click Add Source.
- Choose the project you’d like to map.
Qtip: Automatic Mapping will save you time by searching for similar fields and matching them. Be sure to always verify that the mapping was done to your liking and there are no issues.
- For fields that haven’t been mapped, click Not mapped and select the field.
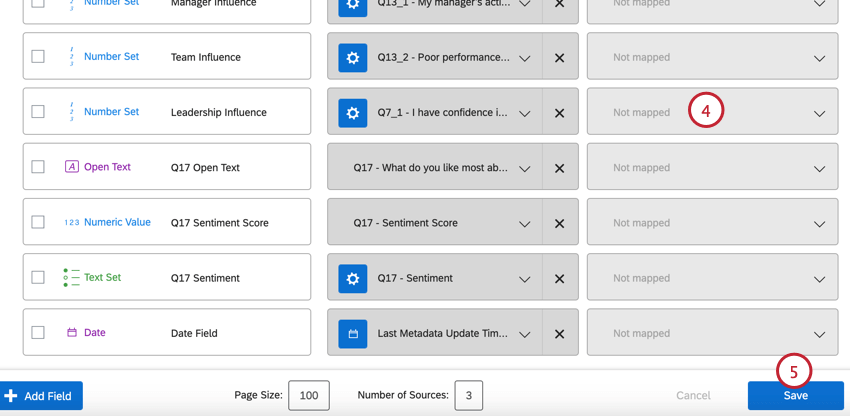
- When satisfied, click Save.
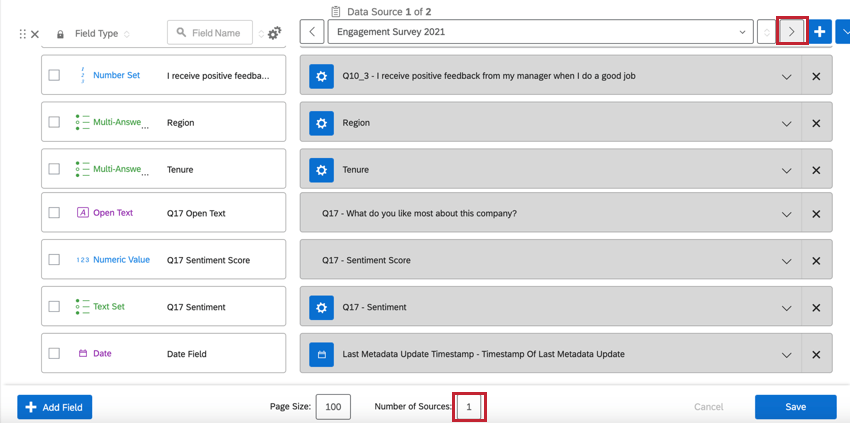
To merge data into the same field for use in comparisons, map both sources on the same row of the field you want to merge. Make sure that the fields you are merging are extremely similar – for example, be sure that the question type, field type, and number of scale points on the question are the same.
Interaction Between Sources
There are two ways that multiple sources can be treated in a widget, depending on the type of widget you’ve chosen.
For a majority of widgets, there’s one source specified in their options, meaning that they will only show data for one source at a time, unless a comparison has been added to that widget.
However, some widgets will combine the results of all the sources mapped in the Dashboard Data into the results they show. These widgets include:
- Gauge chart widget
- Simple chart widget
- Number chart widget
- Pie chart widget
- Simple table widget
For the widgets listed above, you will need to use a widget-level filter to ensure only one dataset source is displayed in the widget. You can even lock this filter, if you don’t want dashboard users to adjust it.
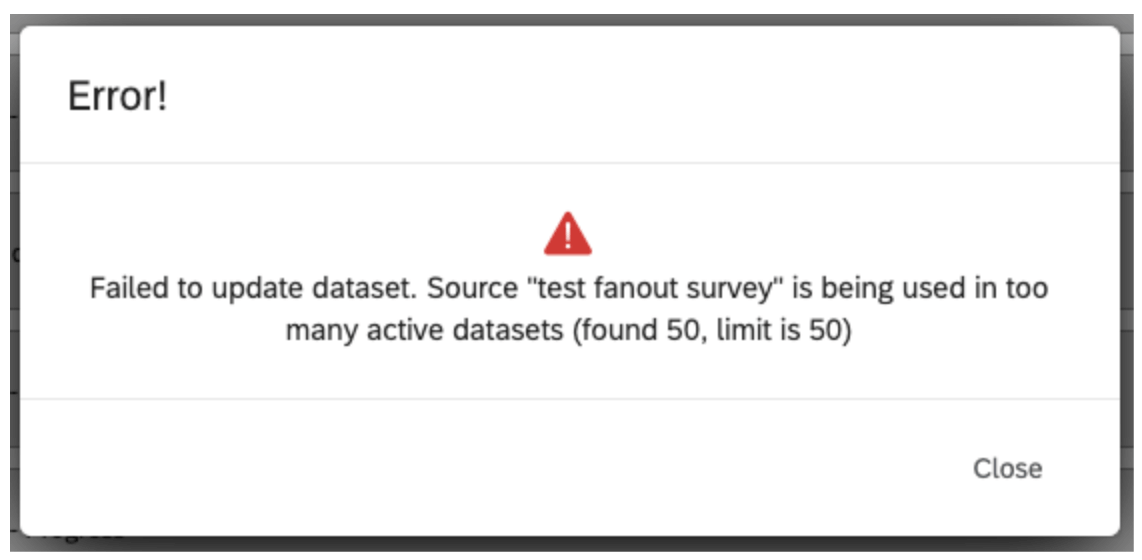
Dataset Utilization Limits
Our data platform imposes a limit on the number of times a single data source can be used in active datasets. Currently, a single data source can only be in 50 active datasets to guarantee timely data processing. For external data, the limit is 5 active datasets. These limits are subject to change over time as our platform and features grow. If your datasource reaches this utilization limit, an error dialog is displayed while adding the source in the data mapper or copying the dashboard.
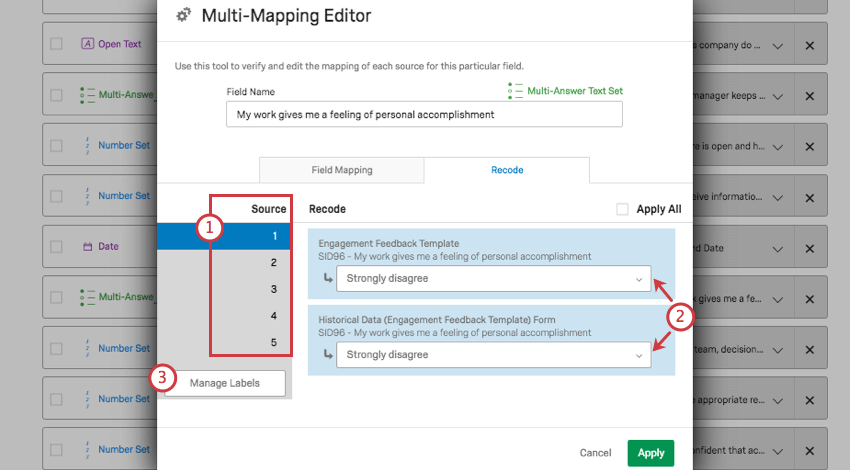
Multi-Mapping Editor
When you’ve added multiple sources to your dashboard, there is an additional recode editor that makes mapping the same fields across multiple sources much easier.
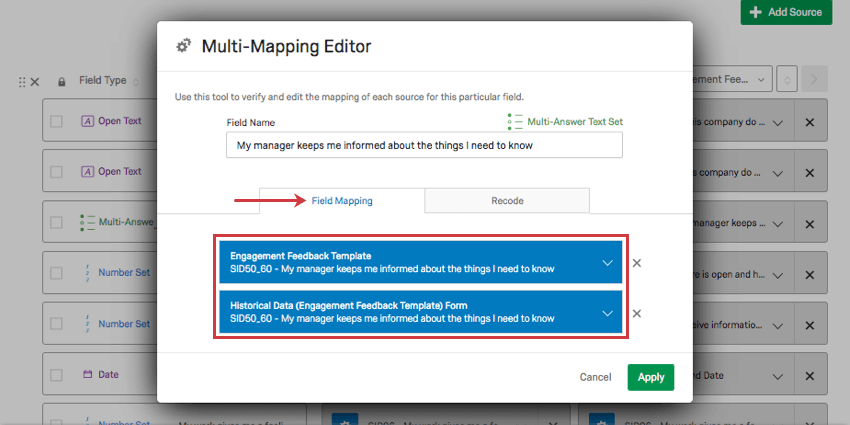
Field Mapping Tab
Using the blue dropdowns, you can choose the field from each source that should correspond to the same dashboard field.
Recode Tab
Here, you can ensure the recode values are the same for each field being mapped together.
- Choose the option you want to edit from the Source section. This is the field value or survey question choice.
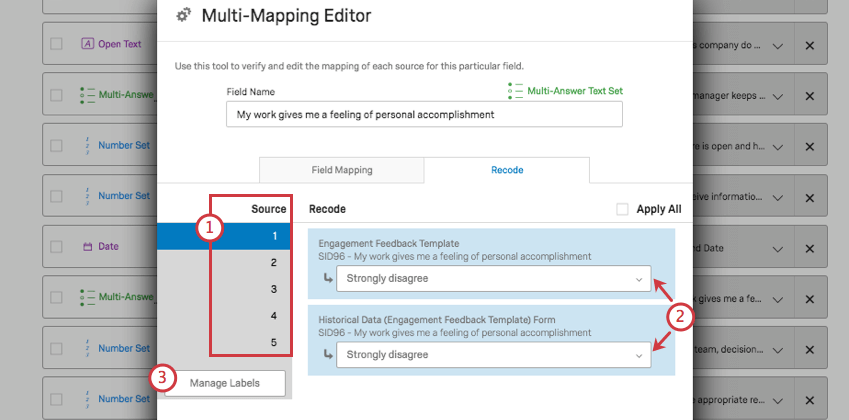
- For each source, either select the corresponding value, or choose to exclude from analysis.
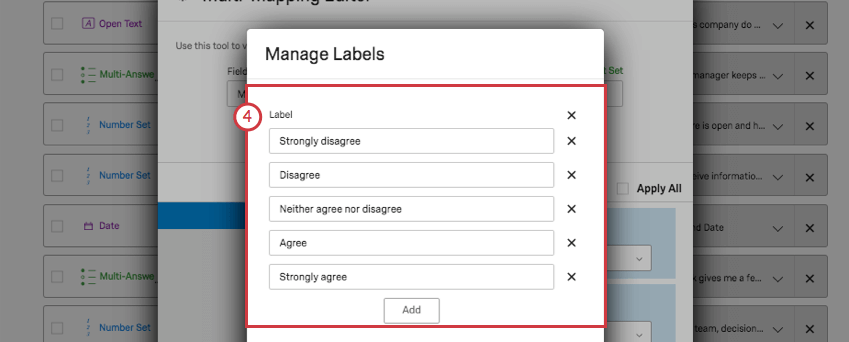
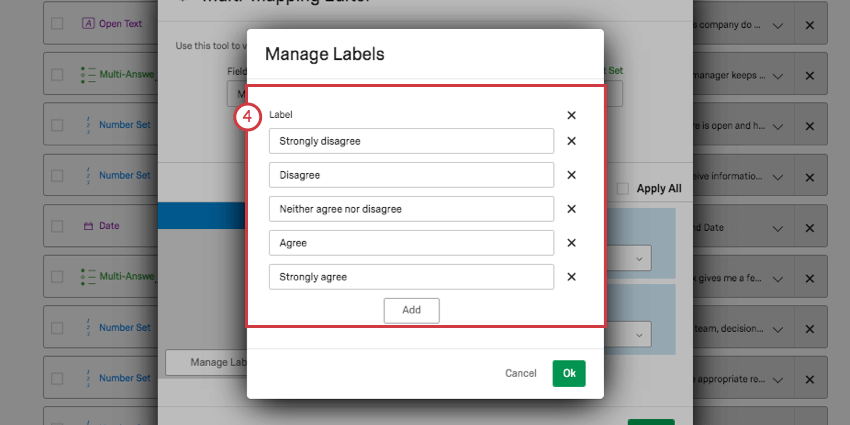
- Click Manage Labels.
- Change what the label should be for each available option, or add more labels that can be mapped across your sources.