-

Qualtrics Platform -

Customer Journey Optimizer -

XM Discover -

Qualtrics Social Connect
General Dashboard Settings (EX)
Qtip: This page describes functionality available to Engagement, Lifecycle, Pulse, Ad Hoc Employee Research, and 360 projects. For more details on each, see Types of Employee Experience Projects.
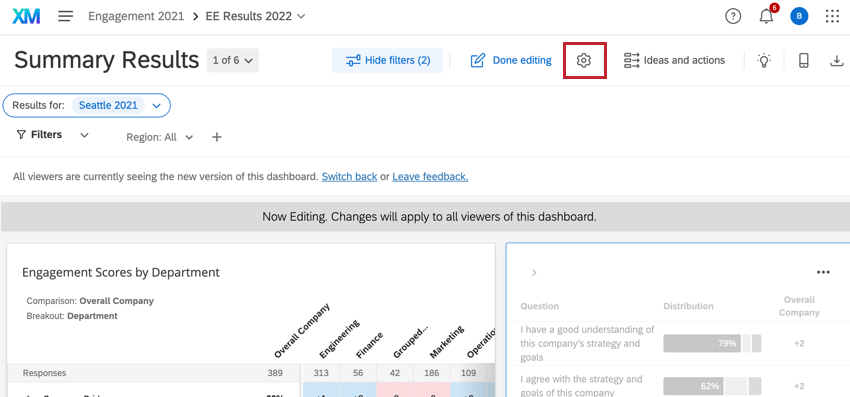
Accessing General Dashboard Settings
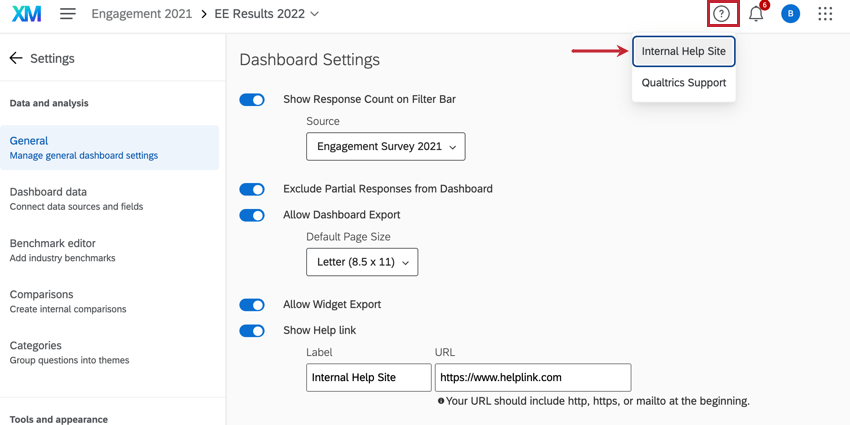
To access your dashboard settings, navigate to the Settings page and select the General section on the left.
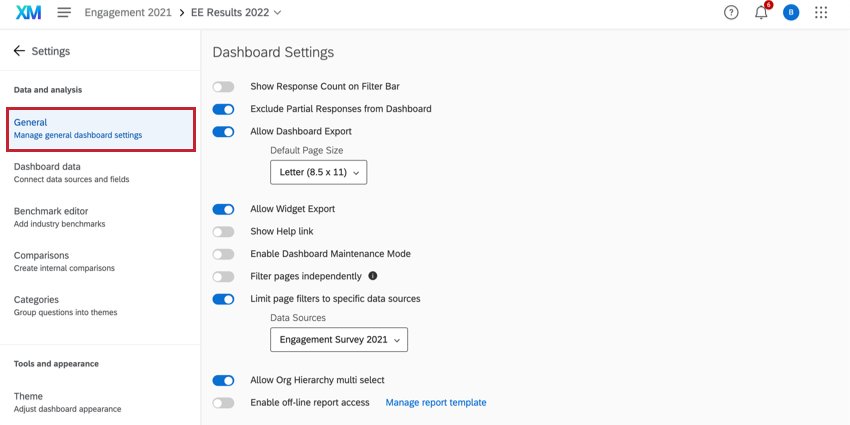
Available Dashboard Settings
A number of general settings are available to you. Click on the setting to turn it on and off. Once you change a setting, the changes are saved automatically.
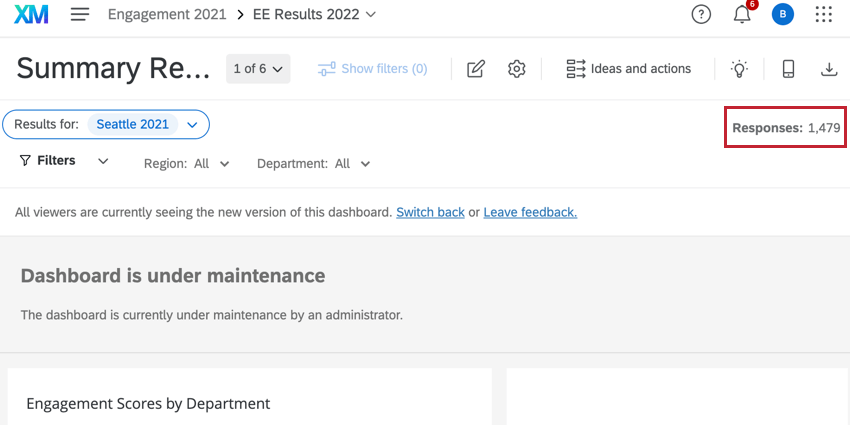
- Show Response Count on Filter Bar: Show how many responses the survey has on the top-right of the dashboard.
 Qtip: The “Show Response Count on Filter Bar” setting has a menu that, by default, selects the primary data source to be the dashboard’s only data source. If, instead, you would like to have responses pulled in from across all data sources, you will need to select “All” on the dropdown menu.
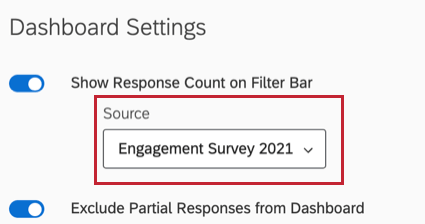 Qtip: This option is not available for 360 dashboards.
 - Exclude Partial Responses from Dashboard: When enabled, incomplete data will not be included in the dashboard. A response is incomplete when the participant’s response is not finished, but the assessment has been closed or the response has expired. This is not the same as a response in progress, which are always excluded. Visit the section on Incomplete Survey Response Options for further information.
- Allow Dashboard Export: When enabled, this option allows participants to export the dashboard. See Making Dashboards Available for Export for the different export options. When participants export your dashboard, it will only include data that they have permission to view.
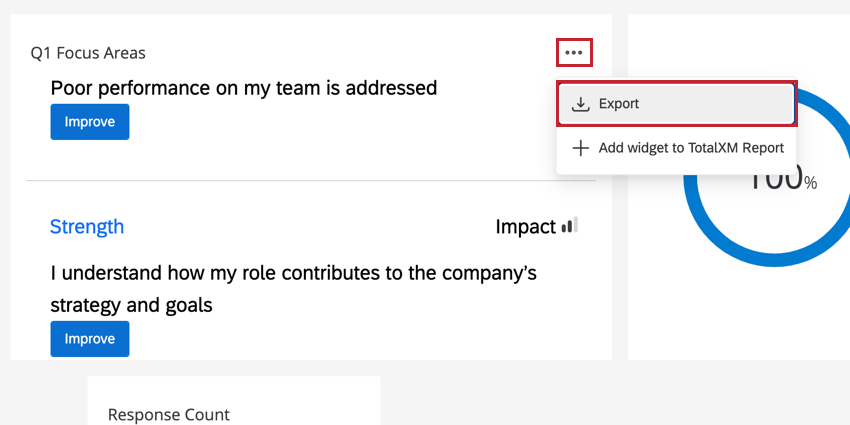
- Allow Widget Export: When enabled, this option allows dashboard users to export the data displayed in an individual widget. For more on file types and widgets supported, see Export Widget.
- Show Help Link: Create a Help link of your choosing to show up in the top-right corner of your dashboard as a tab. Enter the link text under Label and the website under URL.
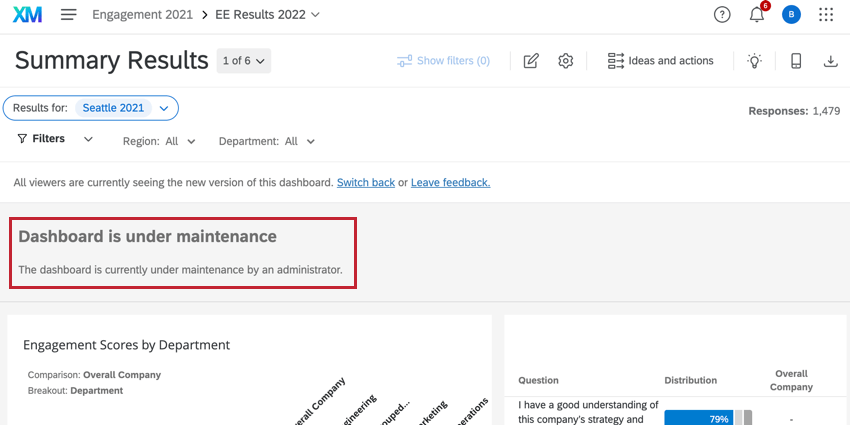
- Enable Dashboard Maintenance Mode: When enabled, you can write a message that will hide the dashboard from view. This is useful to turn on when you are making changes to your dashboard. If you are a dashboard editor, you will see the dashboard and be able to make edits, but dashboard viewers with no editing access will only see the message.
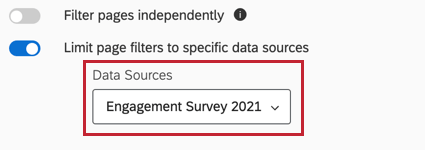
- Filter pages independently: Make it so that the filters you select change only for the page you are on. When disabled, whatever filters you have selected will persist as you navigate your dashboard pages. Learn about these filter changes and more on this Qualtrics Community post.
- Limit page filters to specific data source: This option is disabled by default. When disabled, any page filters on your dashboard will include data for all mapped data sources. Once enabled, a dropdown menu will appear for you to select which data sources are included in page filters. When you first enable this option, the primary data source will be selected by default. You can use the dropdown menu to select additional data sources to be included in your page filters.
 Qtip: Note that this setting only affects regular dashboard filters and widget-level filters. Advanced page filters are unaffected and still aggregate filter values across all data sources.Attention: Org hierarchy filters behave differently depending on this setting. When disabled, response counts for anonymity are calculated only from the dashboard’s primary data source. To include other data sources in your response count calculation, you must enable this option and then choose the additional data sources using the dropdown menu.
 - Allow Org Hierarchy multi select: Allows dashboard viewers to select multiple org hierarchy units when using the org hierarchy filter. This setting is enabled by default.
- Enable off-line report access: Enable the use of report templates. Report templates add another dimension to the reporting experience by providing a way to make Powerpoint-compatible slides or PDF one-pagers of your employee experience data. Every dashboard comes with one report template you can either make from scratch, or from a previously customized dashboard’s report template. Users will be able to export this report from the dashboard, and much like the dashboard, it’ll only contain the data you’ve given them access to in their roles. For more information, see Report Templates Overview (EX).