-

Qualtrics Platform -

Customer Journey Optimizer -

XM Discover -

Qualtrics Social Connect
Report Templates Overview (EX)
About Report Templates
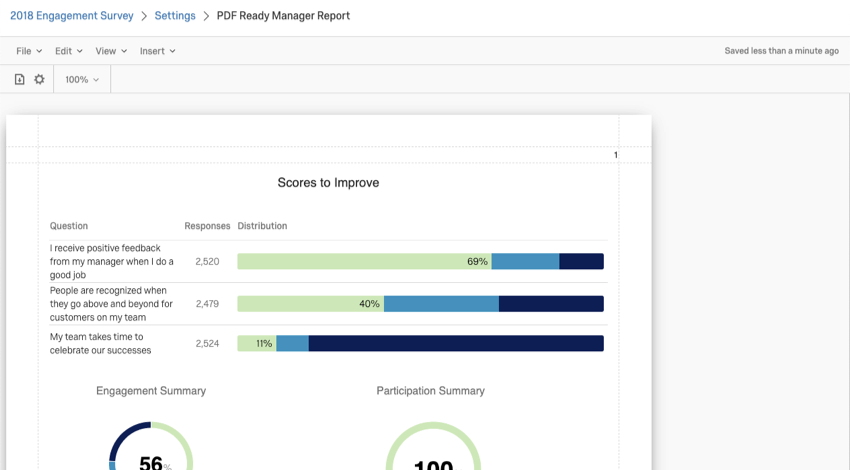
Report templates are a dashboard feature that add another dimension to the reporting experience, by providing a way to make Powerpoint-compatible slides or PDF one-pagers of your employee experience data. These reports provide another way for managers and other dashboard users to export reports from the dashboard, and are often meant to showcase highlights and more condensed data summaries than the dashboard itself.
Every dashboard comes with one report template you can either make from scratch, or from a previously customized dashboard’s report template. Users will be able to export this report from the dashboard, and much like the dashboard, it’ll only contain the data you’ve given them access to in their roles.
Creating the Report Template
To create or edit the report template that’s paired with a dashboard:
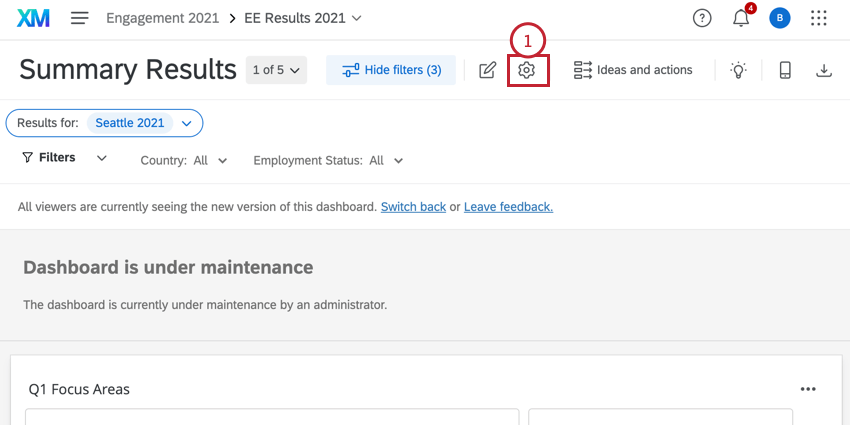
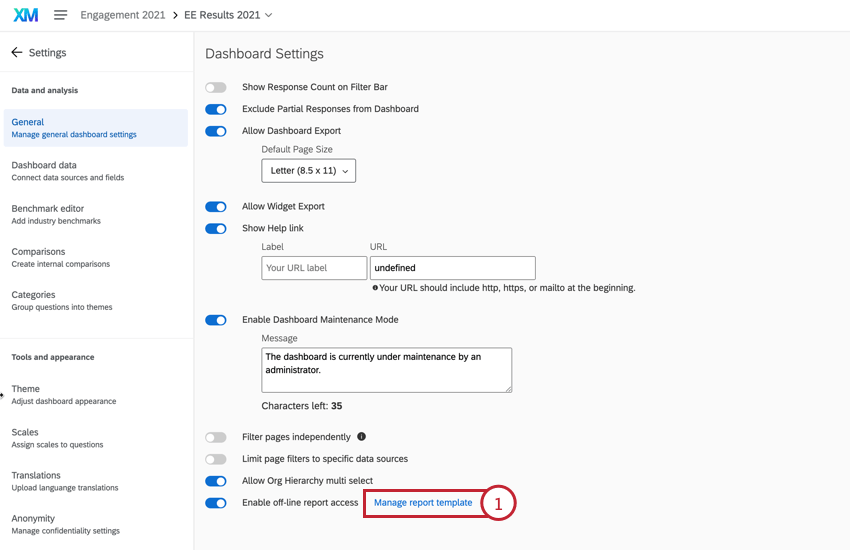
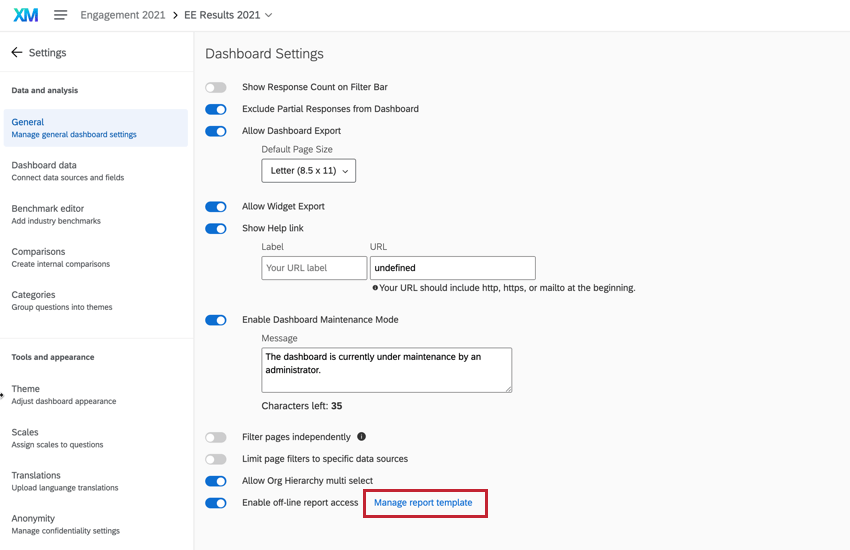
- Open the dashboard you want to add a template to and go to Settings.
- In the General section of dashboard settings, select Enable off-line report access.
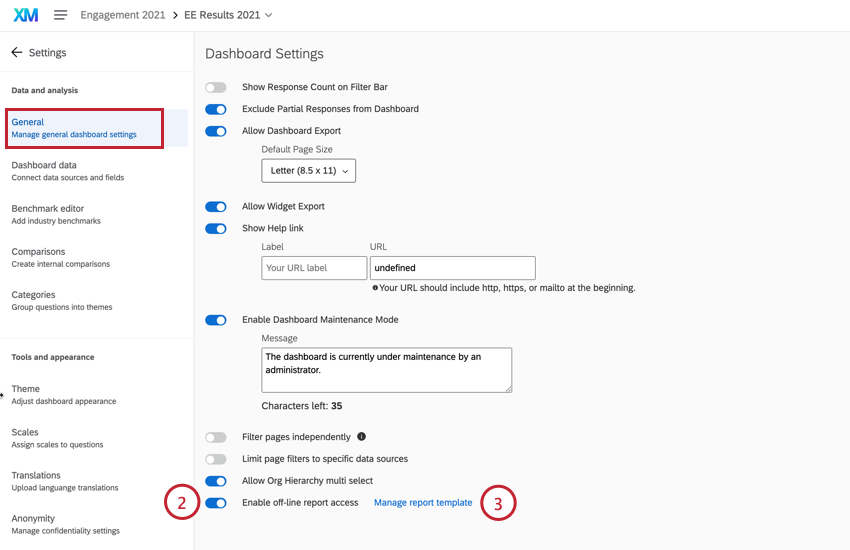
- Click Manage report template.
- Name your template.
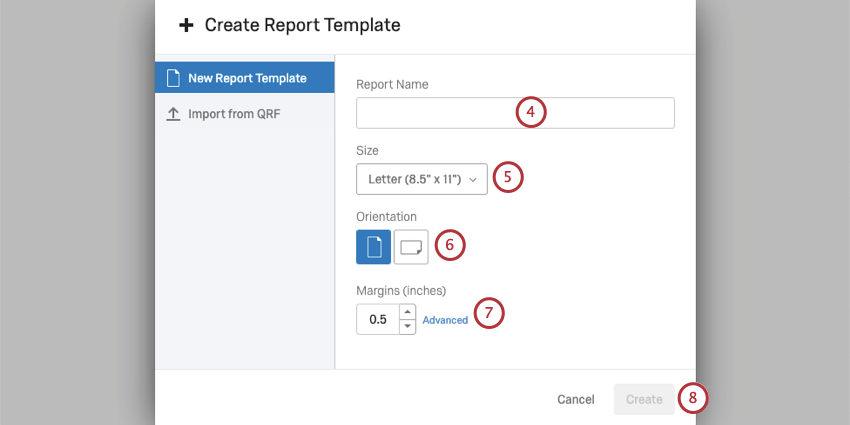
- Determine the page size you want to work with. These are based on common sizes for printable pages.
- Choose whether to make your report in portrait or landscape.
Qtip: Powerpoint slides tend to be Fullscreen 4:3 (10” x 7.5”) size, with a Landscape orientation.
- Determine the margins of your report. Click Advanced to set separate margins for each side of the page.
- Click Create to get started on your template!
Import from an Existing Template
If you have customized a dashboard report template in the past and want to use it again in a new dashboard report, follow these instructions.
- Go to the dashboard existing template.
- Click File.
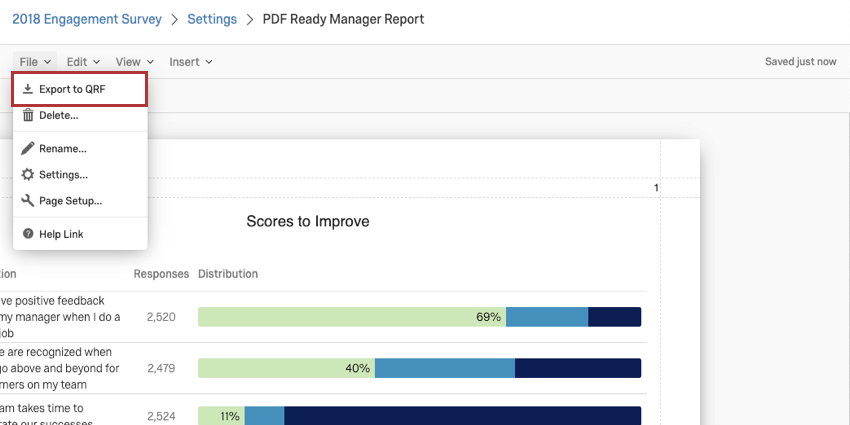
- Select Export to QRF.
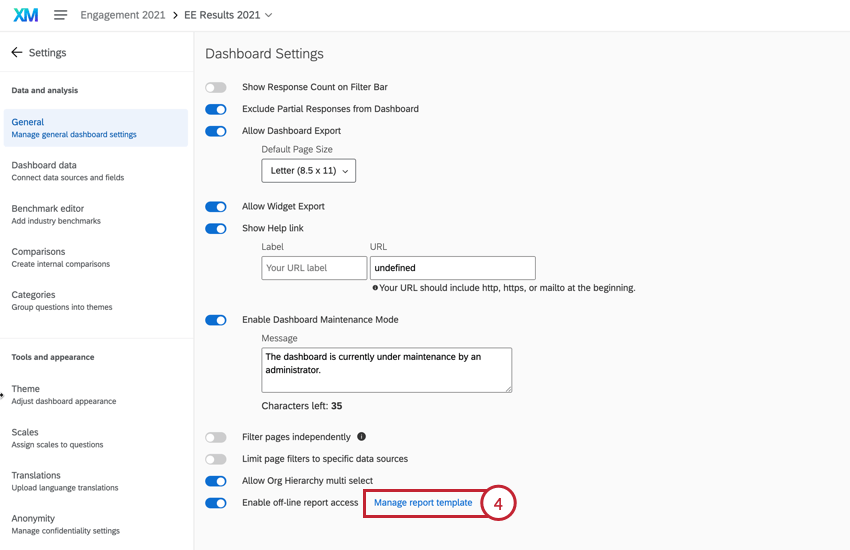
- Go to a new dashboard and open its report template.
- Click Import from QRF.
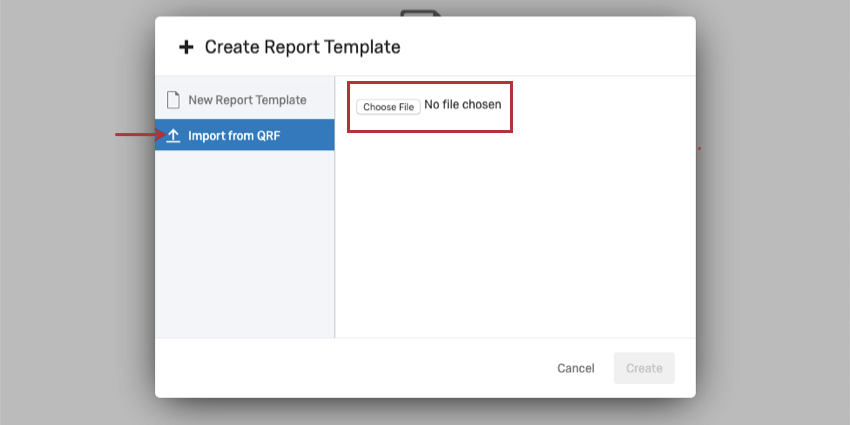
- Click Choose file and select the QRF you just downloaded.
- Select Create.
Editing the Report Template
Users that you give the Dashboard Edit permission (through a role or as an individual user) will be able to edit the report template if they go to Settings and select Manage report template.
When they edit this template, the data they see will be restricted the same way their dashboard data is, by role / user permissions and any filters they applied to the dashboard. However, when admins edit the report template, they will see all data as if no filters are applied.
Report Filters
Filtering works differently in report templates than it does in the dashboard. Because each report is linked to a dashboard, the report should display data with the same restrictions. This includes any filters you have applied to the dashboard.
When a user exports a report, it will have the same filters that they applied to the corresponding dashboard.
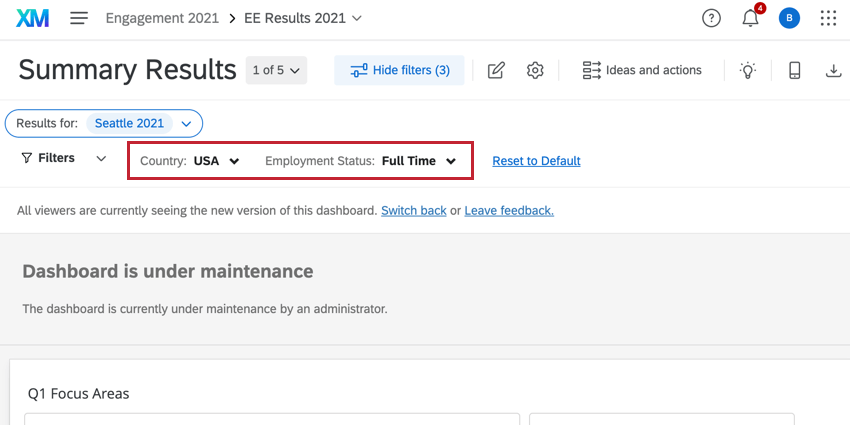
When they click Export Manager Report, the data they see will be for these same employees.
To remove a filter from the report, first remove it from your dashboard, then export the report again.
Visualization-Level Filters
Visualization-level filters are different, in that you can customize these with your report templates. This is so you can match the configuration of any widget-level filters you might’ve added to the dashboard. See Visualization-Level Filters on the Visualization Overview for more details.