-

Qualtrics Platform -

Customer Journey Optimizer -

XM Discover -

Qualtrics Social Connect
Regression & Relative Importance
About Regression and Relative Importance
Regression shows you how multiple input variables together impact an output variable. For example, if both the inputs “Years as a customer” and “Company size” are correlated with the output “Satisfaction” and with each other, you might use regression to figure out which of the two inputs was more important to creating “Satisfaction.”
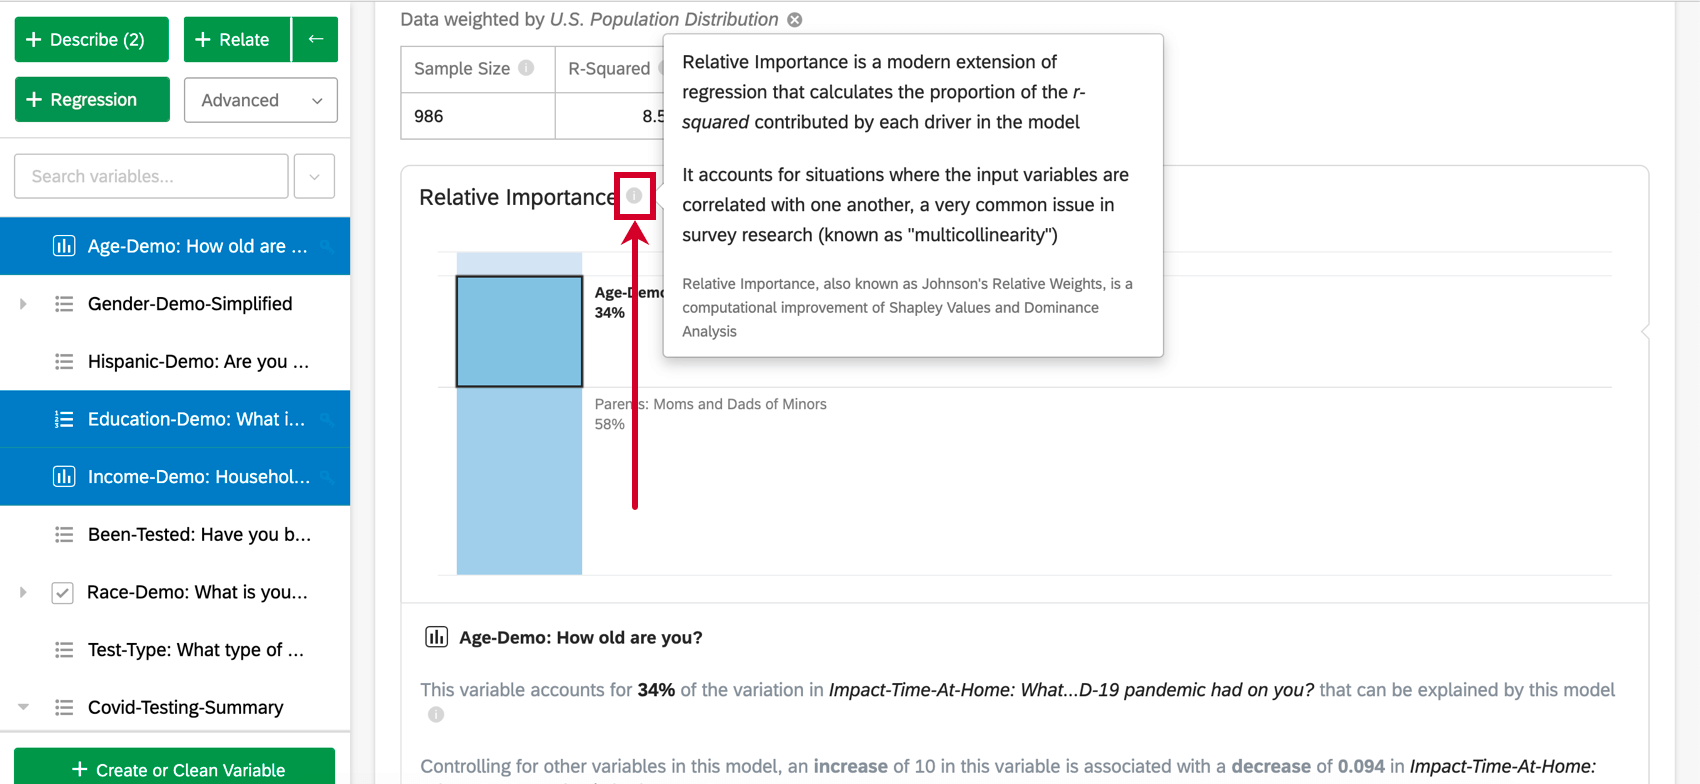
Relative Importance analysis is the best practice method for regression on survey data, and the default output of regressions performed in Stats iQ. Relative Importance is a modern extension of regression that accounts for situations where the input variables are correlated with one another, a very common issue in survey research (known as “multicollinearity”). Relative Importance is also known as Johnson’s Relative Weights, is a variation of Shapley Analysis, and is closely related to Dominance Analysis.
You can find instructions below on how to set up a regression in Stats iQ. For more guidance on thinking through the analytical parts of regression analysis, please see the following pages:
- User-friendly Guide to Linear Regression
- Interpreting Residual Plots to Improve Your Linear Regression
- User-friendly Guide to Logistic Regression
- The Confusion Matrix and the Precision-recall Tradeoff in Logistic Regression
For linear regression, Relative Importance in Stats iQ follows the techniques described in Lipovetsky, Stan & Conklin, Michael. (2001). Analysis of Regression in Game Theory Approach. Applied Stochastic Models in Business and Industry. 17. 319 – 330. 10.1002/asmb.446.
For logistic regression, Relative Importance in Stats iQ follows the techniques described in Tonidandel, Scott & LeBreton, James. (2009). Determining the Relative Importance of Predictors in Logistic Regression: An Extension of Relative Weight Analysis. Organizational Research Methods – ORGAN RES METHODS. 12. 10.1177/1094428109341993.
Selecting Variables for Regression Cards
Creating a regression card will allow you to understand how the value of one variable in your dataset is impacted by the values of others.
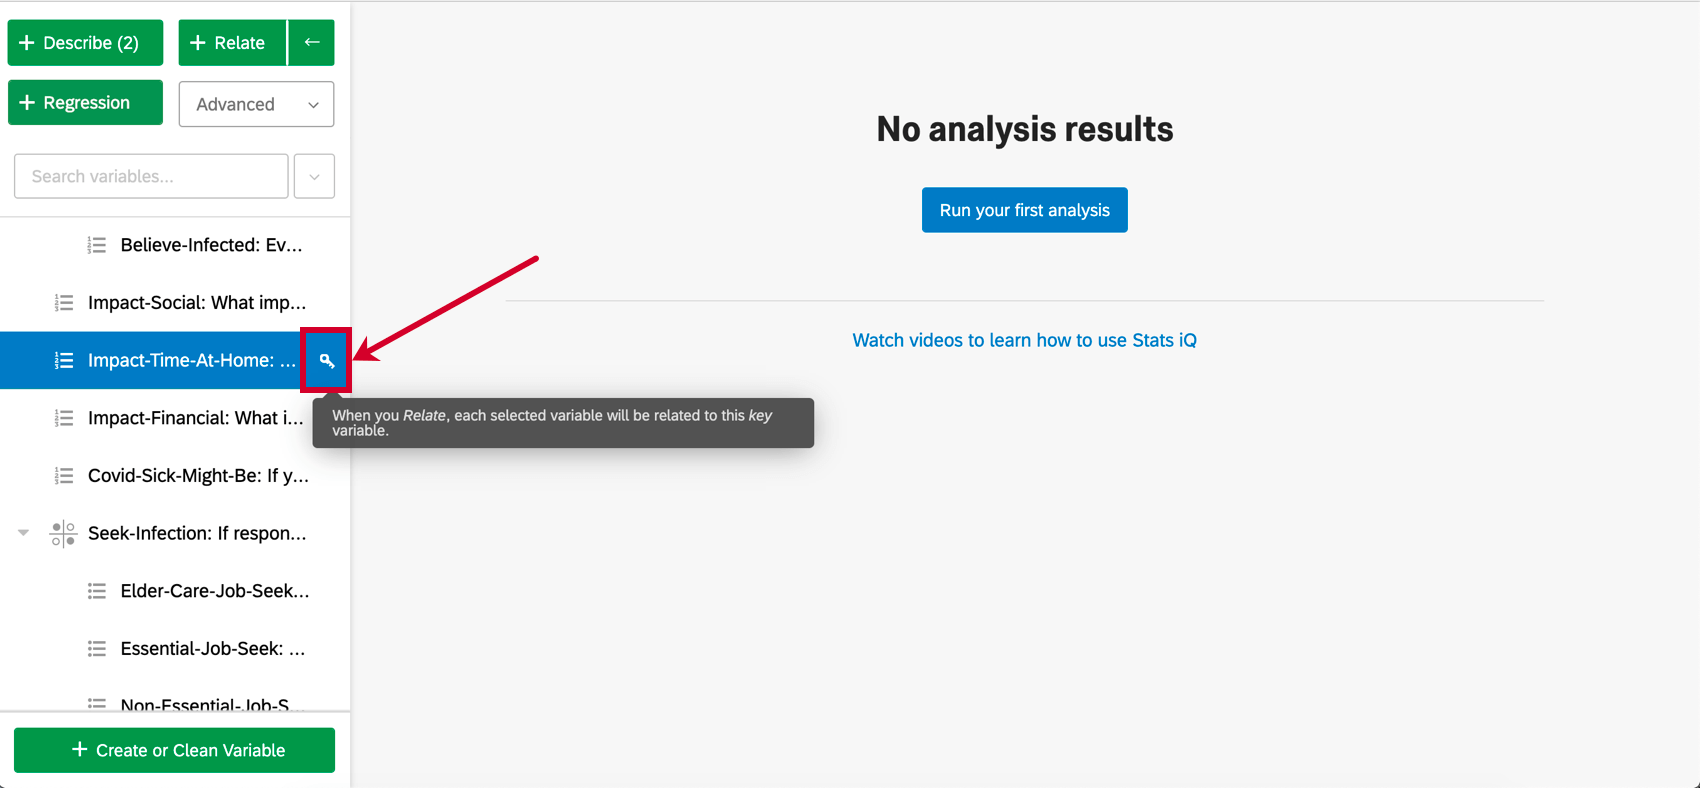
When selecting variables, one variable will have a key by it. For regression, the key variable will be the output variable. Each other variable selected after the key variable will be an input variable. In other words, we’re trying to explain how the value of the output variable is driven by the input variables.
Things to consider when selecting variables for regression:
- You can change the key variable by clicking the key icon next to any variable in the variable pane.
- If more variables are selected than the number of responses that you have, the regression will not run.
- You can select up to 25 input variables. However, you should try to select 1-10 input variables or your results could get very complicated.
If you have a large number of variables you’d like to include in an analysis, consider the following approaches:
- Run some initial regressions and exclude the variables that have very little importance in the model.
- Combine several variables by, for example, averaging them.
- If the structure of your data allows it, you can use a two-step relative importance process, as described on page 341 here.
Example: For example, imagine that you have ten measures of employee autonomy satisfaction and ten measures of employee compensation satisfaction.
- Average those groups into two different summary variables – one for autonomy and one for compensation.
- Run one relative importance analysis with overall satisfaction as the output and the two summary variables as your input to see which group is more important.
- Then run one relative importance analysis with overall satisfaction as the output and only the ten autonomy variables as the inputs to see which are most important within that group.
- Run one relative importance analysis with overall satisfaction as the output and only the ten compensation variables as the inputs to see which are most important within that group.
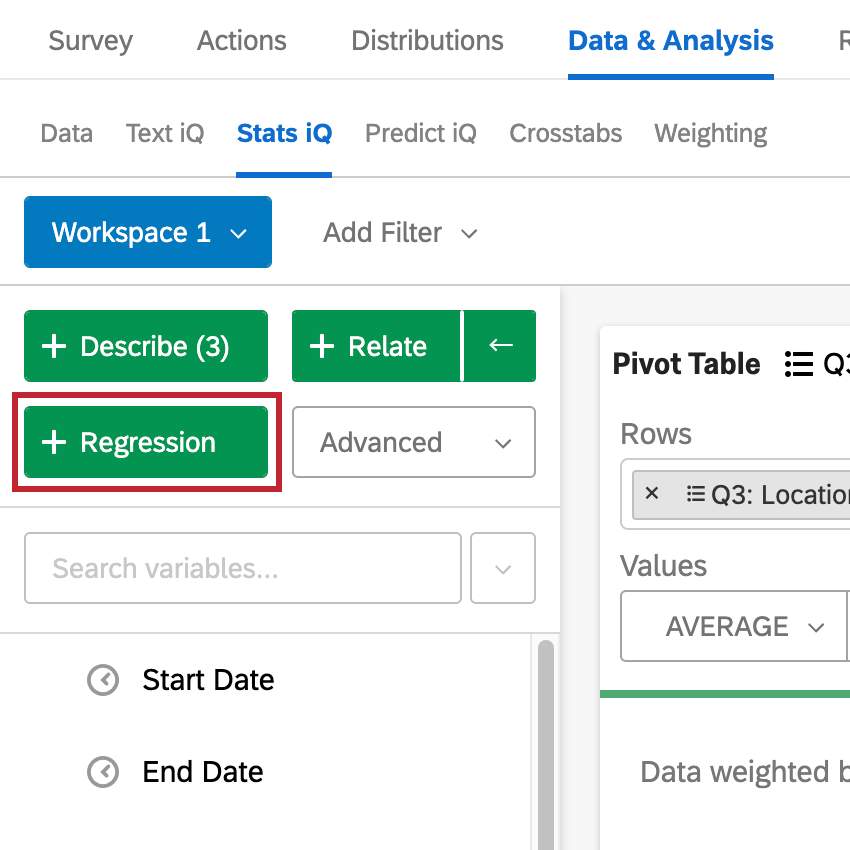
Once you have selected your variables, click Regression to run a regression.
Qtip: At the top of the regression card will be a green (and sometimes red) line. If you click on it, you will see the amount of responses marked as “Included” or “Missing” for that specific card.
- Included: Respondents who answered the question for every single question or data point used in the regression analysis, or had their data for missing input variables imputed. This data will be used in the regression analysis.
- Missing: Respondents who are missing a value for the outcome dependent variable. This data will not be used in the regression analysis.
Types of Regression
There are two main types of regression run in Stats iQ. If the output variable is a numbers variable, Stats iQ will run a linear regression. If the output variable is a categories variable, Stats iQ will run a logistic regression.
More specifically, the types of regression that Stats iQ will run are as follows:
Linear Regression
Relative importance is combined with Ordinary Least Squares (OLS). The output comes from a combination of the two analyses:
- Relative Importance: Everything in this section comes from Relative Importance except the r-squared, which comes from OLS regression.
- Explore the model in detail: Everything in this section comes from Relative Importance except the distributions, which are drawn from the data itself.
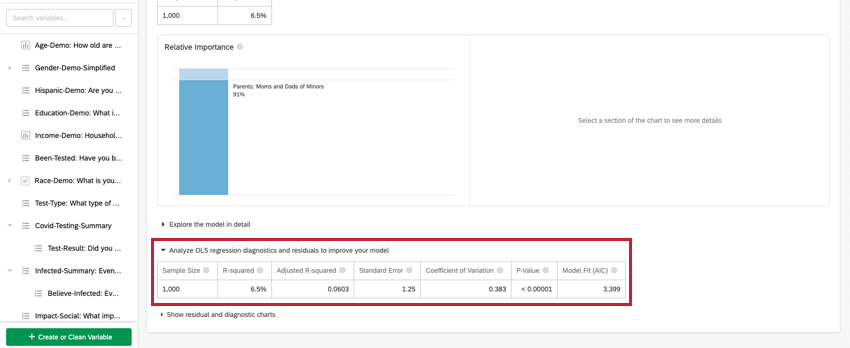
- Analyze OLS regression diagnostics and residuals to improve your model: Everything in this section comes from OLS regression.
Logistic Regression
Logistic regression is a binary classification method that is used for understanding the drivers of a binary (e.g. Yes or No) outcome given a set of input variables. If you run a regression on an output variable with more than two groups, Stats iQ will select one group and bucket the others together so as to make it a binary regression (you can change which group is being analyzed after running the regression).
Relative Importance
Input variables in survey data are often highly correlated with one another; this is a problem called “Multicollinearity.” This can lead to regression output that artificially increases the importance of one variable and decreases the importance of another correlated variable. Relative Importance is recognized as the best practice method to account for this.
Relative Importance (specifically Johnson’s Relative Weights) does not suffer from this problem and will adequately balance the importance of the input variables, regardless of what type of regression is being run. It also calculates each variable’s relative weight (or relative importance), the proportion of explainable variation in the output due to that variable. This is shown as a series of percentages that add to 100%.
It returns results similar to running a series of regressions, one for each variation of the input variables. For example, if you had two variables, it would do the equivalent of running three regressions: one with Variable A, one with Variable B, and one with both. This allows it to quantify each variable’s importance and apply that quantification back to the regression result.
Regression Output
When you run a regression in Stats iQ, the analysis results contain the following sections:
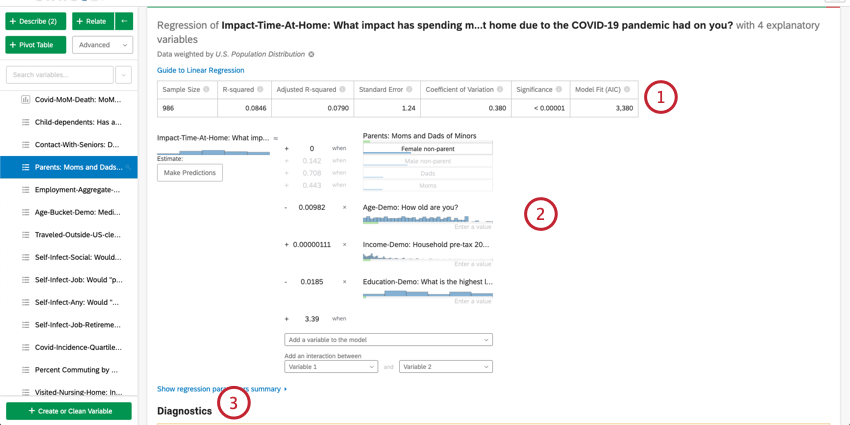
Numerical Summary
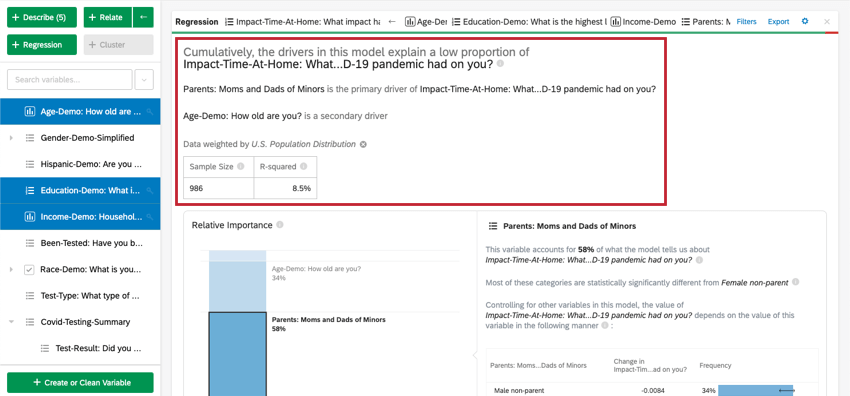
At the top of the card is a summary for the regression analysis. Looking at the chosen variables, this written summary explains which variables are the primary vs. secondary drivers as well as drivers that had low cumulative impact. The data table includes the Sample Size and R-squared value.
Relative Importance
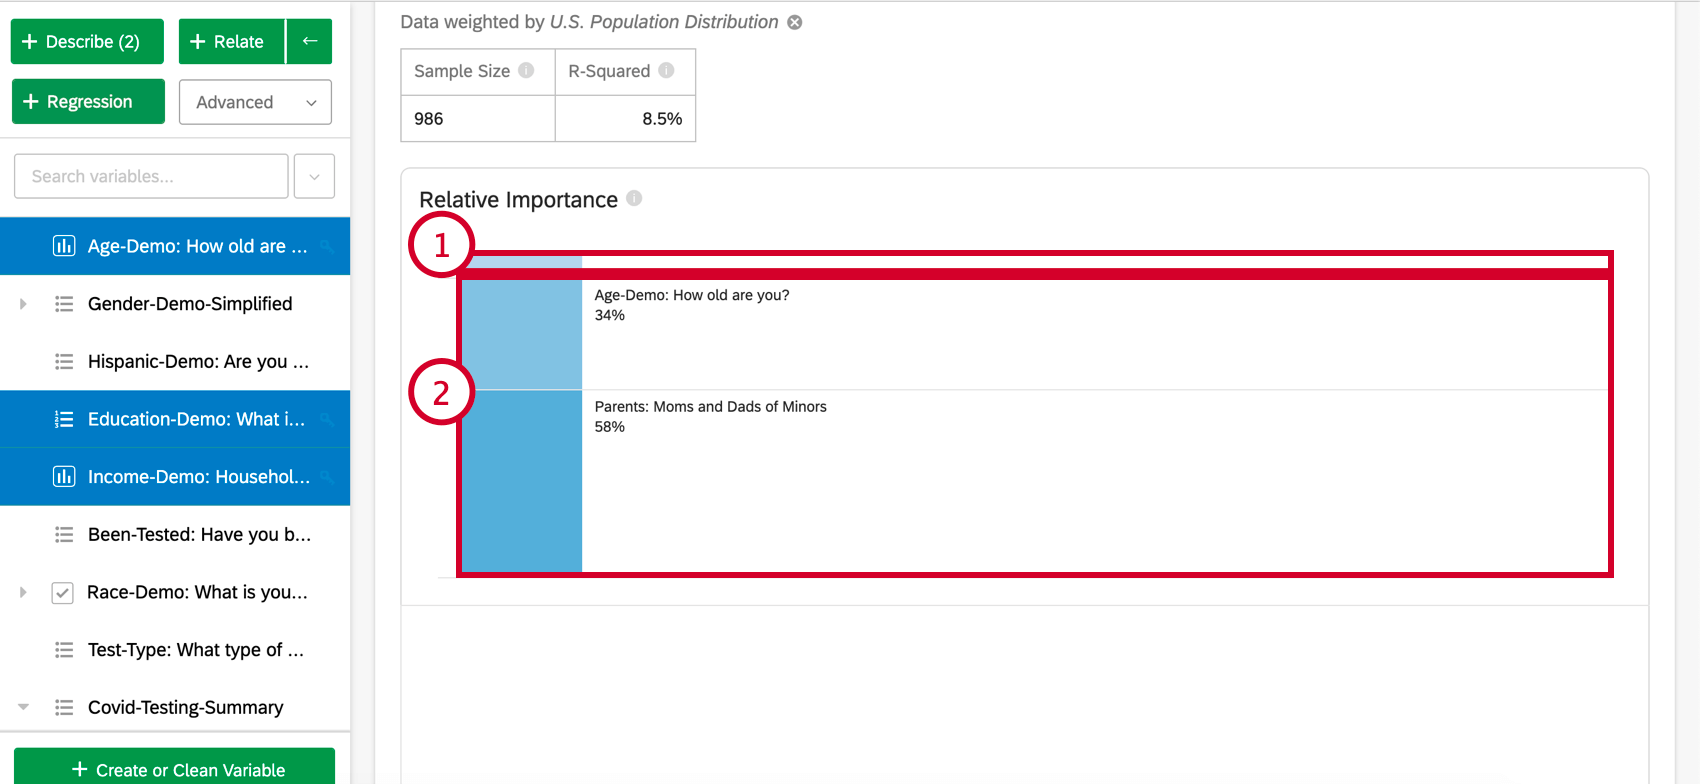
- Low Impact Variables: Variables that individually have a relative importance of 10% or less will be grouped together. When selected, there will be a section explaining each low impact variable’s relative importance and statistical significance.
- High Impact Variables: Each high impact variable will be separate and clickable. Once a variable is selected, below the bar chart, you’ll be able to view the variation accounted for and what would happen if other variables were controlled for in the model.
Additional Model Details
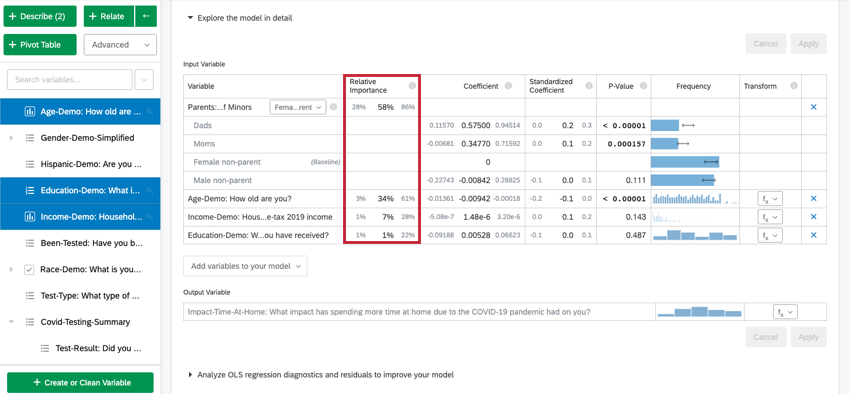
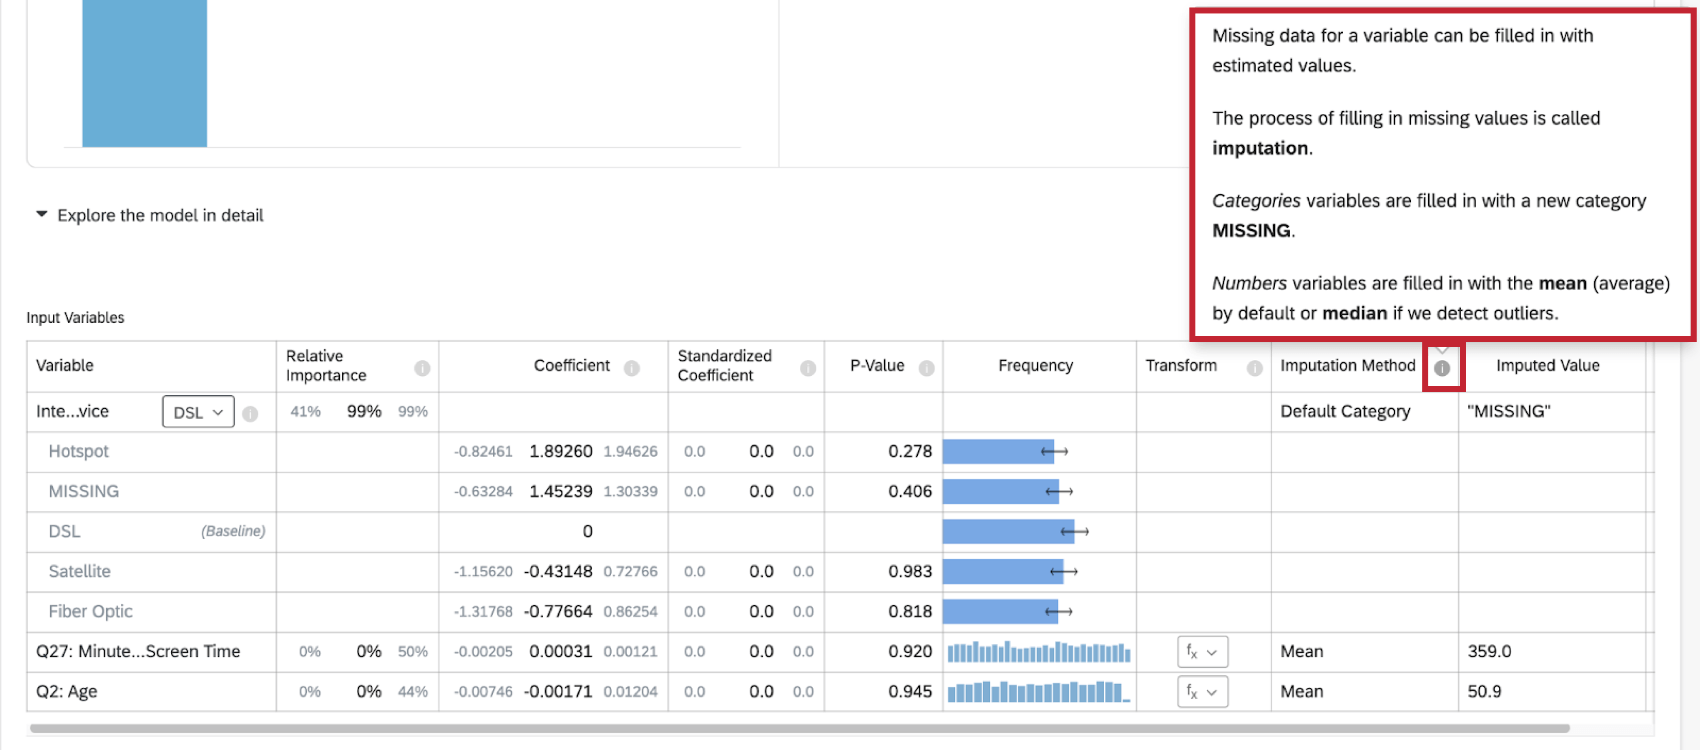
When you select Explore the model in detail, you will see your input variables and your output variable listed. Your input variables will come with the following information:
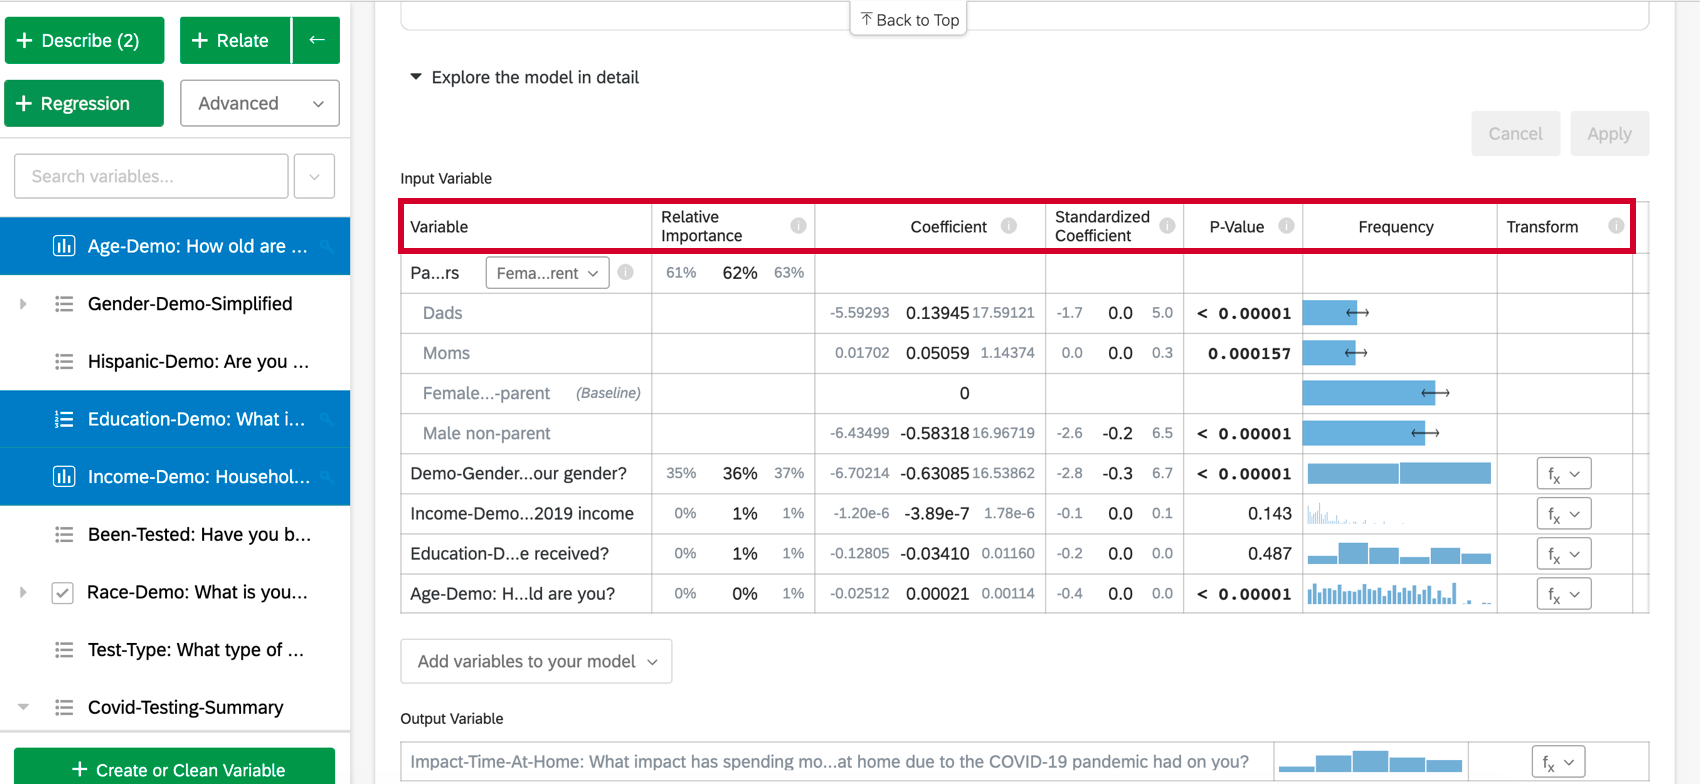
- Relative Importance: The proportion of the r-squared that is contributed by an individual variable. The r-squared is the proportion of the outcome variable’s variation that can be explained by the input variables in this model. See Relative Importance for more details.
- Odds ratio: Only relevant to logistic regression. The odds ratio for a given input variable indicates the factor by which the odds change for each unit increase in the explanatory variable.
Example: For example, if the odds ratio for Satisfaction with Manager is 1.1 and the output variable’s groups are Satisfied and Not Satisfied, then for every instance in which Satisfaction with Manager is 1 higher, the output variable’s odds of being Satisfied are 1.1 higher (10% higher). If the row of data is a Category, like color[blue], the coefficient represents the change in odds of the response variable if the Categories variable is that particular Category (blue) instead of the “baseline” group (red, green, etc.).
- Coefficient: Each increase of 1 unit in an input variable is associated with an increase of the coefficient in the output variable. These coefficients are constructed based on the results of the relative importance analysis and therefore adjust for multicollinearity and do not match the coefficients that would result from a standard Ordinary Least Squares regression.
- Standardized Coefficient: The standardized coefficient is the coefficient divided by the input variable’s variance. This puts each variable on the same scale so their coefficients can be more directly compared.
- P-Value: The p-value is the measure of statistical significance. Lower values are associated with lower odds that the relationship is a coincidence. For categorical variables, the p-value indicates the statistical significance of the difference between a group and the “baseline” group in the variable.
- Transform: See Transforming Variables.
Analyzing OLS Regression
For linear regression, click Analyze OLS regression diagnostics and residuals to improve your model below the key/output variable to view the Predicted vs Actual and Residuals plots. See Interpreting Residual Plots to Improve Your Regression for more information.
Variable Included
Along the topmost header of the regression card, you’ll see the variables used in the regression.
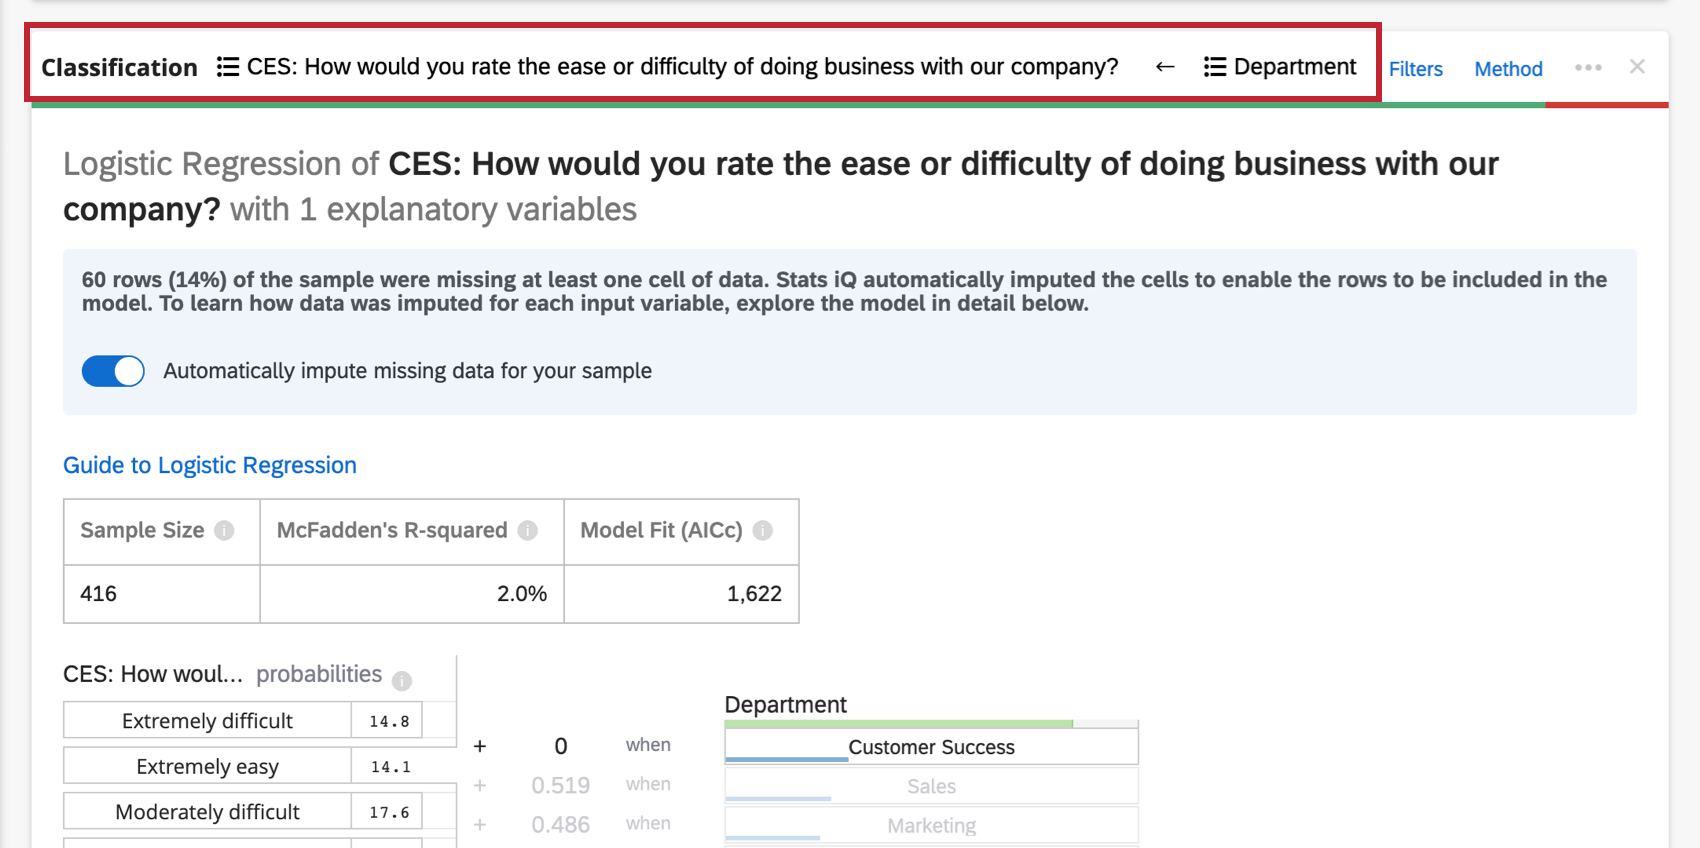
Click the name of a variable to open a new window where you can recode or bucket values. Click the arrows to switch which are the input and which are the output variables in the analysis.
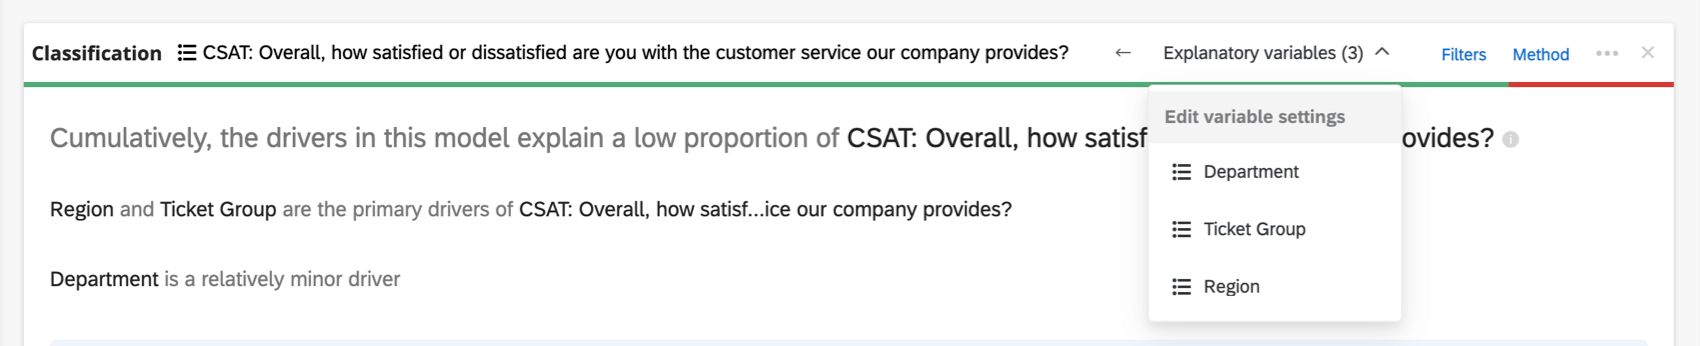
If you have too many variables involved to display in the header, there’ll be an Explanatory variables dropdown where you can choose between the variables you’d like to recode.
Adding and Removing Variables
Once you have created a regression card, you can add additional variables to the analysis by following the below steps:
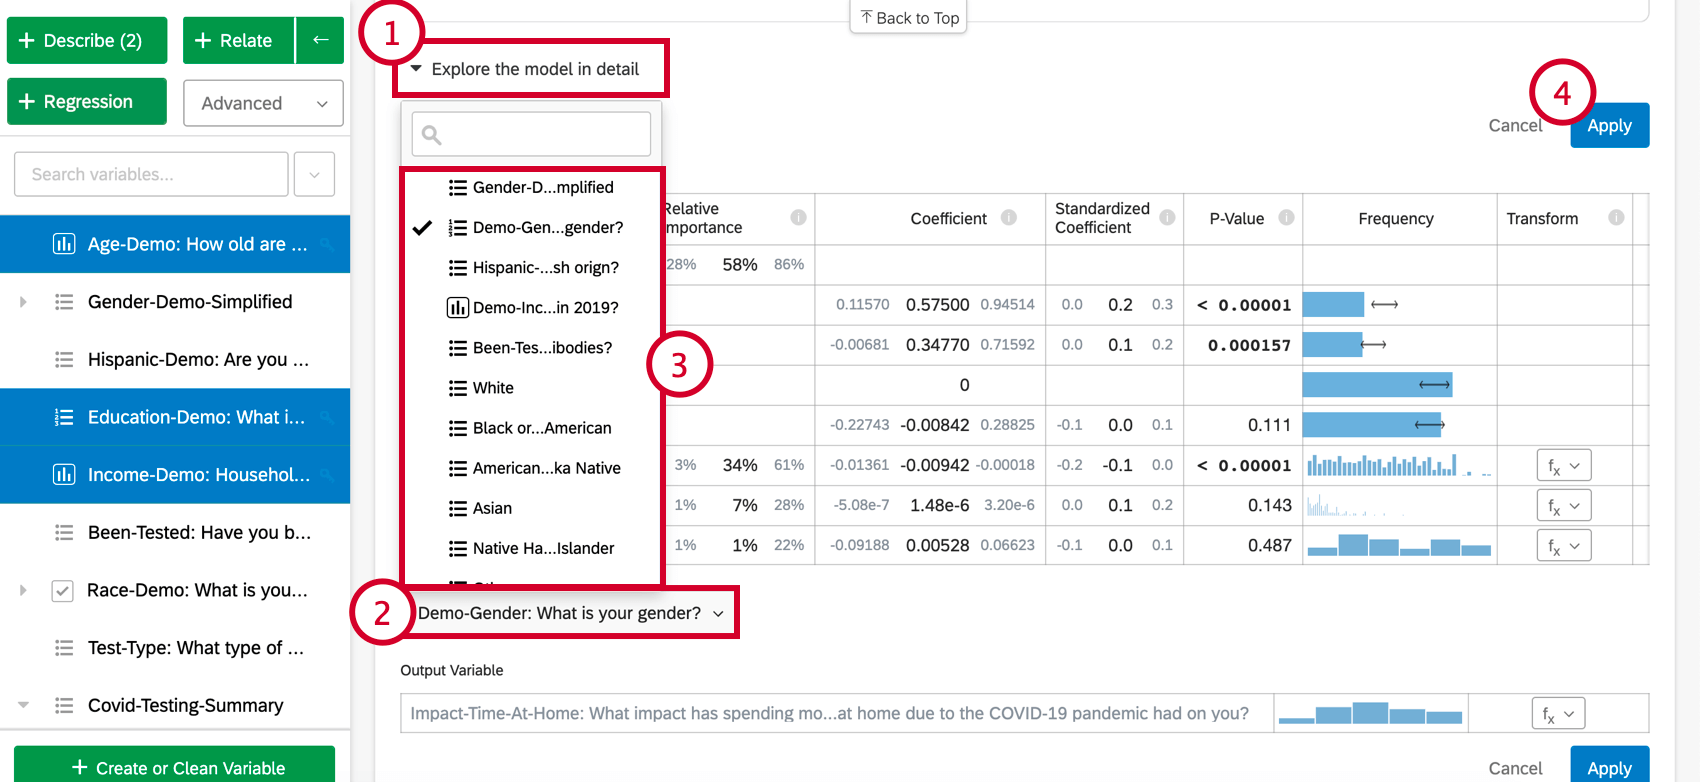
- Click Explore the model in detail.
- Select Add variables to your model at the bottom of the card. This will bring up a list of variables that have not yet been used for the regression.
- Choose a variable from this list.
- Click Apply to run the analysis again with the new variable included.
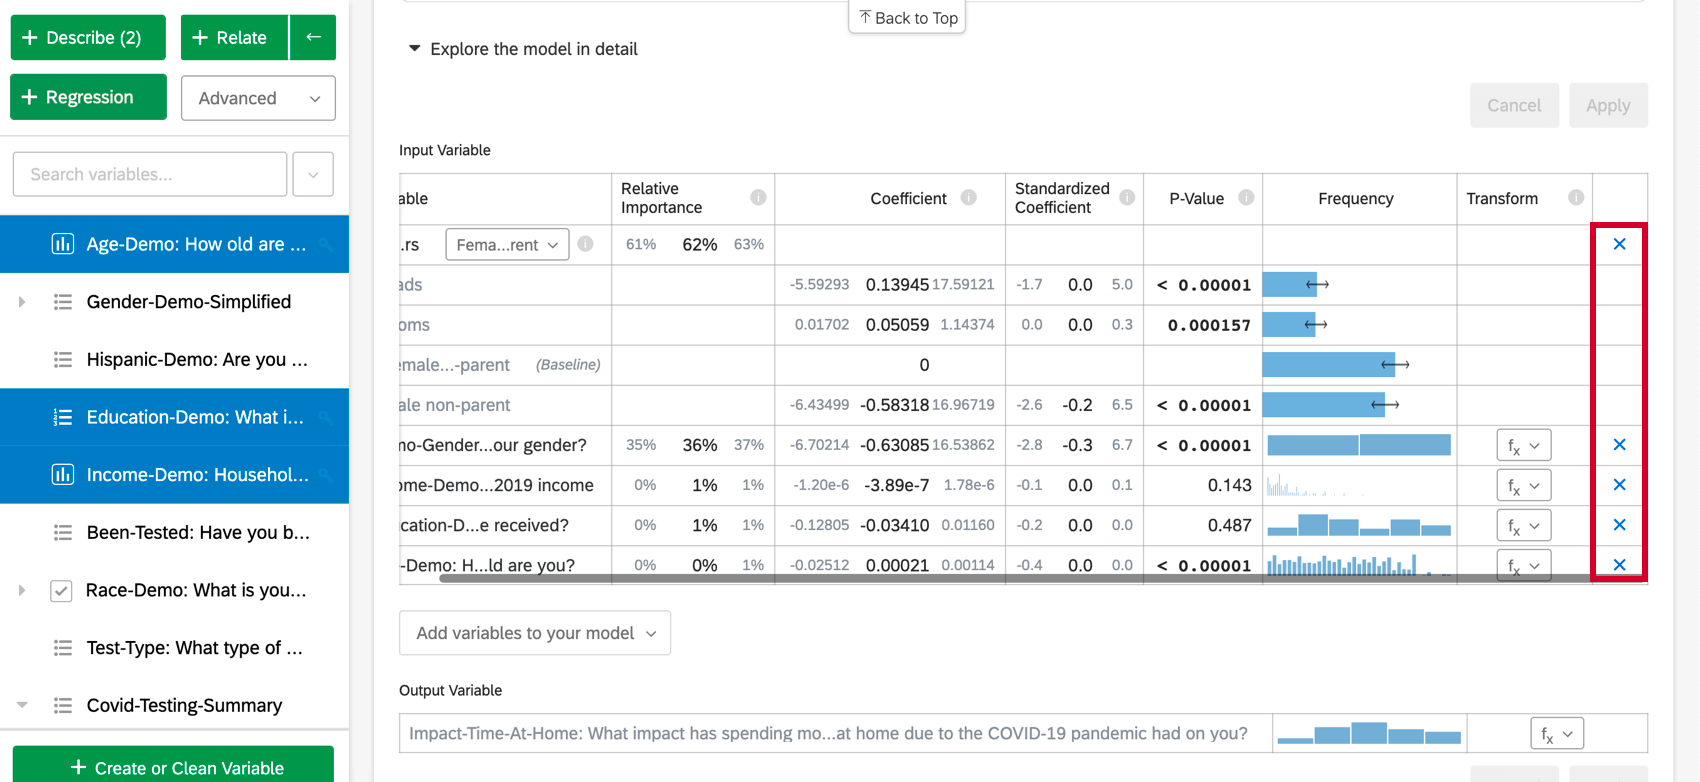
To remove a variable from the regression, hover over the desired variable and click the blue X on the far-right side of the table. After choosing variables to add or remove, make sure to select “Apply” to run the new model.
Imputing Variables
Regression will only consider rows where all the input variables have data. However there is often missing data with survey data collection, which can negatively affect your regression analysis and model. If you only include rows that have no missing data in your regression, your analysis results can be biased because your sample is not representative of your entire dataset.
With imputation, Stats iQ will automatically fill in missing data with estimated values. When missing data is filled in, you are able to include more of your original data in the regression analysis, resulting in a regression model with less bias that can better explain the variation in your desired outcome variable.
Imputation is automatic, so when you run a regression analysis on a dataset with missing values, your dataset will be imputed before any calculations are done.
- Click here to view an example dataset before and after imputation of variables.
- Before Imputation:
For this regression, “Data Usage” is the outcome variable and “Age”, “Internet Service” and “Minutes of Screen Time” are the input variables.Row ID Data Usage Age Internet Service Screen Time (Minutes) 1 75 39 Satellite 503 2 19 41 Fiber Optic 52 3 87 434 4 54 23 Satellite 5 14 101 6 75 Satellite 7 81 57 DSL 329 Attention: If you ran a regression without filling in the missing values, only rows 1, 2, and 7 would be included.After Imputation:
Row ID Data Usage Age Internet Service Screen Time (Minutes) 1 75 39 Satellite 503 2 19 41 Fiber Optic 52 3 87 50.9 MISSING 434 4 54 23 Satellite 359.0 5 14 50.9 MISSING 101 6 75 50.9 Satellite 359.0 7 81 57 DSL 329 Qtip: “Internet Service” is a categorical variable, not a numeric one, so the missing value is filled in as “MISSING”.
Imputation Methods
Stats iQ currently uses the following imputation methods:
- Default Category: Stats iQ will create a new “MISSING” category value to fill in missing data. This method is used for categorical variables.
- Mean: If Stats iQ detects no outliers in the distribution of the numeric variable, then missing data for the variable is filled in with the mean (average) value. This method is used for numeric variables.
- Median: If Stats iQ detects outliers in the distribution of the numeric variable, then missing data for the variable are filled in with the median value. This method is used for numeric variables.
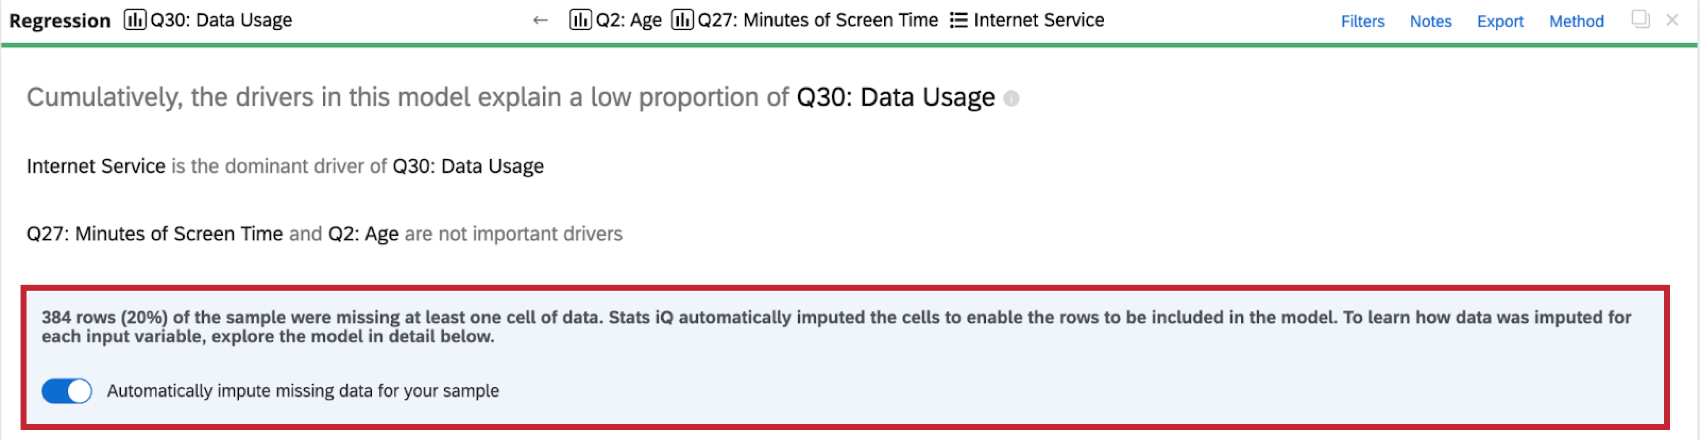
Imputation Indicators
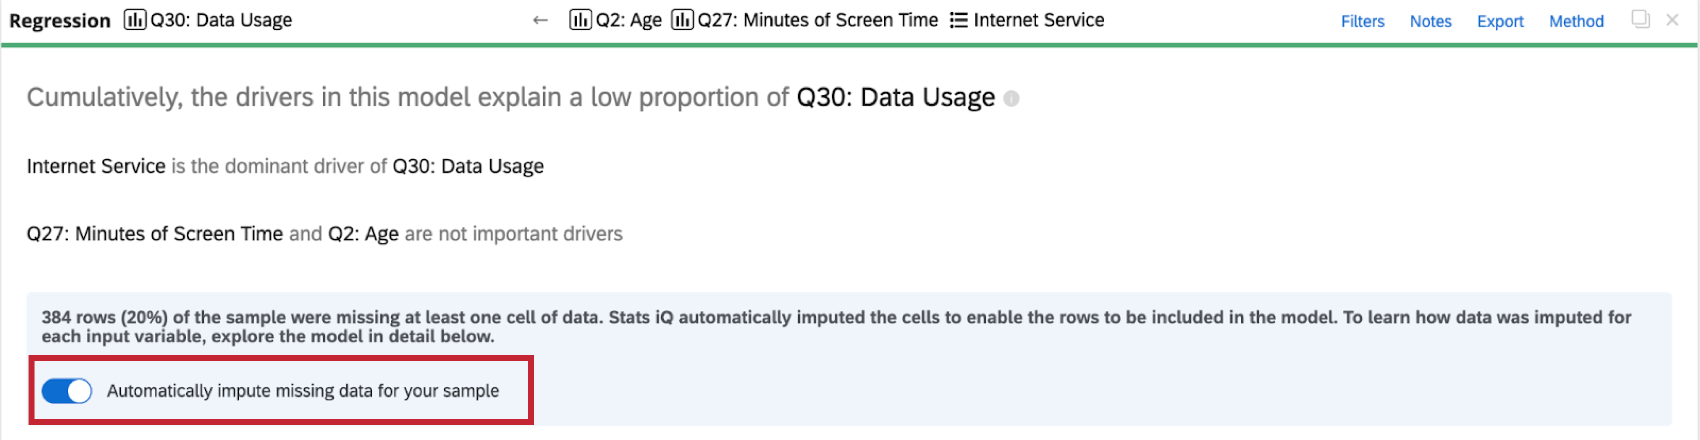
When you perform a regression analysis on the dataset, you will see an indicator of imputation at the top of the regression card.
More information on imputation is available by clicking the information symbol ( i ) next to Imputation Method.
Disabling Imputation
Stats iQ automatically applies imputation to all regression cards. To disable automatic imputation, click Automatically impute missing data for your sample at the top of the regression card.
Imputation Warnings
- If too much data is imputed, your regression model will become biased and unreliable. When over 50% of your dataset has been filled in, Stats iQ will warn you about drawing conclusions from your regression results.

- When outliers are detected in any of the numeric input variables, Stats iQ will impute the variables using the median value instead of the mean. In this scenario, Stats iQ will warn you when you explore the model in detail.

Transforming Variables
When running a regression analysis in Stats iQ, you may find that you need to improve your model. The most common way to improve a model is to transform one or more variables, usually using a “log” or other functional transformation.
Transforming a variable changes the shape of its distribution. In general, regression models work better with more symmetrical, bell-shaped distributions. Try different kinds of transformations until you find one that gives you this type of distribution.
To transform a variable:
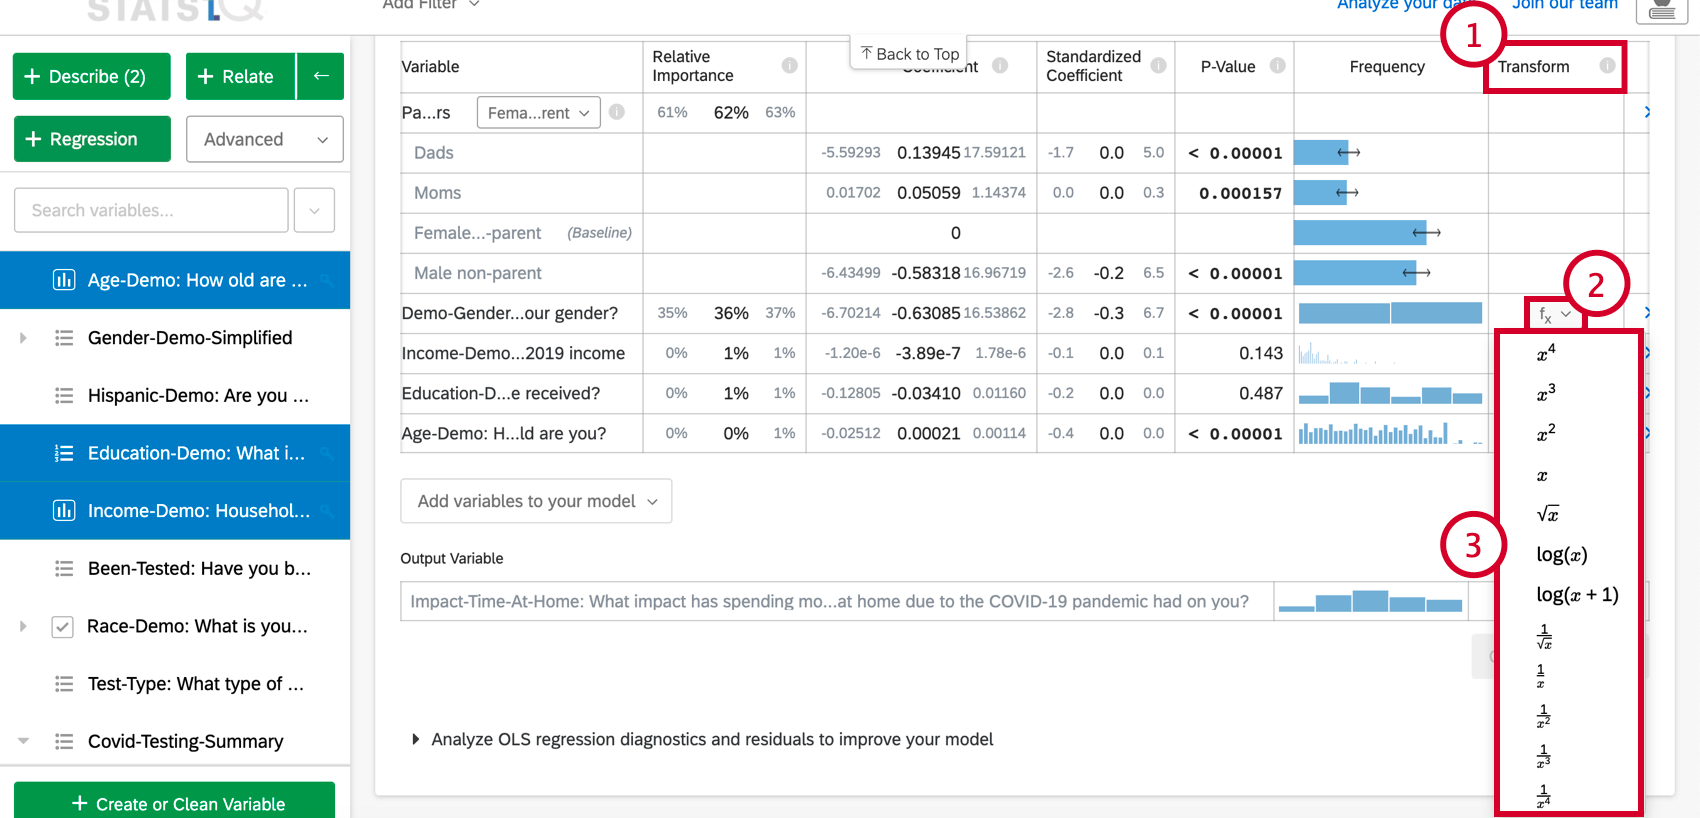
- Under the Explore the model in detail option, scroll to the Transform column.
- Click the function (f(x)) button for the variable you’d like to transform.
- From the list, choose the function you would like to apply and Stats iQ will recalculate the card using the new transformed variable.
The following transformations are available in Stats iQ:
![]()
By far the most common transformation is log(x). It transforms a “power” distribution (like city population size) that has many smaller values and a small number of larger values into a bell-shaped “normal distribution” (like height) where most values are clustered towards the middle.
Use log(x+1) if the variable being transformed has some values of zero, since log(x) cannot be calculated when x is zero.
For more details on when to transform your variables, please see Interpreting Residual Plots to Improve Your Linear Regression
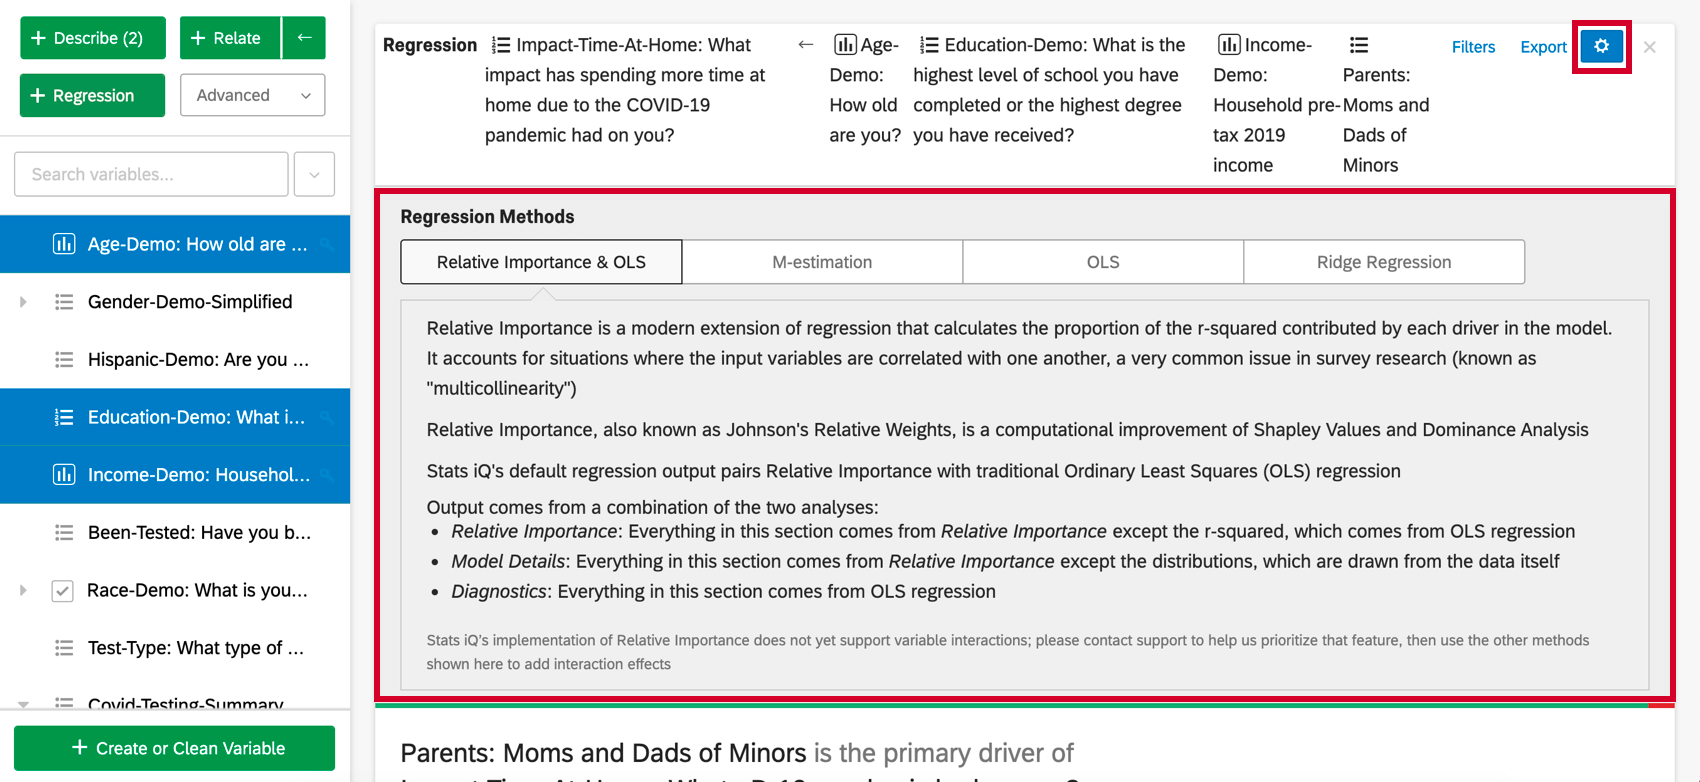
Other Linear Regression Techniques Available in Stats iQ
Relative Importance combined with Ordinary Least Squares is the default output for a linear regression. However, there are other options available.
To access M-estimation, Ordinary Least Squares, and Ridge Regression, click on the settings gear in the top-right corner of your regression card. Clicking the name of the regression technique under Regression Methods will allow you to change the regression technique used for the regression card. This can only be done for linear regression.
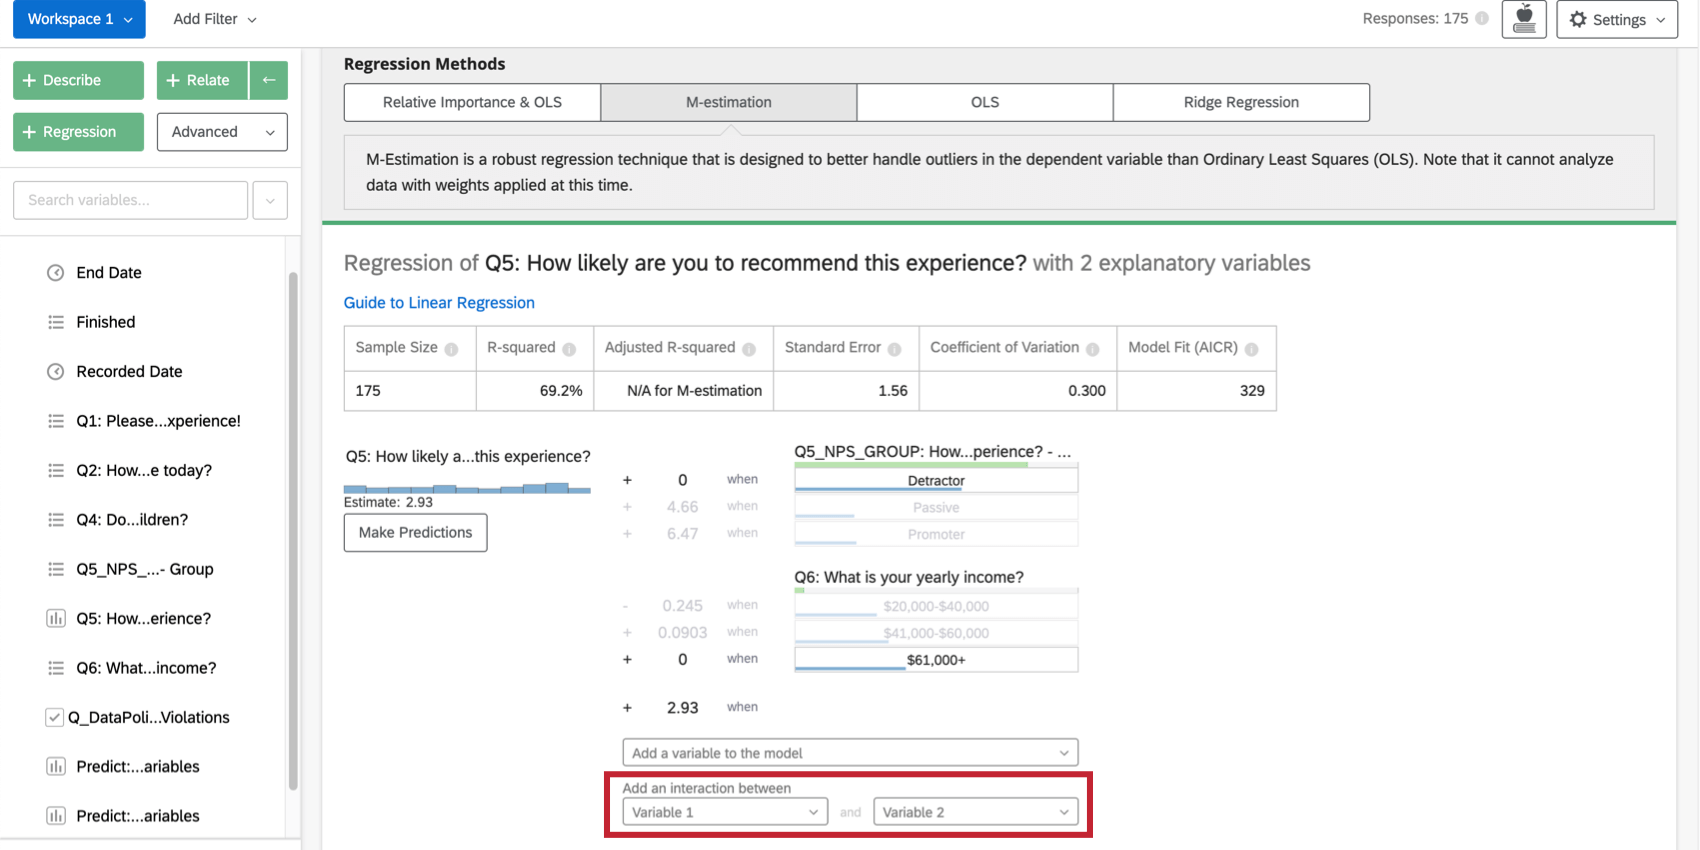
- M-estimation: Designed to handle outliers in the output variable better than Ordinary Least Squares (OLS).
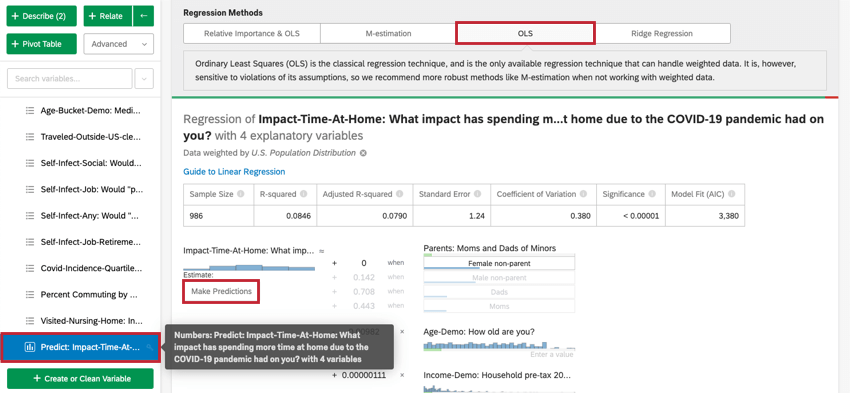
- Ordinary Least Squares: Ordinary Least Squares (OLS) is the classic regression technique. It is sensitive to outliers and other violations in its assumptions, so we recommend more robust methods like M-estimation. Since OLS is used in the default Relative Importance output, you should only select this option if you’re interested in the features that have not yet been adapted into the relative importance output: predicting outcomes and adding interaction terms.
- Ridge Regression: Ridge regression is a technique similar to the standard OLS regression, but with an alpha tuning parameter. This alpha parameter helps deal with high variance and data that suffers from multicollinearity. When properly tuned, ridge regression generally yields better predictions than OLS due to a better compromise between bias and variance. In Stats iQ, you will be able to choose the alpha parameter when using ridge regression.
Once you’ve selected M-estimation, Ordinary Least Squares, or Ridge Regression, you’ll be able to see the output. The output will appear below the Regression Methods section.
- Numerical Summary: At the top of the card is a summary for the regression analysis. This includes the Sample Size, Missing Cases, Method, R-squared value, Standard Error, Coefficient of Variation, and Model Fit.
- Coefficient Details: The primary results of the regression, the mathematical equation, is under the summary. The output/key variable is on the left of the equation. The input variables are on the right side. Hovering over a variable displays a tooltip that explains in plain terms how that variable contributes to the output variable. Here, you can also input values into the mathematical equation for estimating values for your output variable. See the below section on estimating output variable values for more information.
- Diagnostics and Residuals: Stats iQ provides diagnostics to help you assess the accuracy and validity of your model. To learn more, see Interpreting Residual Plots to Improve Your Linear Regression or The Confusion Matrix and the Precision-recall Tradeoff in Logistic Regression.
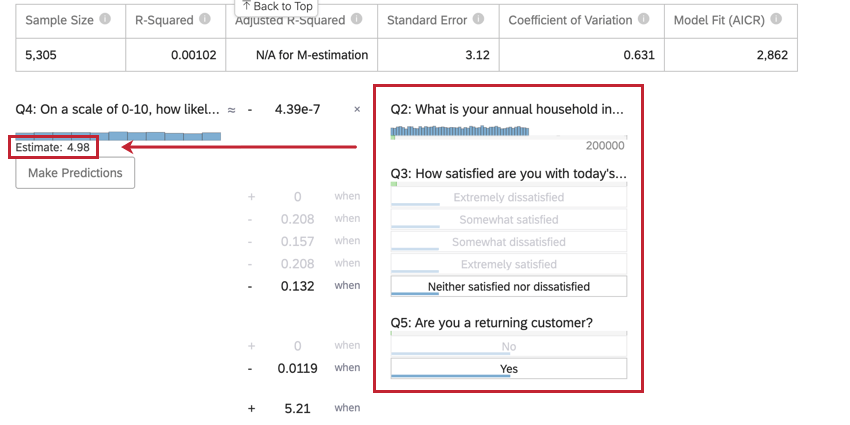
Estimating Output Variable Values
Once you’ve run a regression, you’re able to use the mathematical equation in the Coefficient Details section to estimate output variable values based on input values you select. On the right side of the equation, you’ll see your input variables. You can set values for each of your inputs variables. On the left side of the equation is your output variable. After entering values for your input variables, the equation will calculate an estimate for the output variable based on the regression model.
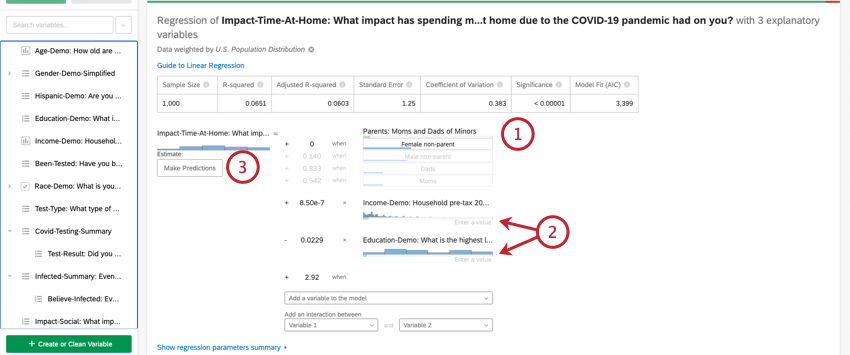
- This input variables is a category type variable. To input a value for category variables, click the desired value out of the list of options.
- These input variable are number type variables. To input a value for number variables, click Enter a value and type in a number.
- This variable is the output variable of your regression equation. After selecting values for your input variables, an estimated value for your output variable will appear next to where it says Estimate.
Predicting Outcomes
Usually, you’ll use regression analysis in Stats iQ to understand the relationship between input variables and output variables. However, once a regression model is created, it can also be used to predict the output value for rows of data where you have values for the inputs.
Interaction Terms and Other Advanced Concerns
Adding Interaction Terms
When looking to improve your regression model, you may want to add interaction terms in addition to the existing input variables. An interaction term would be added if you suspect that the value of one of the input variables changes how a different input variable affects the output variable.
For example, perhaps for people with children present during a hotel stay, younger people are more satisfied than older people, but for people without children present, younger people are less satisfied. That would mean that there’s an interaction between “Children Present” and “Age.”
Selecting two variables under Add an interaction between at the bottom of the list of input variables on the card will add an interaction term to the regression. This functionality is only available in Ordinary Least Squares, M-Estimation, and Ridge Regression.
You can achieve the same effect for categorical variables in a Relative Importance analysis by creating a new variable that combines the two. For example, you might combine the variable Color (with red and green groups) with Size (with big and small groups) to make a variable called ColorSize (with groups BigRed, BigGreen, SmallRed, and SmallGreen).
Multicollinearity
Multicollinearity occurs in a regression context when two or more of the input variables are highly correlated with each other.
When two variables are highly correlated, the mathematics for the regression generally puts as much value as possible into one variable and not the other. This is manifested in a larger coefficient for that variable. But if the model is changed even a small amount (by adding a filter, for example), then the variable where most of the value was placed can change. This means that even a small change can have a drastic effect on the regression model.
Relative Importance analysis handles this issue so you don’t have to worry about it. If you prefer to use one of the other methods and your model has this issue, the presence of multicollinearity (measured by “Variance Inflation Factor”) will trigger a warning and suggest that you remove a variable or combine variables by averaging them, for example.
Warning Messages
Stats iQ will warn you when there are potential issues with your regression results. These include the following situations:
- Input variables in your regression are not statistically significant.
- Your transformation removed data from the regression.
- Two or more variables are highly correlated with each other and are making your results unstable, i.e. multicollinearity.
- The residuals have a pattern that suggest that the model could be improved.
- A variable with only one value has been automatically removed.
- The sample size is too low relative to the number of input variables in the regression.
- A categories variable with too many response options has been added.