-

Qualtrics Platform -

Customer Journey Optimizer -

XM Discover -

Qualtrics Social Connect
Predict iQ
About Predict iQ
When customers leave a company, we’re often caught off-guard. If only we’d known this customer was at-risk, then maybe we could’ve reached out to them before they totally lost their faith in us. If only there were a way to predict the likelihood that a customer will churn (leave the company).
Predict iQ learns from respondents’ survey responses and embedded data in order to predict whether the respondent will eventually churn. Then when new survey responses come in, Predict iQ can predict how likely those survey respondents are to churn in the future. To predict if a customer will churn, Predict iQ uses Neural Networks (a subset of which are called Deep Learning) and Regression to build candidate models. It tries variations of those different models for each dataset and then chooses the model that best fits the data.
Preparing Your Data
Before you create a churn prediction model, you’ll want to make sure your data is ready.
Predict iQ works best when you have at least 500 respondents who have churned. However, 5,000 churned respondents or more will get you the best results.
Setting Up a Churn Variable
- In the survey where you want to predict Churn, go to the Survey flow.
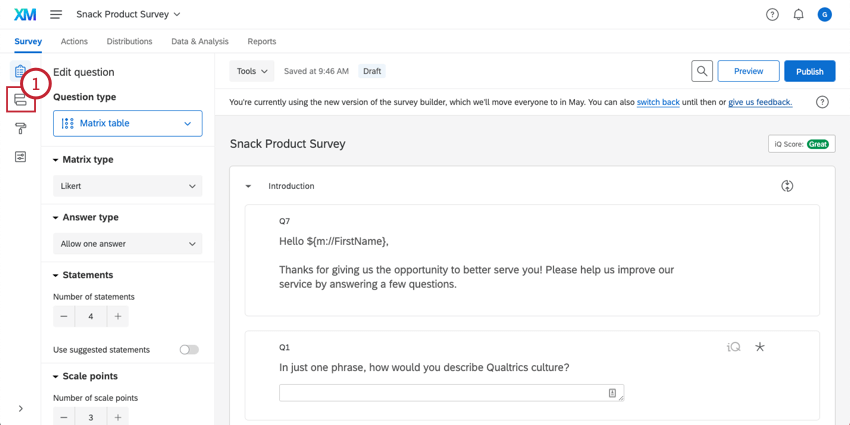
- Click Add a New Element Here.
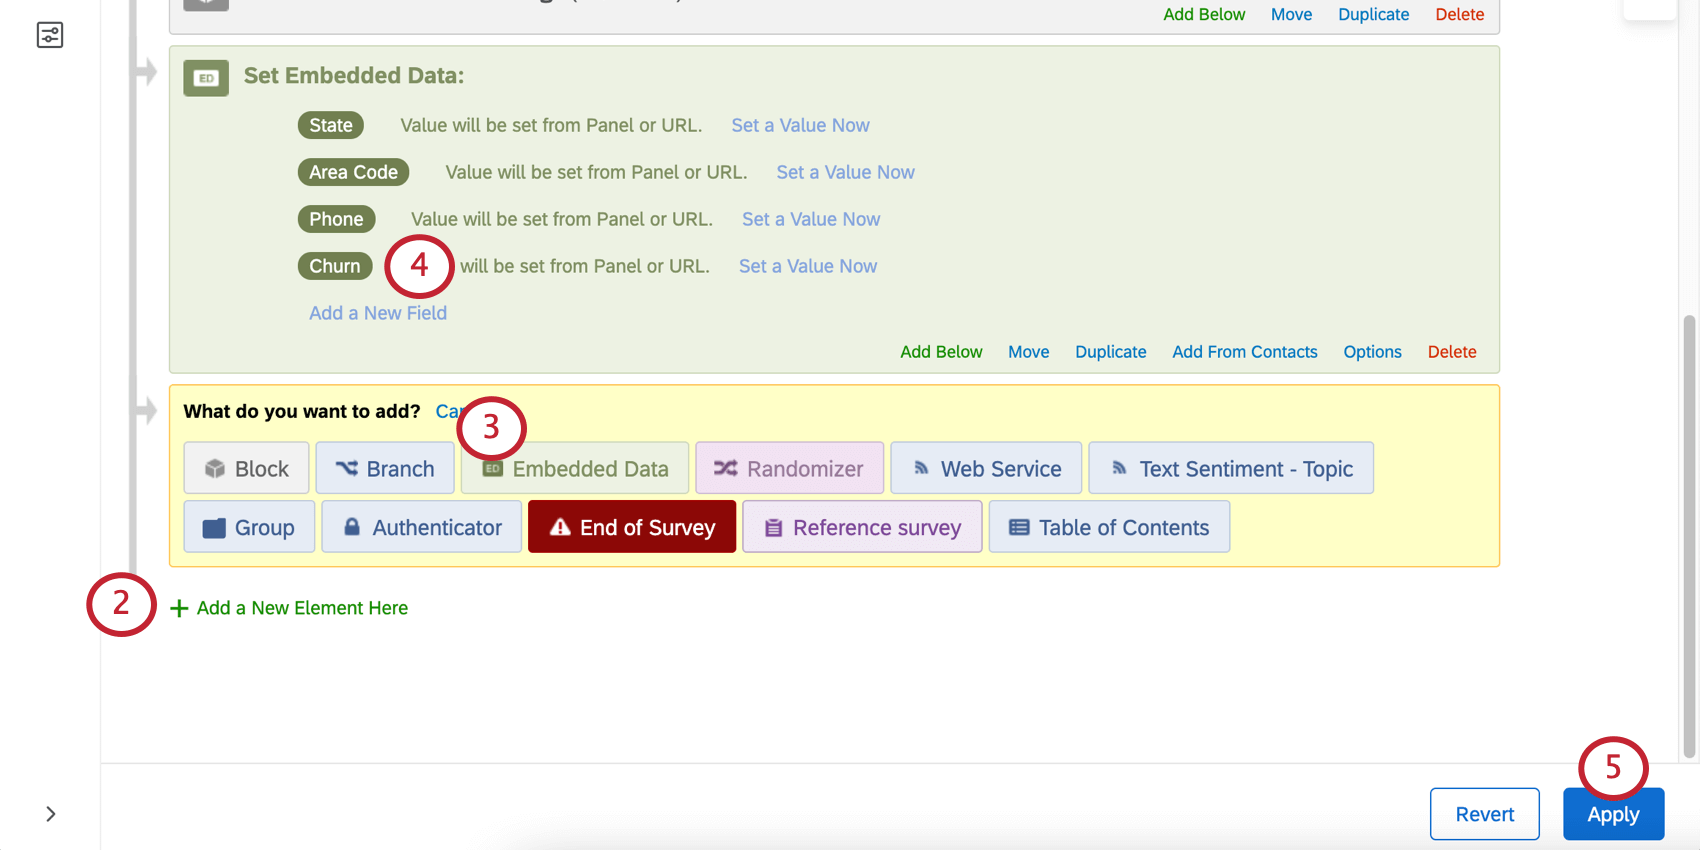
- Select Embedded Data.
- It will ask you to enter a field name. You can enter whatever field name you like. Here, we chose the straightforward Churn.
- Click Apply.
- You may also want to repeat this same process for other data that you’d like to bring in, particularly operational data that might be useful in predicting churn (e.g., Tenure or Number of Purchases).
Recording Data
Once you have a churn variable, you can import historical data into your survey, including a column for Churn where you indicate with Yes or No whether the customer churned.
Creating a Churn Prediction Model
Once your churn variable is set up and you have enough data, you are ready to open Predict iQ.
- Inside your survey, click Data & Analysis.
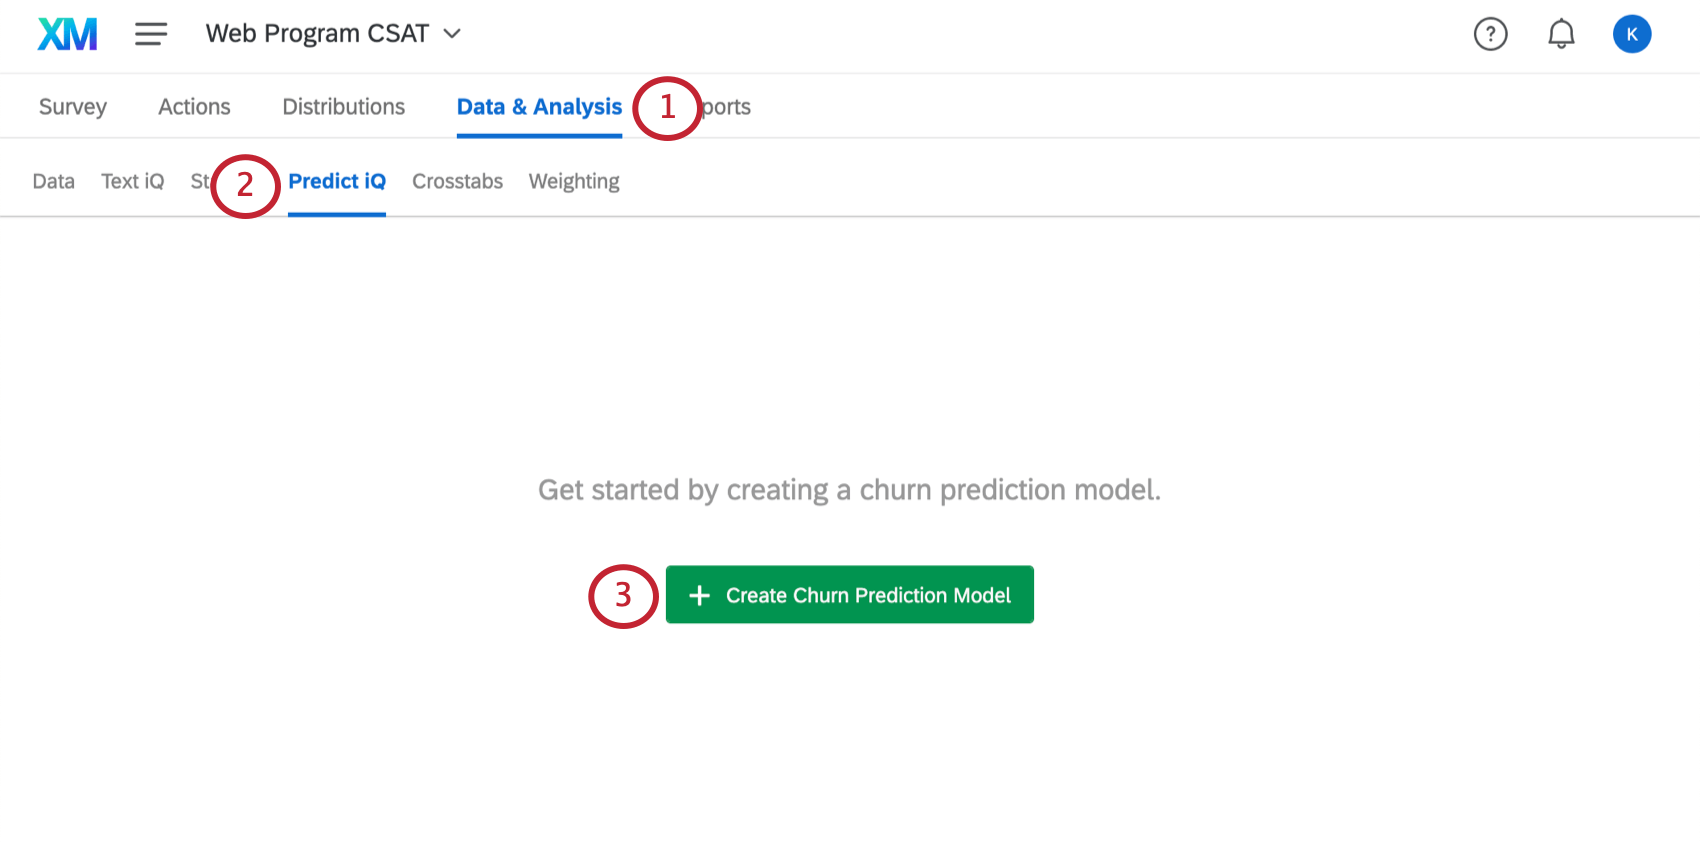
- Select Predict iQ.
- Click Create Churn Prediction Model.
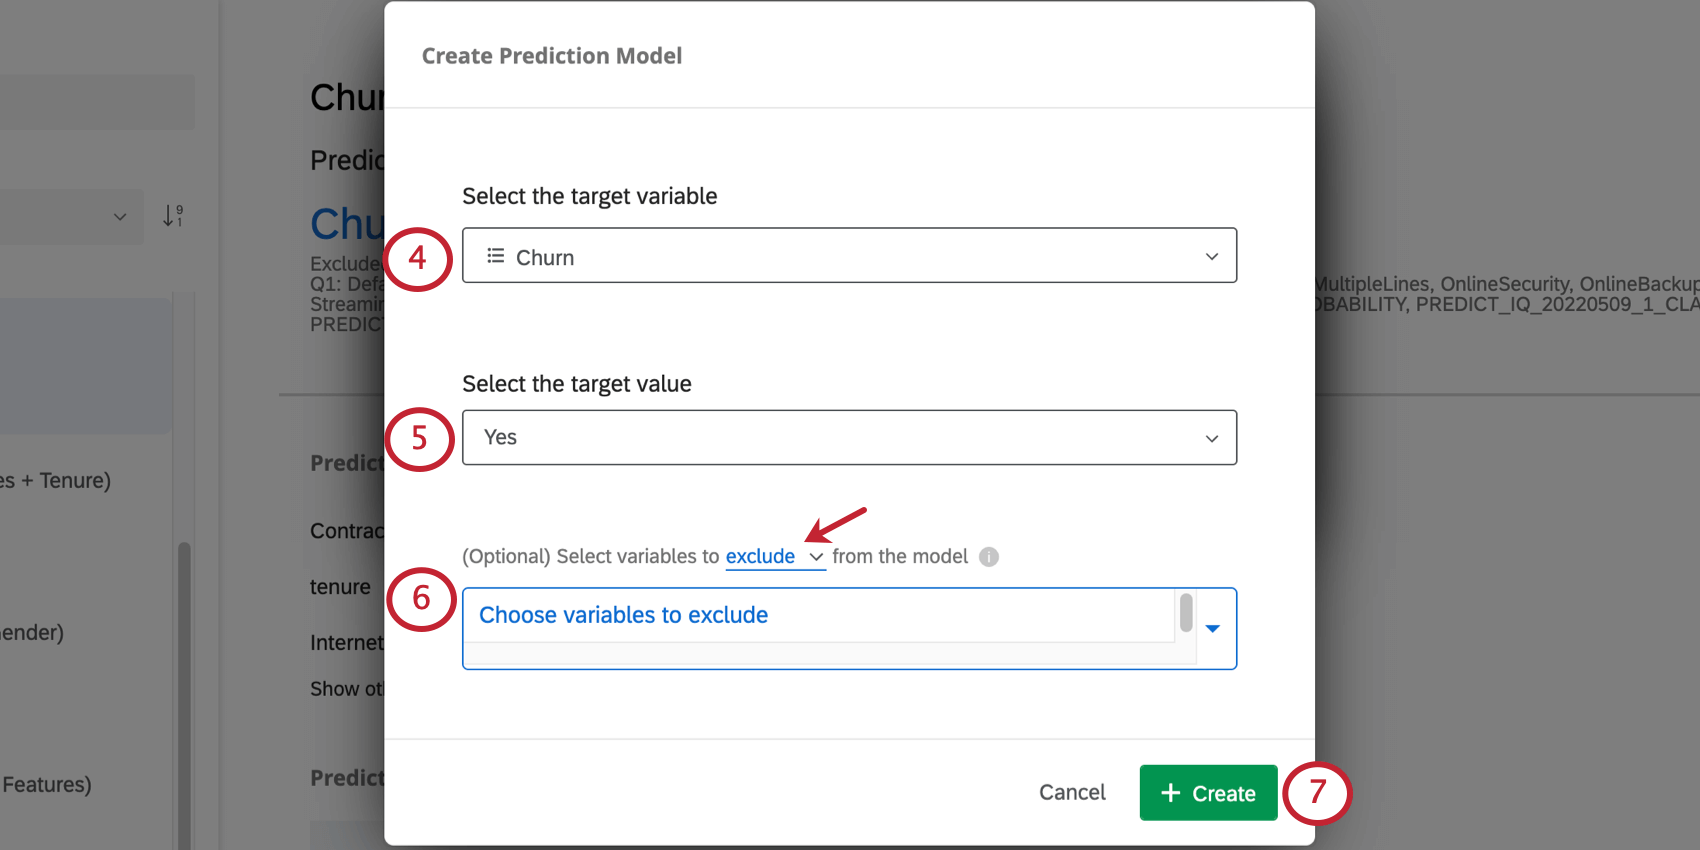
- Select the variable you made in the previous section. In this example, it’s called Churn.
 Qtip: Predict iQ only predicts outcomes that have 2 possible choices, such as Yes/No or True/False. It does not predict numeric outcomes (e.g., a 1-7 scale) or categorical outcomes with more than 2 values (e.g., Yes/Maybe/No).
 - Select the value that indicates the customer churned.
Example: Because in this example our variable is named Churn, someone with Churn equal to Yes has churned. But let’s say you named your variable Staying with our company instead. Then No would indicate that the person was not staying with the company, and has churned.
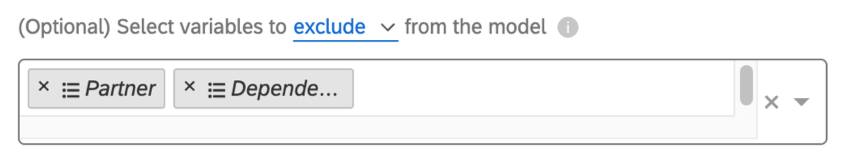
- Select variables to either exclude from the model or include with the model. Click exclude/include to switch between the 2.
- Exclude: For example, if you have a variable measuring “Reason for Churn” in your historical data, you might want to exclude that from the analysis, since it won’t be available for new respondents when the prediction is being made.
Qtip: You can exclude multiple variables. Click the X next to a variable to remove it from the list of excluded variables.
- Include: Select variables to include in the model; all others will be ignored.
- Exclude: For example, if you have a variable measuring “Reason for Churn” in your historical data, you might want to exclude that from the analysis, since it won’t be available for new respondents when the prediction is being made.
- Click Create.
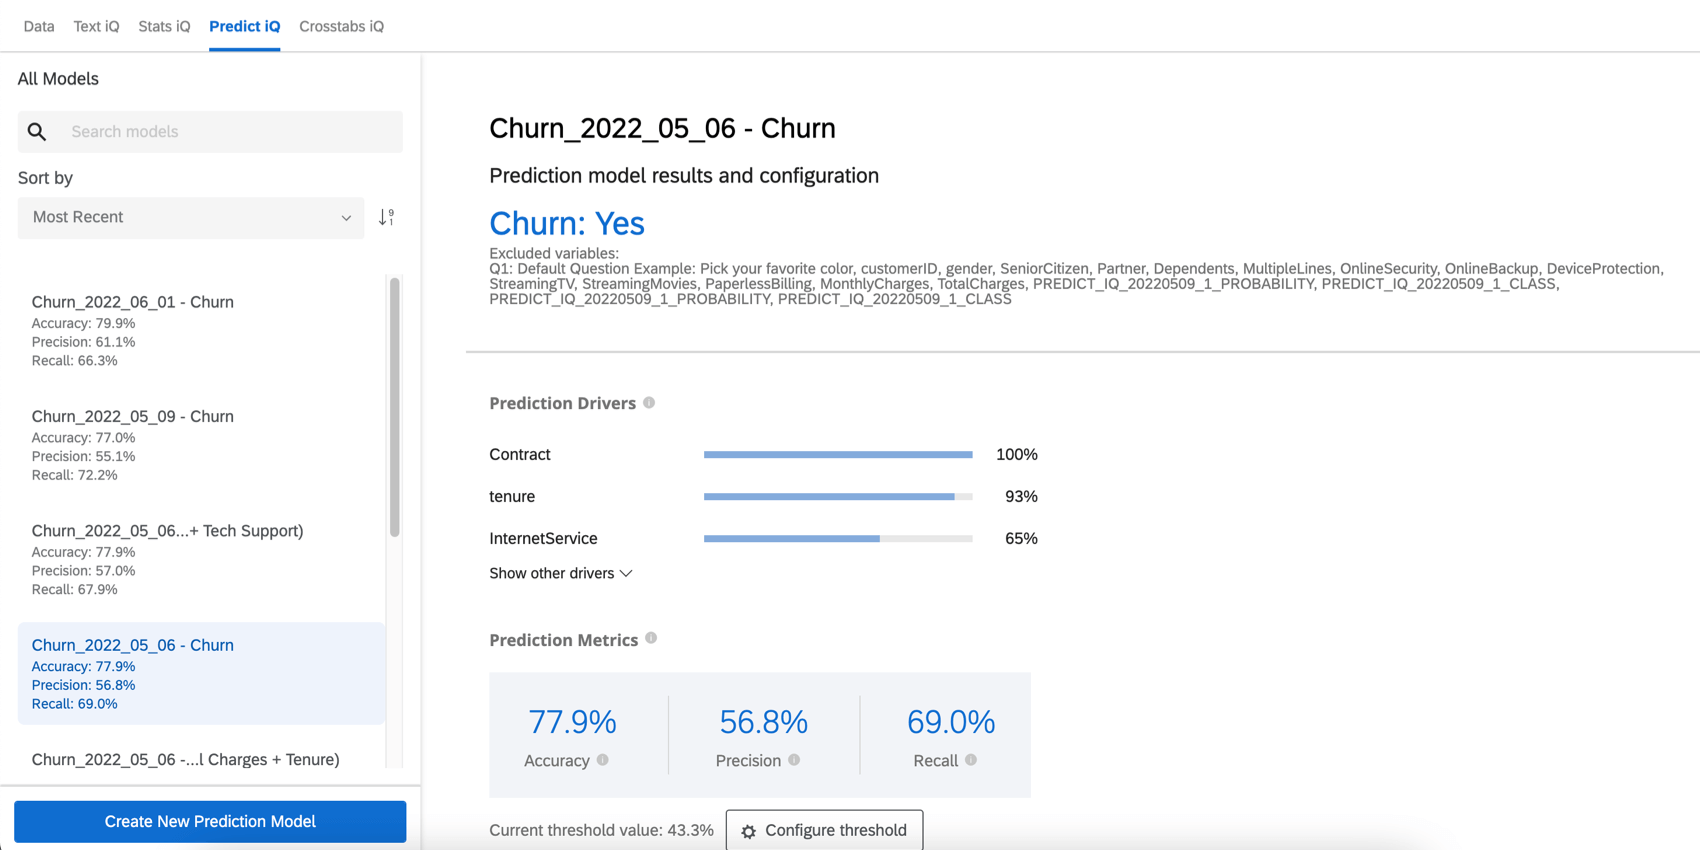
Once your prediction model is complete, the Predict iQ page will be replaced with information on the churn prediction model you just created.
How is your dataset split for model training?
In the process of training your model, your dataset is split into training, validation and test data. 80% of your data is used for training. 10% of your data is used for validation, and 10% of your data is used for testing.
Variable Information
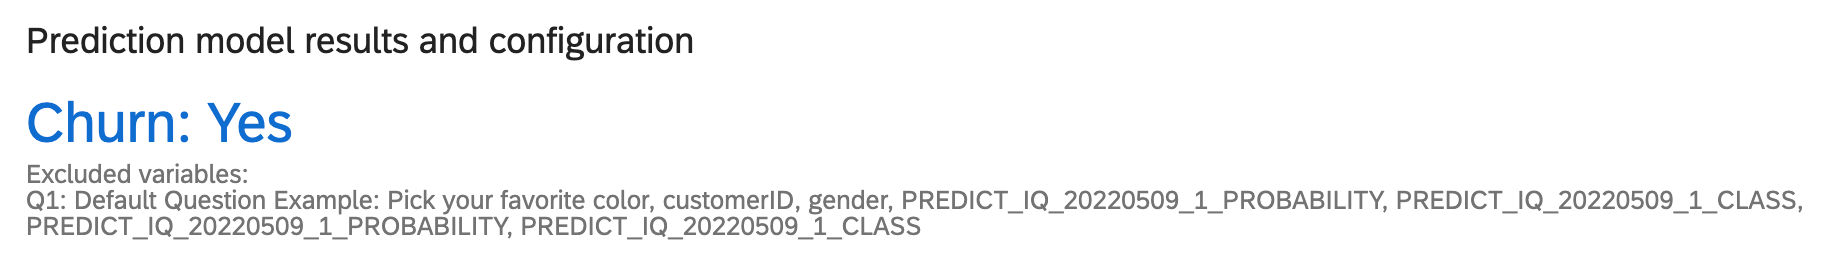
The Prediction model results and configuration section gives the name of your Churn embedded data variable and the value that indicates a customer is likely to churn. This section also lists your excluded variables.
Prediction Drivers
The prediction drivers are the variables that were analyzed in order to create your prediction model, ordered by their importance in predicting churn. This includes any variable that wasn’t excluded from the analysis. In the example below, NPS scores and Reliability ratings drive the churn prediction.
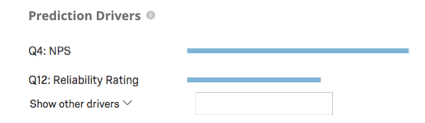
Click Show other drivers to expand the list.
Qtip: To create this chart, each variable is run in a simple logistic regression against the churn variable. The highest r-squared value is set to 1, and the other variables’ values are scaled accordingly. For example, if the highest r-squared is 0.5, then each variable’s bar length will be r-squared * 2, where the bar length is 1.
The chart is therefore an indicator of the relative strength of the variables in predicting churn, and is not multivariate in nature. A rating of each variable’s impact on a deep learning algorithm-based model’s output is an area of active academic research, with no accepted best practice at this point.
Prediction Metrics
Predict iQ “holds out” (sets aside) 10% of the data before creating the model. After the model is created, it creates predictions for that 10%. It then compares its predictions to what actually happened, whether those customers indeed churned. Those results are used to power the below accuracy metrics. Note that while this is an effective best-practice method for estimating the model’s accuracy, it is not a guarantee of the future accuracy of the model.
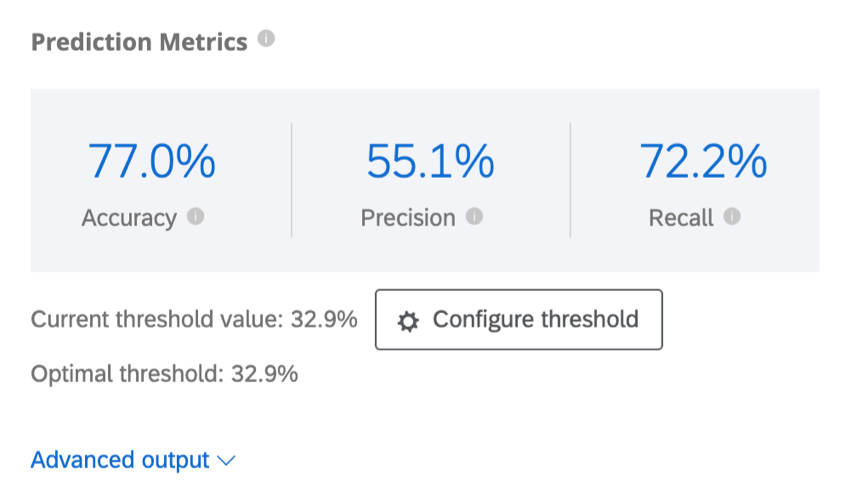
- Accuracy: The proportion of the model’s predictions that will be accurate.
- Precision: The proportion of customers predicted to churn who will actually churn.
- Recall: The proportion of those who actually churned that the model predicted ahead of time would do so.
Predict iQ will calculate the optimal threshold value by maximizing the F1-score. Your model will be set to the optimal threshold by default, but you can adjust this; see Configure Threshold below.
Click Advanced output below the Predictive Metrics table to reveal the Confusion Matrix and Advanced Prediction Metrics tables.
Precision and Recall
Precision and recall are the most important prediction metrics. They have an inverse relationship, and so you often have to think about the trade-off between knowing exactly which customers will churn and knowing that you’ve identified all or most of the customers likely to churn.
Configure Threshold
Click Configure threshold to set a threshold for when a customer should be labeled as likely to churn. This threshold percentage is the individual likelihood to churn.
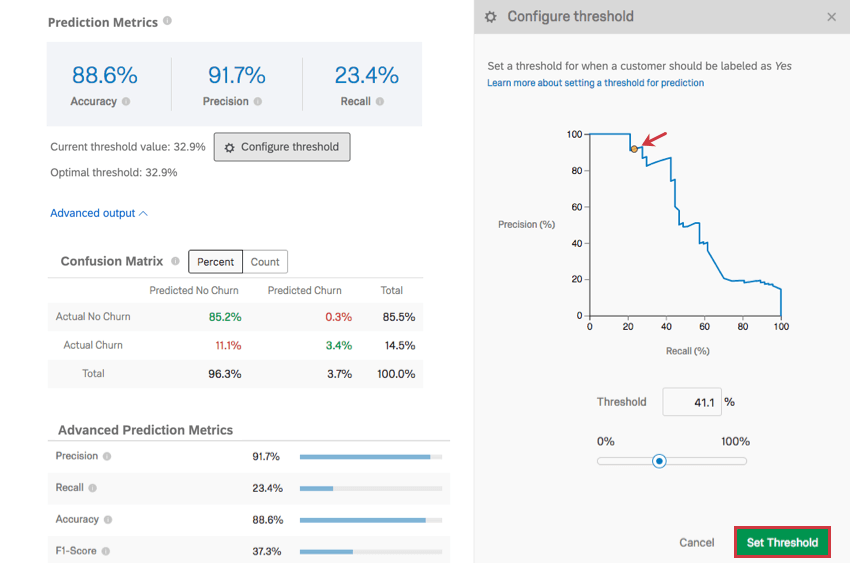
Click and drag the dot on the graph to adjust the threshold, or type a threshold % and observe how the graph changes. When you’re finished, click Set Threshold to save your changes. You can also cancel changes by clicking Cancel on the lower-right or the X on the upper-right.
Adjusting the threshold adjusts the precision along the y-axis and the recall along the x-axis. These metrics have an inverse relationship. The more precise your measurements are, the lower the recall, and vice versa.
Confusion Matrix
When Predict iQ builds a prediction model, it “holds out” (or sets aside) 10% of the data. To check the accuracy of the model generated, the data from the new model is run against the 10% holdout. This serves as a comparison of what is predicted and what “actually happened.”
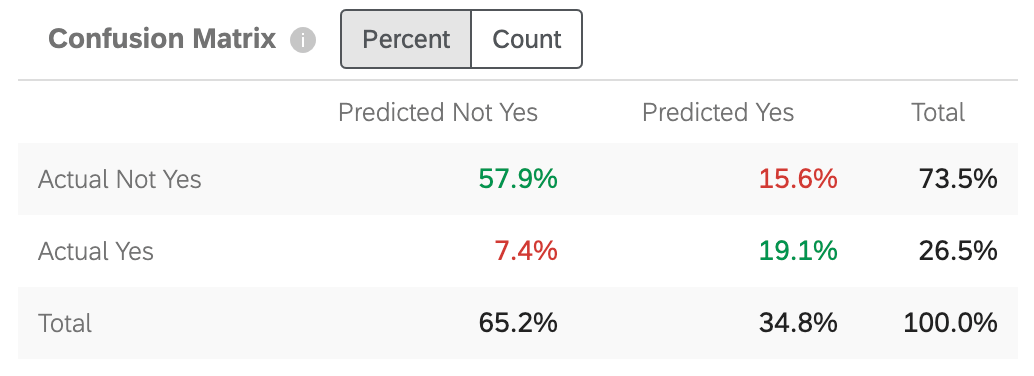
“Yes” in this chart will be replaced with whatever you indicated your target value in step 5 of the setup.
- Actual Not Yes / Predicted Not Yes: The percentage of customers the model predicted wouldn’t churn, who actually did not churn.
- Actual Yes / Predicted Not Yes: The percentage of customers the model predicted wouldn’t churn, who conversely did churn.
- Actual Not Yes / Predicted Yes: The percentage of customers the model predicted would churn, who conversely did not churn.
- Actual Yes / Predicted Yes: The percentage of customers the model predicted would churn, who actually did churn.
Numbers are green to to indicate that you want those numbers to be as high as possible, as they reflect correct guesses. Numbers are red to indicate that you want these numbers to be low, as they reflect incorrect guesses.
You can adjust the matrix to display either Percent or Count. This count includes the 10% of your data held out, not the full dataset.
Advanced Prediction Metrics
This table displays additional prediction metrics.
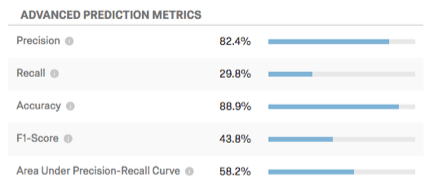
- Precision: The proportion of customers predicted to churn who will actually churn.
- Recall: The proportion of those who actually churned that the model predicted ahead of time would do so.
- Accuracy: The proportion of the model’s predictions that will be accurate.
- F1-Score: The F1 Score is used to select a threshold that balances precision with recall. A higher F1 score is generally better, though the correct place to set the threshold should be determined by your business goals.
- Area Under Precision-Recall Curve: The Precision-Recall curve is the curve you observe on the graph when you click Configure threshold. The total area under the curve is a measure of the overall accuracy of the model (regardless of where you set the threshold). An area under the curve of 50% is equal to random chance; 100% is perfectly accurate.
Make Predictions
Batch Predict (CSV)
In addition to analyzing the responses you’ve collected in your survey, you can also upload a specific data file that you want Predict iQ to assess.
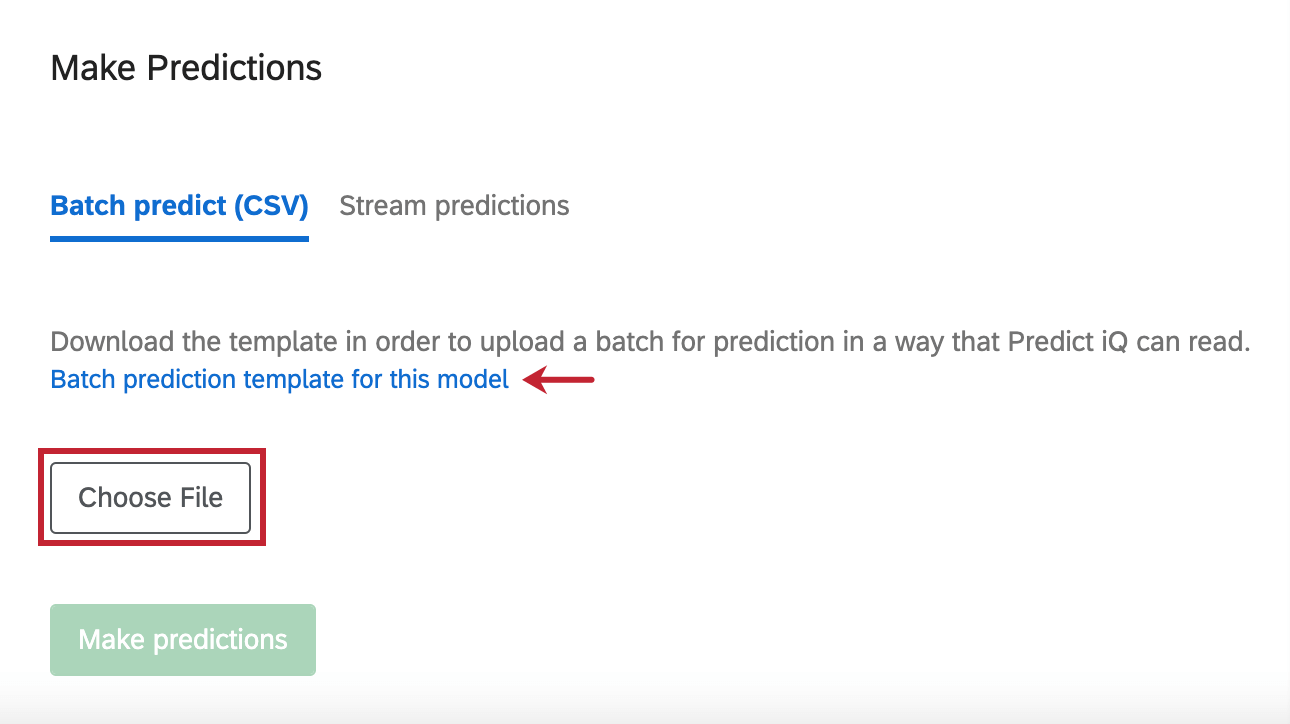
To get a template the file, click Batch prediction template for this model.
When you have finished editing your file in Excel and are ready to re-upload it, click Choose File to select the file. Then click Make predictions to start the analysis.
Stream Predictions
Stream predictions update as data comes into the survey. In this section, you can decide when these prediction updates take place.
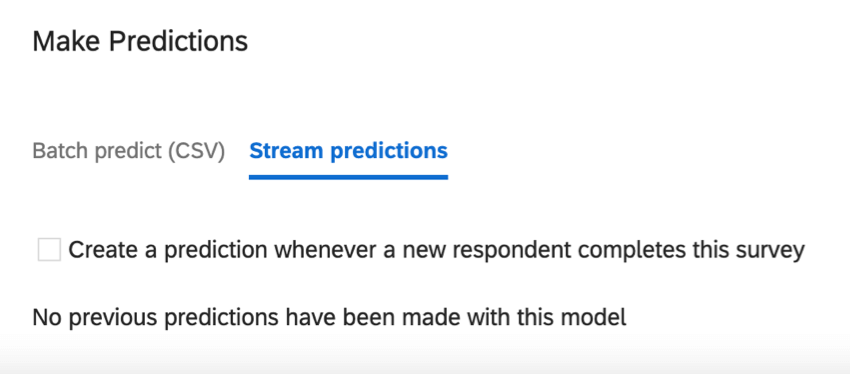
Create a prediction whenever a new respondent completes this survey: This setting enables real-time predictions. You will have 2 more columns in your data: Churn Probability, the likelihood to churn in a decimal format; and Churn Prediction, a Yes/No variable. The Churn Prediction is based on the threshold configured.
Managing Models
Along the left of the page, you’ll see a menu where you can scroll through and select prediction models you created in the past.
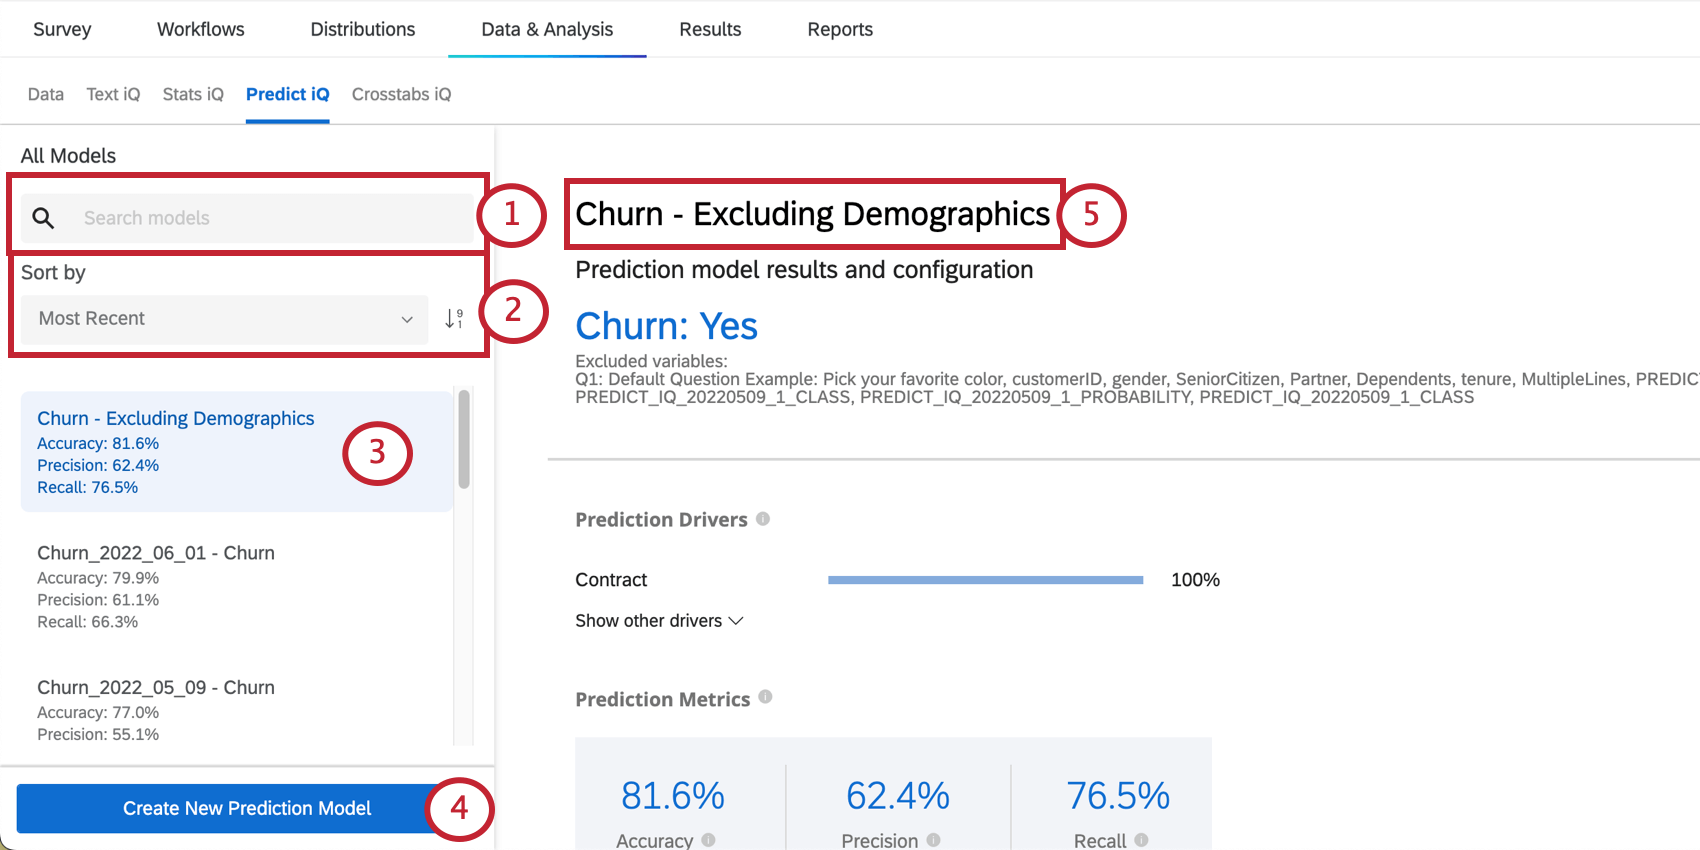
- Search by model name.
- Sort your list of models. Click the dropdown to choose what you’d like to sort by, and use the arrow next to the dropdown to adjust whether you’re sorting by descending or ascending order.
- Select the model you want to view.
- Create a new prediction model.
- Once you have selected a model from the left, you can click on its name along the top of the page to edit the name.
Churn Data
In the Data section of the Data & Analysis tab, you can export your data as a convenient spreadsheet. After your prediction model has loaded, you will have additional columns for churn data on this page.
![]()
- Churn Probability: The likelihood to churn in a decimal format. Appears when stream prediction has been enabled and is based off the threshold set. If you don’t see the column Churn Probability, you can also look for a data column named “[selected churn field]_PROBABILITY_PREDICT_IQ”.
- Churn Prediction: A Yes/No variable confirming or denying Churn based on the threshold set. Appears when stream prediction has been enabled. If you don’t see the column Churn Prediction, you can also look for a data column named “[selected churn field]_CLASS_PREDICT_IQ”.
Column names will also include the date the model was trained in MMDDYYYY format. For example, January 14, 2022 would be represented in the column name as 01142022.
Note that churn probabilities and predictions are only applied to new survey results. Previously existing responses will not have churn probabilities and predications added to them.
Automatic Data Cleaning
When training the model, Predict iQ will automatically ignore certain types of variables that will not be useful for predictions, while automatically transforming other variables.
High Cardinality Variables
If a variable has more than 50 unique values or more than 20% of the recorded values are unique, it will be ignored during model training. Variables with too many unique values are not good feature columns for predictions.
Missing Values for Numeric Columns
For numeric variables that are included in the model, missing values are always imputed to be 0 (zero).
One-Hot Encoding of Categoricals
Categorical variables will be one-hot encoded if the variable is not recoded or the variable does not have an ordinal relationship for its categories.
Qtip: Predict iQ carries over the same variable settings used in Stats iQ.
Invariant Variables
Any variable that has no variance in its recorded values will be ignored for model training. This means that if you have a variable that only has a single unique value, it will not be part of the model. Variables that are useful for prediction will strike a good balance between having too few unique values and having too many unique values. See “High Cardinality Variables” above.
Projects Where You Can Use Predict iQ
Predict iQ isn’t included with every license. However, if you have this feature, it can be access in a few different types of projects:
Predict iQ can also appear in Engagement and Lifecycle projects, but based on the nature of the data usually collected by these project types, the dataset would not necessarily be best for Predict iQ.
While Predict iQ appears in Conjoint and MaxDiff, we do not recommend using them together. Conjoint and MaxDiff-specific content is not compatible with Predict iQ, so you can only analyze demographic data.
No other project types are supported.