-

Qualtrics Platform -

Customer Journey Optimizer -

XM Discover -

Qualtrics Social Connect
Text iQ Best Practices
About Text iQ Best Practices
When performing text analysis, there are steps to take before, during, and after data collection to ensure your analysis is comprehensive. This page contains best practices on how to collect and interpret Text iQ data in Qualtrics.
Designing a Survey for Text iQ
When collecting data to perform text analysis, it’s important to get your survey design right. The tips in this section will help you build your survey to capture consistently high quality text data.
- When designing a text entry question, consider how long you want the response to be, and choose the corresponding question variation. For example, if you want a long response from a respondent, select the essay variation. If you only want a single sentence answer, choose the single line variation.
- Avoid using the force response on text entry questions. Not every respondent has something to say, so if required to provide a text response they often will simply add “N/A”, “Nope”, “No”, etc., which doesn’t provide value to your dataset.
- Do not ask multiple questions in a single text entry question. For example, “What did you like? What did you not like?” should be split up into 2 separate questions for an easier, more accurate analysis.
- Prevent survey fatigue by limiting the number of text entry questions in your survey. Text entry questions can require a lot of respondent effort. The more text entry questions you have in a survey, the more likely a respondent is to exit the survey.
- Consider utilizing Text iQ-powered survey flows where you can perform text and sentiment analysis in real-time as the respondent takes the survey. With this, you can dynamically ask follow-up questions in-survey using branch logic and display logic or even trigger a Qualtrics ticket based on the text entry response.
Creating Text Topics
Overall, designing topics in Text iQ is an iterative process. As more responses are collected, you may need to alter existing topic queries or create new ones to capture appropriate comments. However, as time goes on and your queries become more refined, less work is required to maintain them going forward.
When designing your topics in Text iQ, there are 3 approaches you can take: top-down, bottom-up, and automatic. These approaches are not mutually exclusive, so consider using a combination of all of them when developing your topics.
- Top-Down: In this approach, you start building topics based on what you think you’ll see in responses. This can be accomplished through both building queries on what you expect to see in responses and using the starter packs, which include topics with pre-built queries developed by Qualtrics subject-matter experts and are specific to different industries. If the starter packs don’t fit with your industry perfectly, you can pick and choose specific topics from different starter packs to include in your analysis.
- Bottom-Up: In this approach, instead of creating topics right away, read through responses to get an understanding of trends and build topics to fit those trends through building queries that will capture the appropriate responses.
- Automatic: In this approach, you rely on Qualtrics to inform topic creation. As responses are collected, Qualtrics will analyze your responses to help guide what topics to create. Qualtrics can also recommend topics to you based on your responses.
After you’ve designed your topics, consider grouping similar concepts together using topic hierarchies. This is especially helpful when you have a more complicated topic model. For every topic, Text iQ will analyze topic level sentiment, providing a more nuanced understanding of your text responses.
While not every comment requires a topic, if you notice a group of comments doesn’t fit into an existing topic, create a new topic to capture those responses. Alternatively, if comments aren’t being tagged with an existing topic when they should be, alter the query to include keywords that may have been missed before to capture the new responses. You can view untagged comments by clicking on the Comments without a Topic bar.
Gaining Insights from Text iQ Data
Once you’ve developed your topics, you can start performing analysis to gain insights and take action. And when performing analysis on Text iQ data, remember that Text iQ is the most powerful in aggregate. While sentiment may not be 100% accurate for every survey response due to subtle nuances in comments, aggregate data can provide meaningful insights to improve your program. More information about sentiment analysis can be found on the Sentiment Analysis support page.
Widgets in Text iQ
Text iQ contains a few widgets to get you started with your analysis. This includes a bubble chart to explore topic sentiment, topic and sentiment change widgets to show how topics and sentiment has changed over time, and a word cloud widget to visualize keywords. See Widgets in Text iQ for more information.
Analysis in Dashboards
Analyze your Text iQ data in CX and EX dashboards to reveal insights for your organization to take action and improve experiences. While each dashboard configuration and Text iQ data is different, the resources below provide general information to get you started.
- Text iQ in CX Dashboards: An introductory page on using Text iQ data in a CX dashboard.
- Text iQ (EX): An introductory page on using Text iQ data in an EX project.
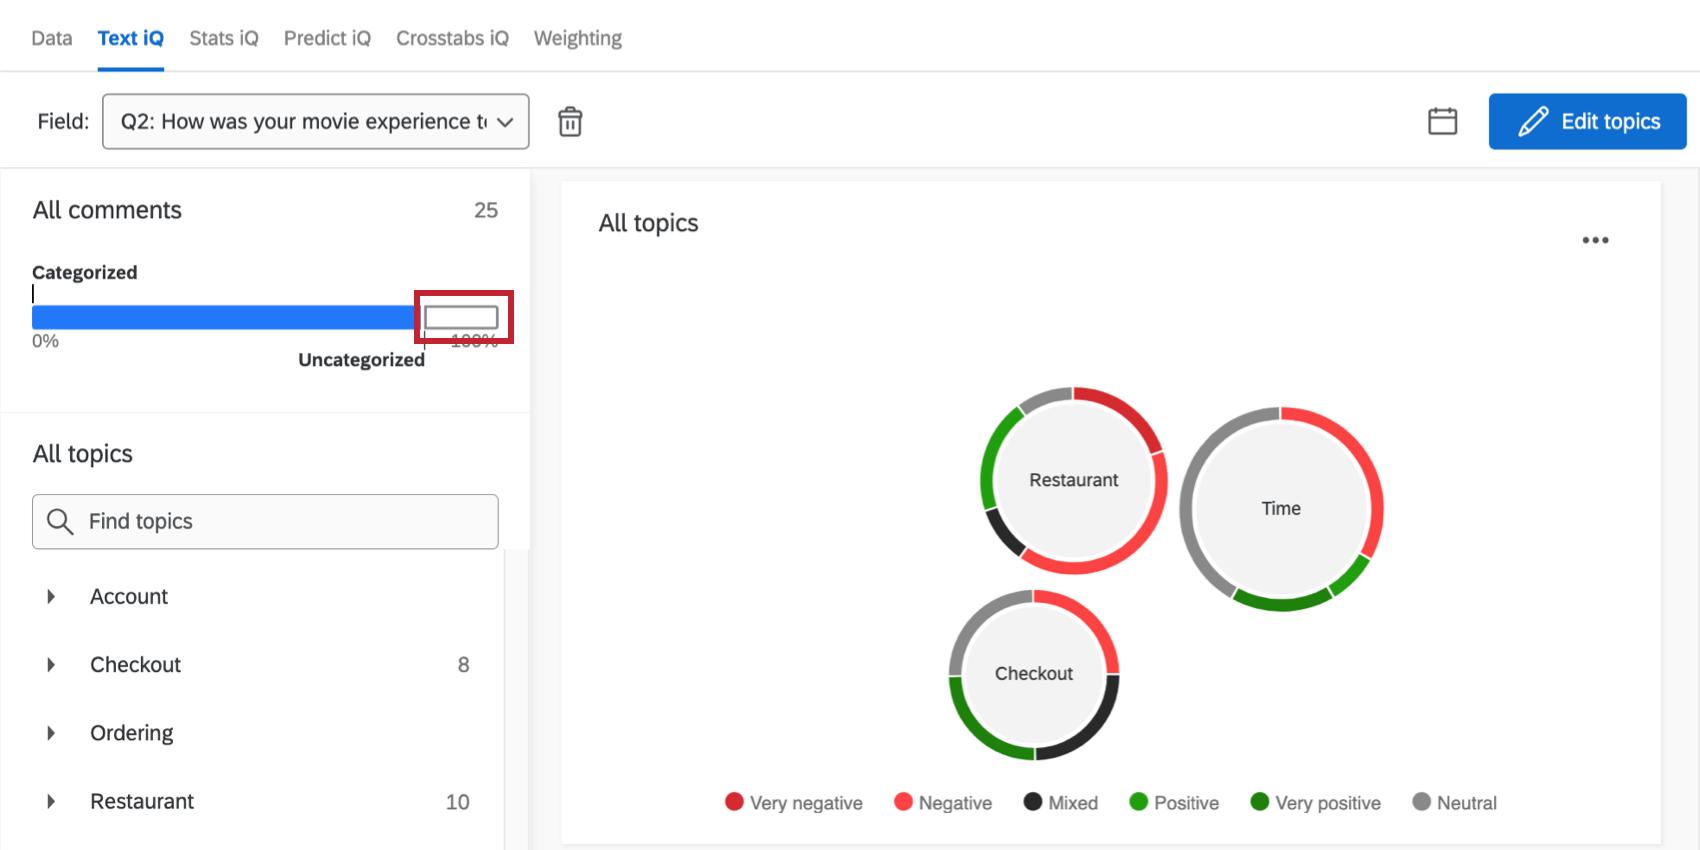
- Text iQ bubble chart widget (CX + EX): The Text iQ bubble chart widget is helpful in understanding which topics contain the most comments as well as overall topic sentiment. The size of the bubble indicates the number of comments attached to the topic and the rings around the bubbles break out the topic sentiment.
- Text iQ table widget (CX): The Text iQ table widget allows you to report on key topics metrics such as topic count, topic sentiment, and relative importance for each of your text topics in an easy-to-read format in addition to insightful trends such as topic count change, sentiment change.
- Key drivers widget (CX + EX): The key drivers widget allows you to see the correlation between 1 outcome metric and 1 or more potential drivers. For example, the outcome metric could be Overall Satisfaction with potential drivers of different Topic Sentiment Scores.
- Response ticker widget (CX + EX): the response ticker widget displays individual response information in a scrolling list and can feature the response’s corresponding sentiment score in the widget to provide additional context.
- Word cloud widget (CX + EX): in the word cloud widget, more frequently used words appear larger than less frequently used words. This can be helpful in understanding keywords that appear in comments.
Using Filtering for Analysis
Dashboard filters (CX | EX) allow you to dive into your data to find trends that you would not be able to see with the data in aggregate alone. 2 useful Text iQ filters are the Topic filter and the Topic Sentiment Label filter. These filters, along with the widgets mentioned above, help to drive insights in open text data, detailed in depth below.
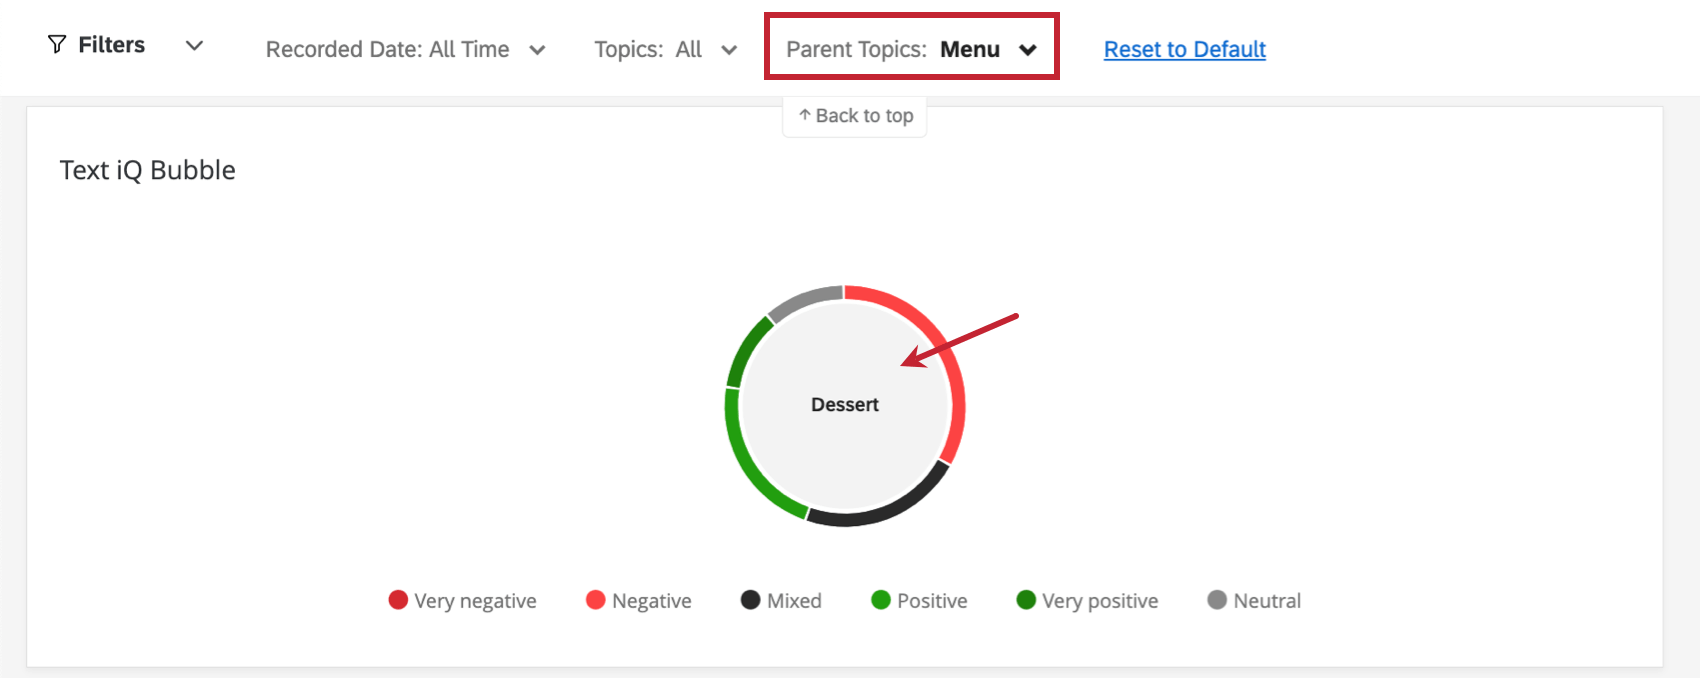
Use the bubble chart widget to understand which topics contain the most comments and which are the most positive and negative. Click on a specific bubble to add a page filter for that topic. Alternatively, use the Topic Sentiment Label filter to only show comments tagged as very negative, negative, positive, very positive, neutral or mixed for a specific topic in question.
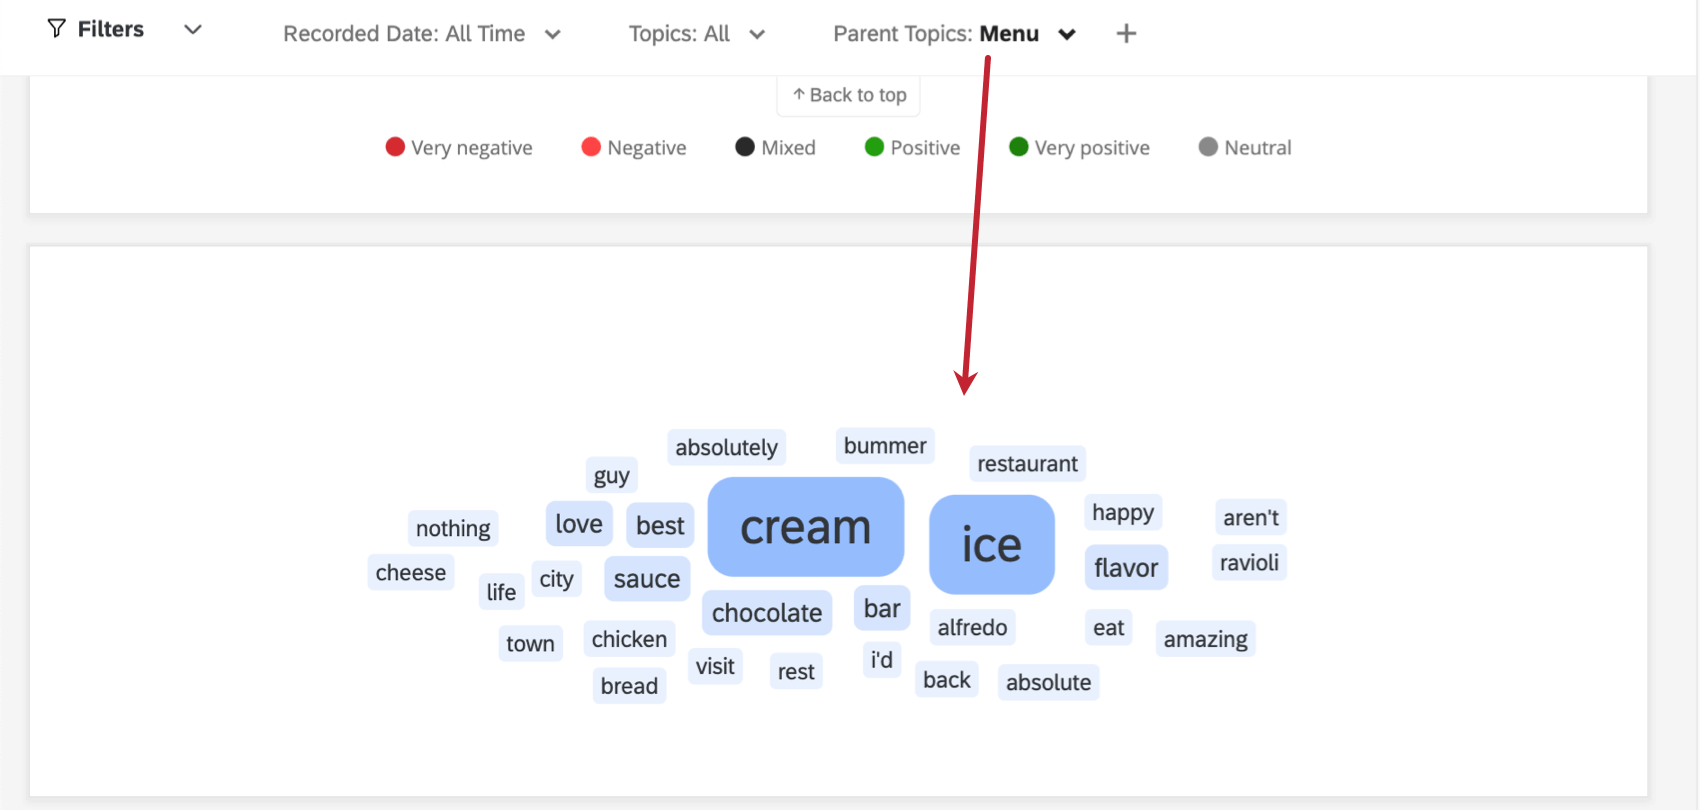
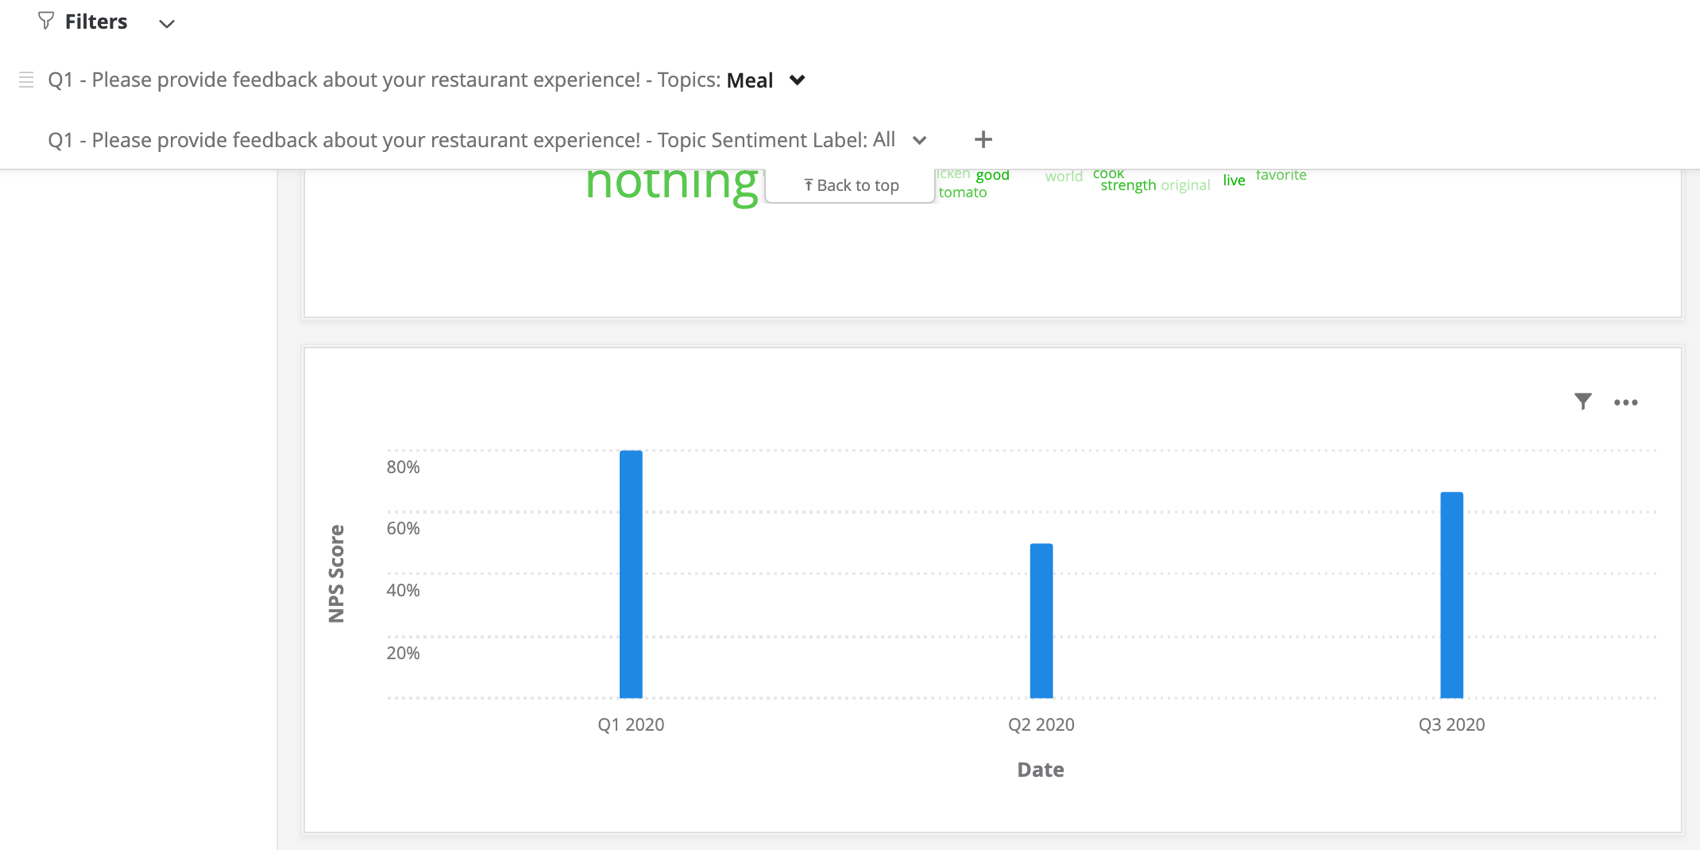
Once filtered to a relevant topic or topic sentiment label, review your word cloud widget to see what words appear most frequently in relation to the filter. Below, the word cloud is filtered to show the Menu topic.
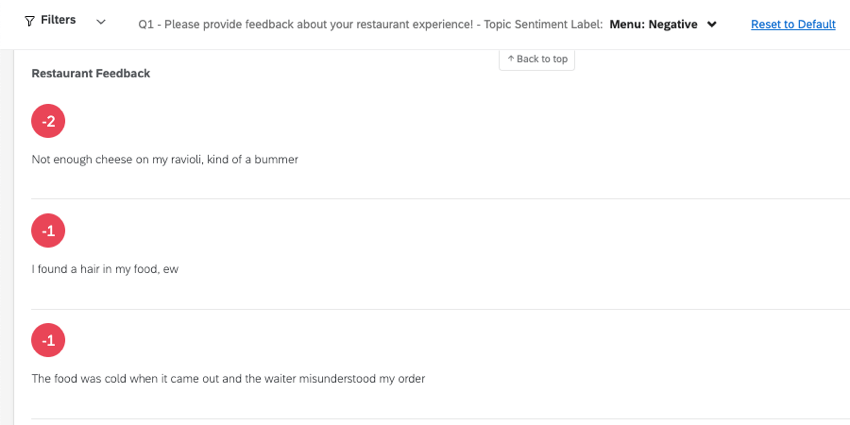
Additionally, review the response ticker widget to read through individual responses and to see what specific concerns should be addressed. For example, the below response ticker widget displays only negative responses for Menu.
Identifying Trends in Text iQ Data
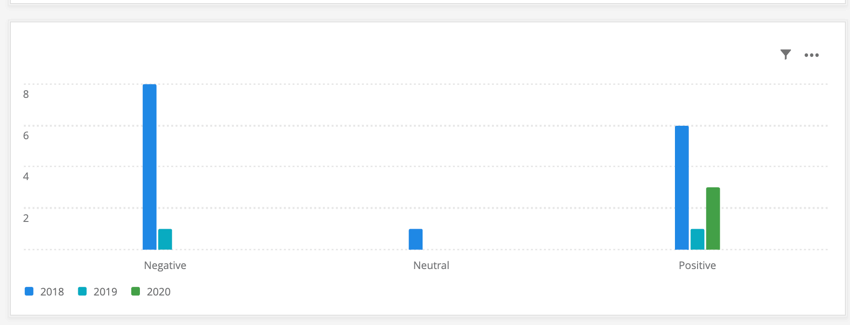
Viewing trends with Text iQ data helps in identifying where you’ve improved and what could use more attention. In addition to the Text iQ table widget (CX), the simple chart widget (CX & EX) is useful in visualizing trends. 2 examples of trends with the Simple Chart widget can be seen below:
Dashboard Notifications with Text iQ
Dashboard notifications can alert you when there’s a significant change in your dashboard metrics, allowing you and your team to action these changes accordingly. Trending detection notifications specifically are meant to track popularity trends in Text iQ topics. If certain topics come up again and again in open-ended feedback, this notification can alert you of those changes.
Analysis in Stats iQ
You can analyze your Text iQ data in Stats iQ. This is useful for correlating your text data to other quantitative data. See Analyzing Text iQ in Stats iQ for more information.