-

Qualtrics Platform -

Customer Journey Optimizer -

XM Discover -

Qualtrics Social Connect
Inserting Advanced-Reports Content
About Inserting Advanced-Reports Content
The Insert button on the reports toolbar allows you to add content to your reports, including visualizations, page breaks, headers and footers.
Visualizations
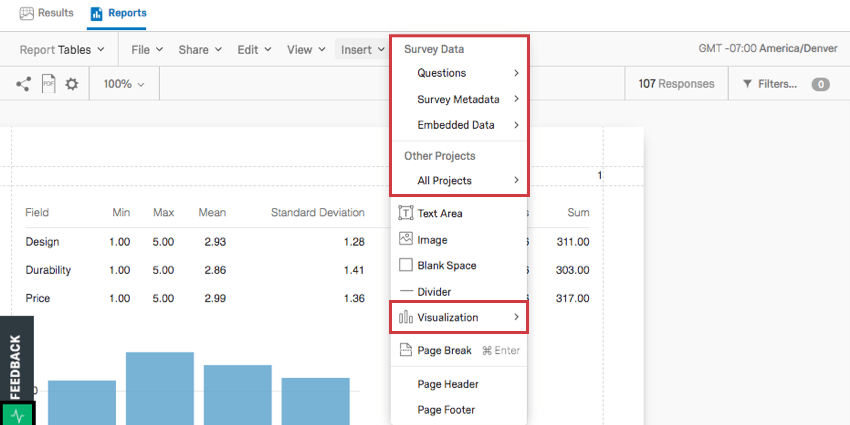
You can use the Insert button to insert visualizations into your report. See our support page on Adding and Removing Visualizations for further instruction.
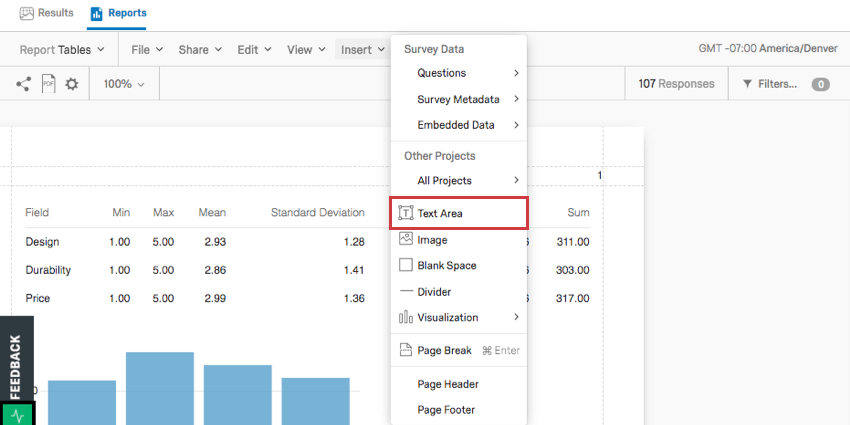
Text Areas
Click Insert then Text Area to add a Text Area to your report. This feature is useful if you want to add special headers, informational paragraphs, or other text to your report.
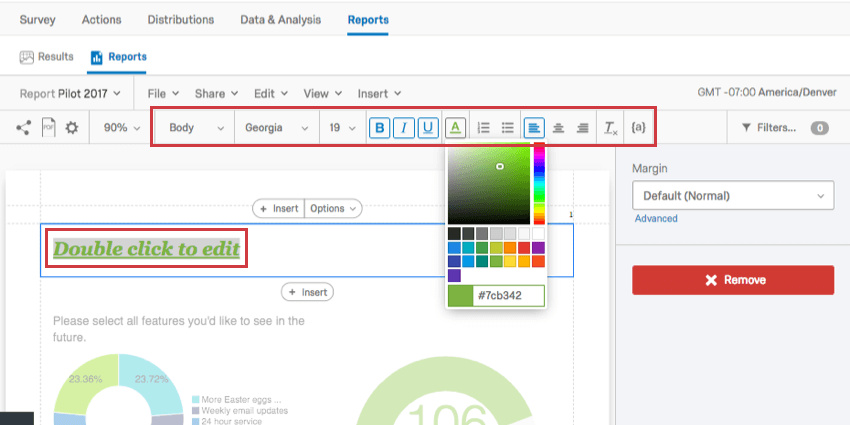
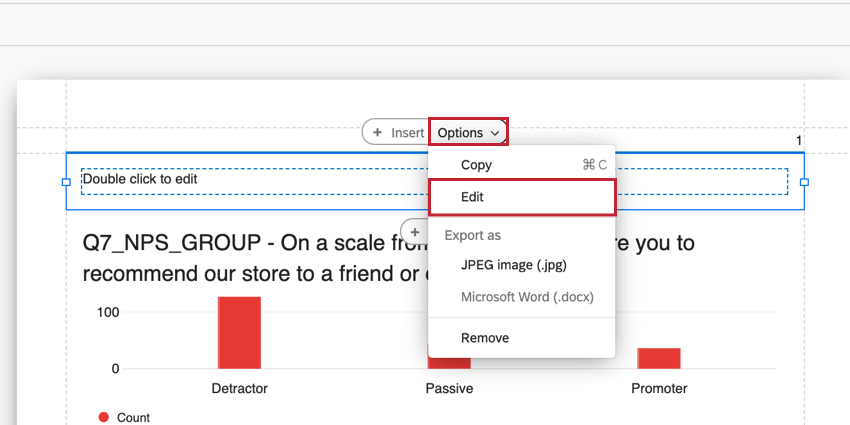
Once your Text Area is created, double-click the text to start editing. A Rich Content Editor will appear above to help you change font styles and formatting.
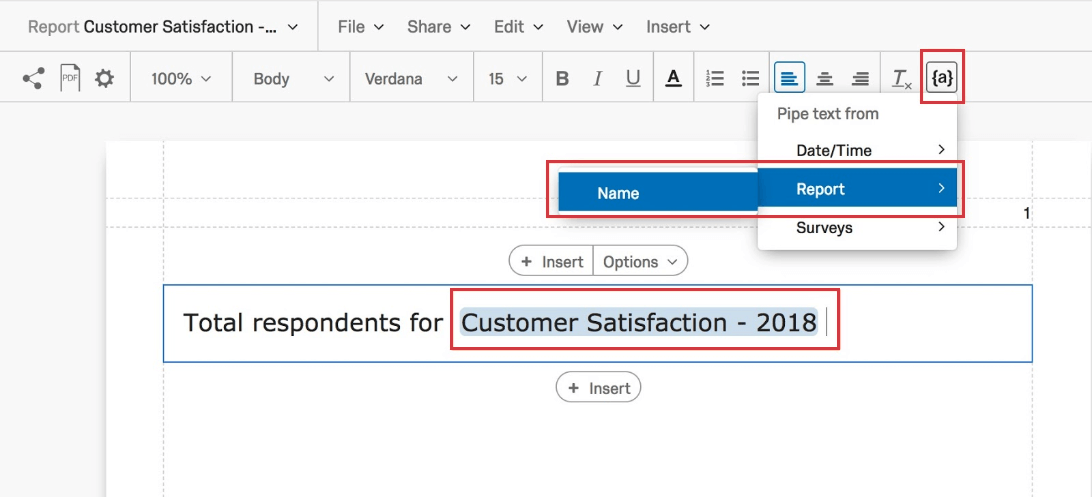
Piped Text
Piped Text reduces repeatable reporting tasks such as inserting question text or total number of respondents directly from the source project. Instead of inserting elements that otherwise need to be re-inserted or updated every reporting cycle into a new report, the report creator can easily insert a variable to represent the data and then use the variable in place of the element in the report.
Images
You can add images throughout your report.
Adding Images
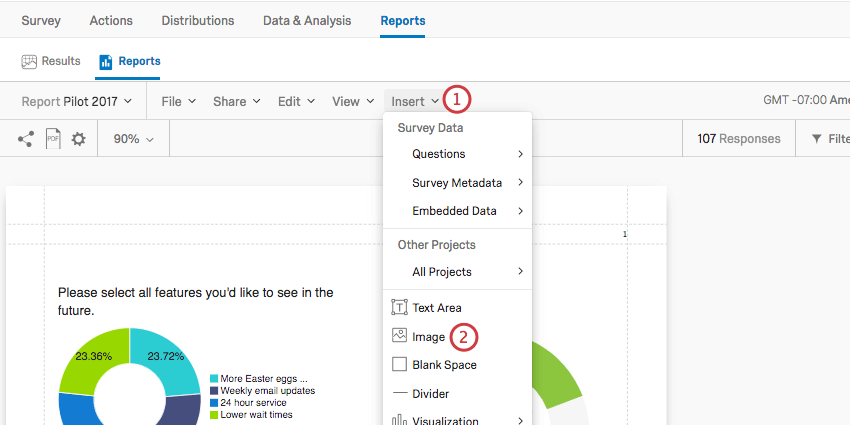
- Click Insert.
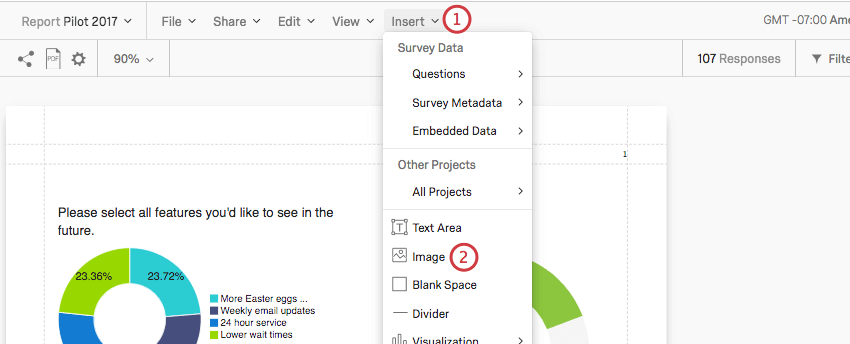
- Select Image.
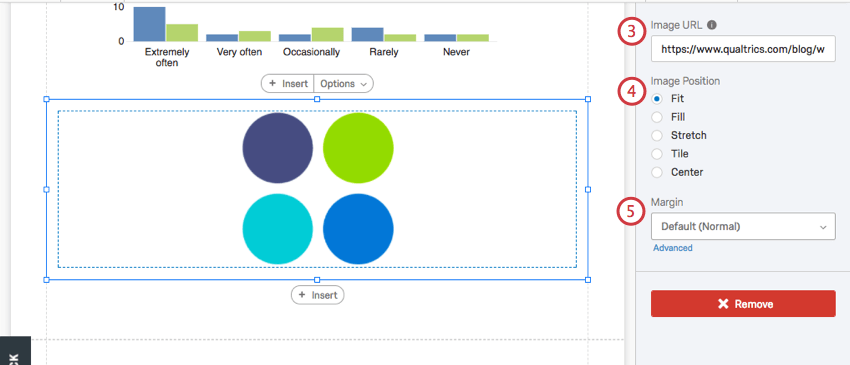
- Paste an image URL.
 Qtip: To insert an image from your library, click the Library icon to the right of the Image URL text box and select the graphic you want to insert.
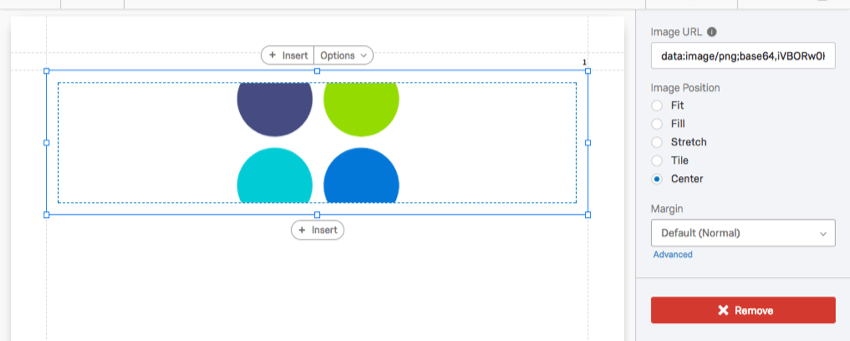
- Determine the image’s position relative to the margins around it.
- Determine the image’s margins.
See the examples below for more information on image position.
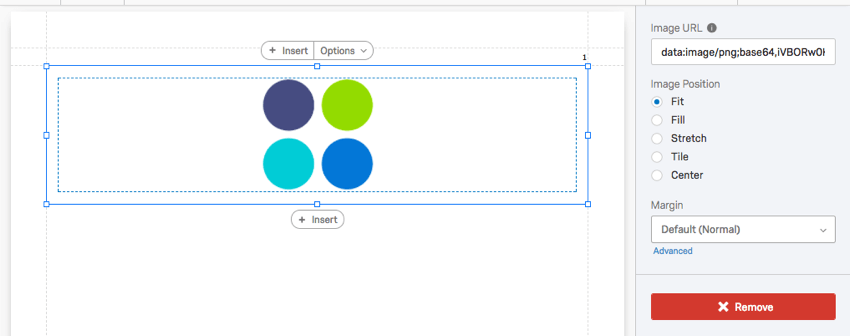
Fit
The image reverts to its natural dimensions within the margins. If you need to resize an image without stretching it, this is the best option.
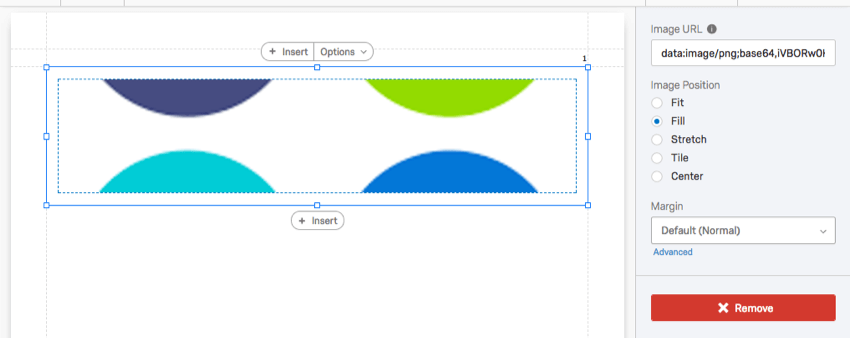
Fill
Have the image fill the margin without stretching.
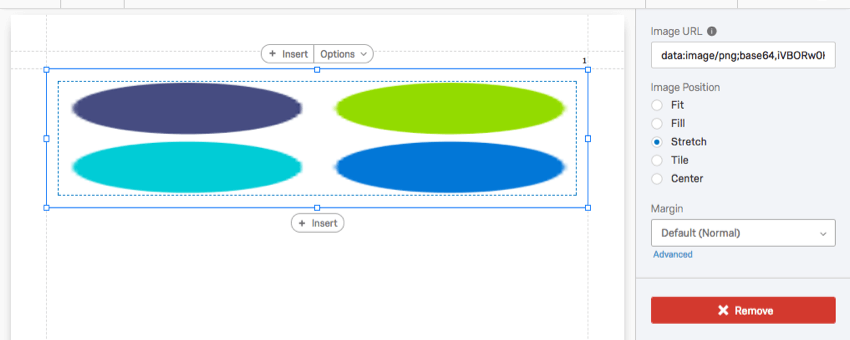
Stretch
Stretch the image to fit the margins.
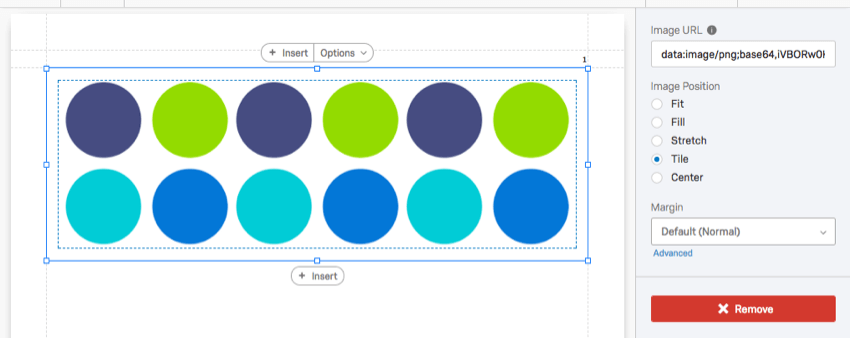
Tile
Repeat the image within the margins. This option looks especially nice for minimalist images or patterns.
Center
Center the image within the margins without stretching it or fitting it.
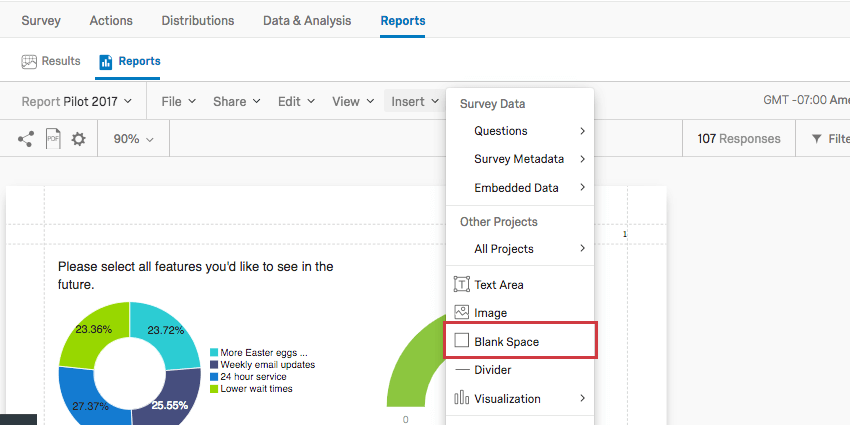
Blank Spaces
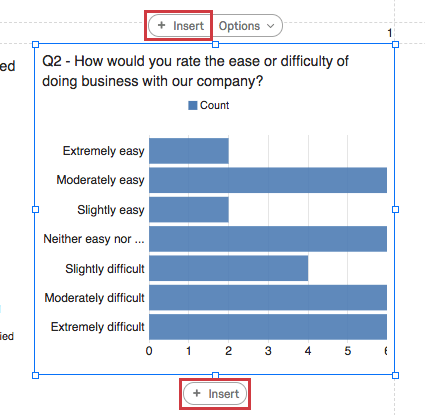
Click Insert and choose Blank Space to insert a blank space at the bottom of the page you’re working on.
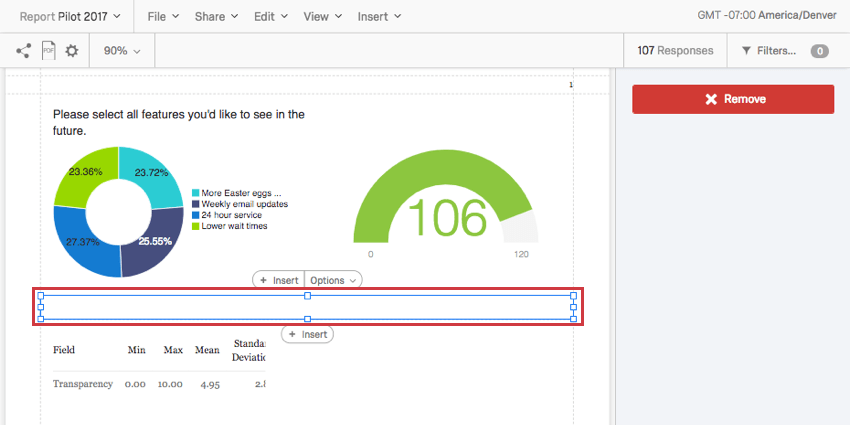
Blank spaces do exactly what it sounds like: they allow you to create blank spaces between your visualizations. They can be resized and dragged around the page as necessary.
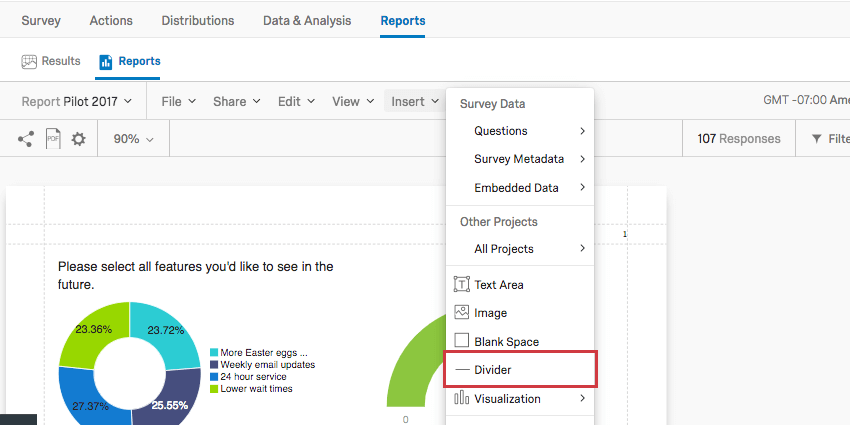
Dividers
Click Insert and choose Divider to insert a dividing line at the bottom of the page you’re working on.
There are several option for customizing your dividers.
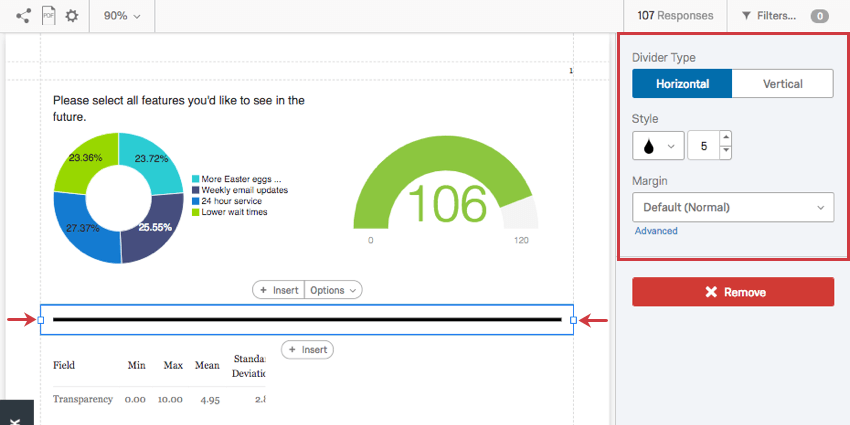
- Divider Type: Decide whether your dividing line is horizontal across the page or vertical.
- Style: The tear drop icon allows you to adjust the color of the divider. The Number selector lets you choose the thickness, in pixels, of the line.
- Margin: Adjust the margin around the divider.
Page Breaks & Deleting Pages
Pages are created automatically when you add visualizations and insert other content. Once a page runs out of room, a new one is automatically created. However, you can also manually insert pages.
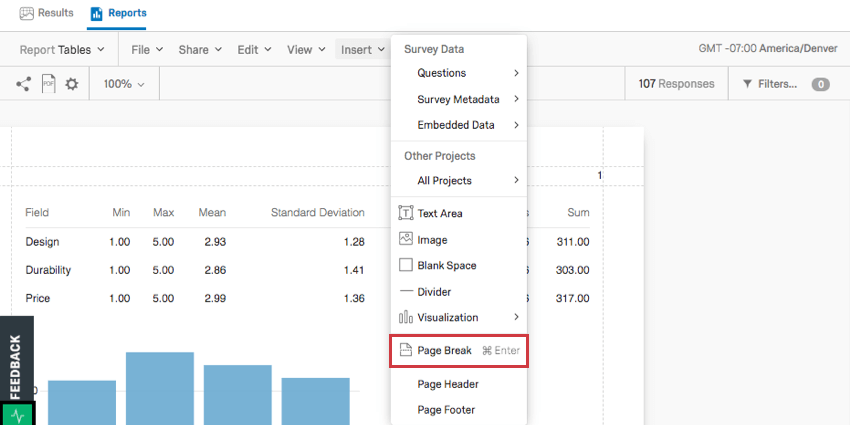
Click Insert and choose Page Break to insert a page break at the bottom of the page you’re working on.
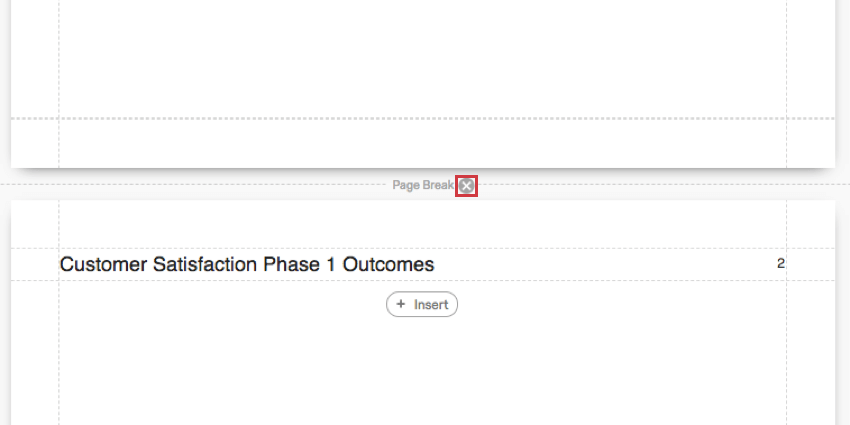
Remove a page break by hovering over it and clicking the X.
Header and Footer
You can add a header and footer to your report that contains a title, page numbers, or logos.
- Click Insert.
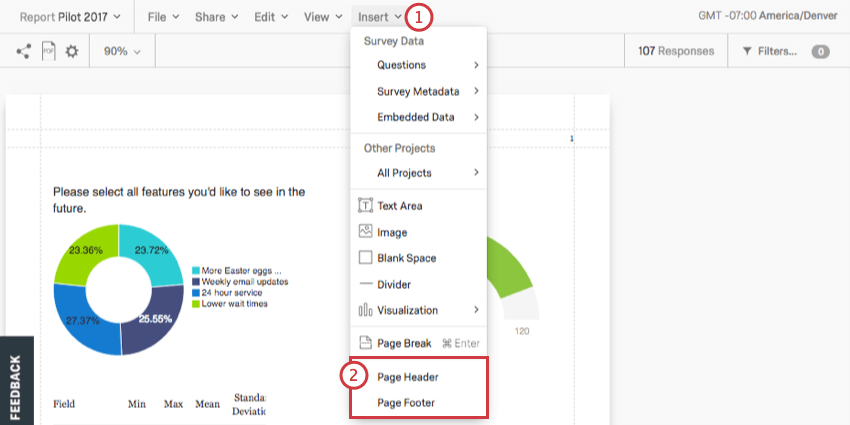
- Select Page Header or Page Footer.
- Set where you want text to appear relative to the other features in the header or footer. If you choose None, there will be no text.
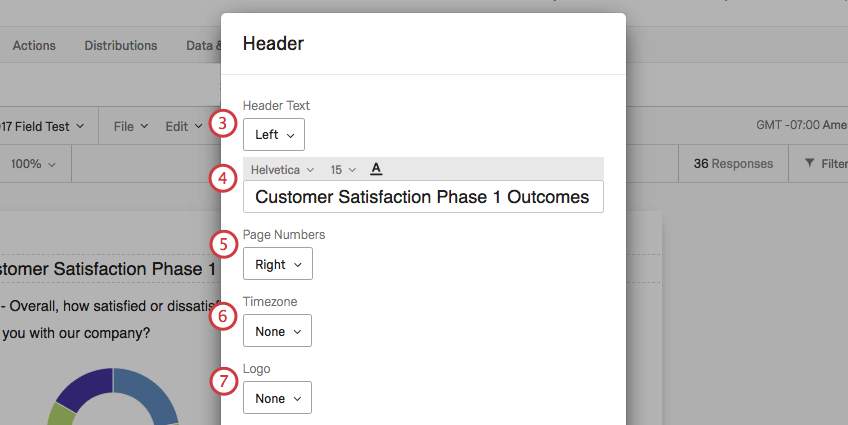
- Customize your text.
Qtip: This field will disappear if you chose None in Step 3. However, if you make the field reappear, any previous changes you made here will come back.
- Set where you want Page Numbers to appear relative to the other features in the header or footer. If you choose None, there will be no page numbers listed.
- Set where you want the Timezone to appear relative to the other features in the header or footer. If you choose None, there will be no time zone displayed.
- Set where you want a Logo to appear relative to the other features in the header or footer. If you choose None, there will be no logo.
- Customize the height of your logo.
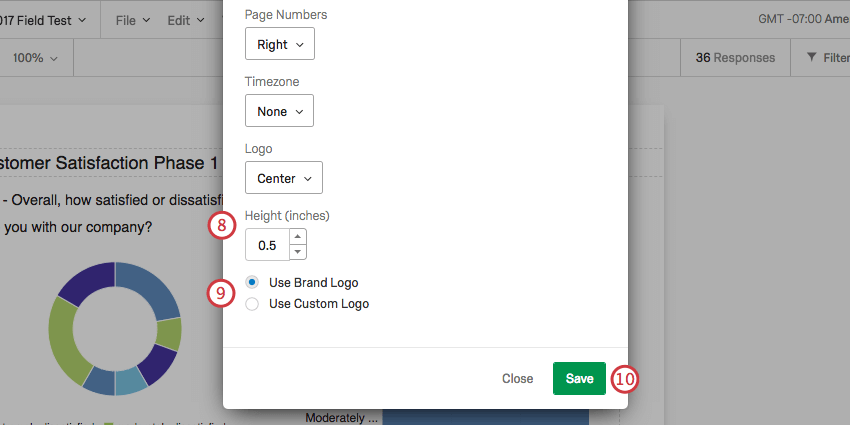 Qtip: This field will disappear if you chose None in Step 7.
 - Choose whether to use a brand logo or a custom logo. The Custom Logo option lets you paste in a URL.
Qtip: This field will disappear if you chose None in Step 7.
- Click Save.
Once a header or footer is added, you can double-click on it to open the editing window again.