-

Qualtrics Platform -

Customer Journey Optimizer -

XM Discover -

Qualtrics Social Connect
Date Time Segmentation
About Date Time Segmentation
Date time segmentation is useful for industries that use shifts for employee scheduling. The purpose of this functionality is to make it easier to report on performance metrics for individual shifts, allowing you to pinpoint the times of day that customer satisfaction may increase and where it may decrease.
On this page, we’ll talk about what you need to set up in order to report on date and time segments in your dashboard.
Types of Compatible Dashboards
Qualtrics has a few types of dashboards available. This feature can be found in the following dashboards:
- Dashboard projects (i.e., CX Dashboards)
- Employee Engagement
- Lifecycle
- 360
- Pulse
- Ad Hoc Employee Research
- Employee Journey Analytics
- Brand Experience
Please note that not all licenses include all of these types of dashboards.
Data Requirements
Date data
It is important to include date fields in your data. Survey data includes date fields by default, such as end date, start date, and recorded date.
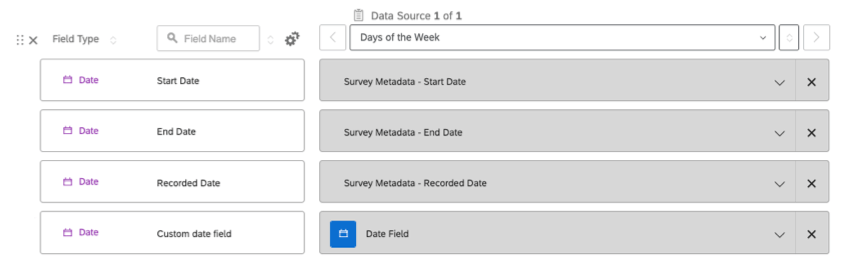
You can also use any custom date fields you want, such as transaction date. Custom date fields should be ISO 8601 format. You can use any time zone. Times should be on a 24 hour clock.
Additional breakout information
Date time segments allow you to break out your data by the shifts you’ve created and the day of the week. If you want to further break out your data by fields like location or representative, you will have to make sure to include that information in your data.
Creating Date Time Segments
Date time segments allow you to define your business’s shifts so you can more easily report on their performance. Once your dashboard data is mapped, follow the steps below to create date time segments.
- Go to your dashboard’s Settings page.
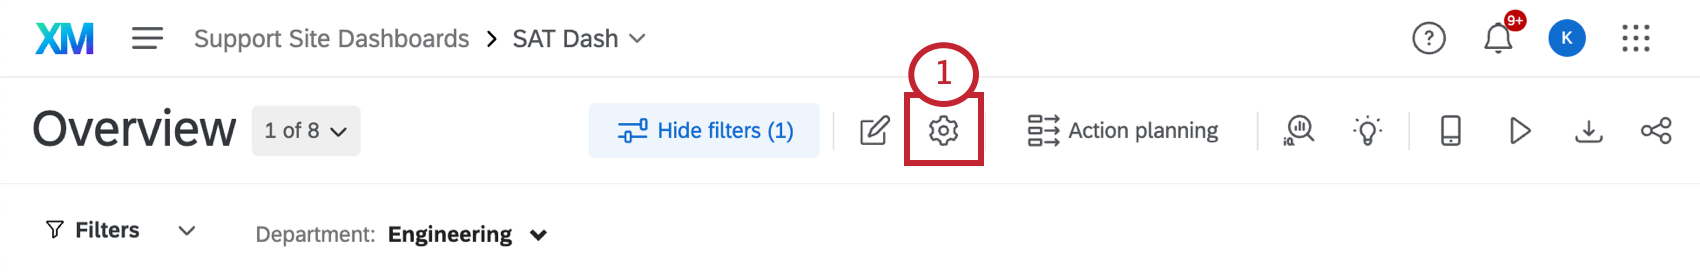
- Click Action.
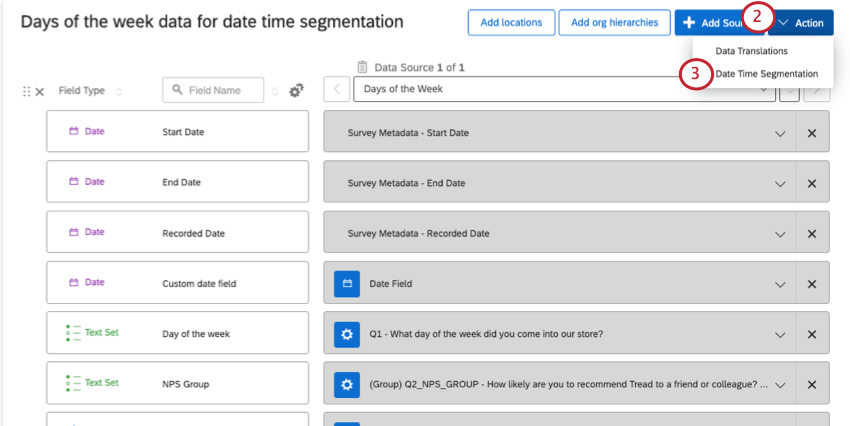
- Select Date Time Segmentation.
- Select the date field you’d like to create segments from.
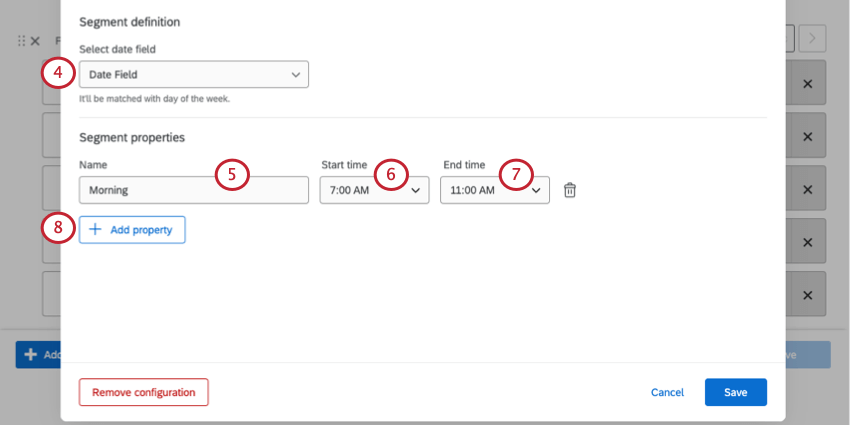
- Name your time segment.
Example: Our segments are based on employee shifts. We name them after the time of day when these shifts take place.
- Under Start time, determine when the segment begins.
- Under End time, determine when it ends.
- Click Add property to add another time segment.
Attention: Segments cannot overlap. For example, you cannot add 7am-3pm, 8am-4pm, and 9am-5pm as segments, because they all overlap from 9am-3pm.
- Once you’ve added all the segments, click Save.
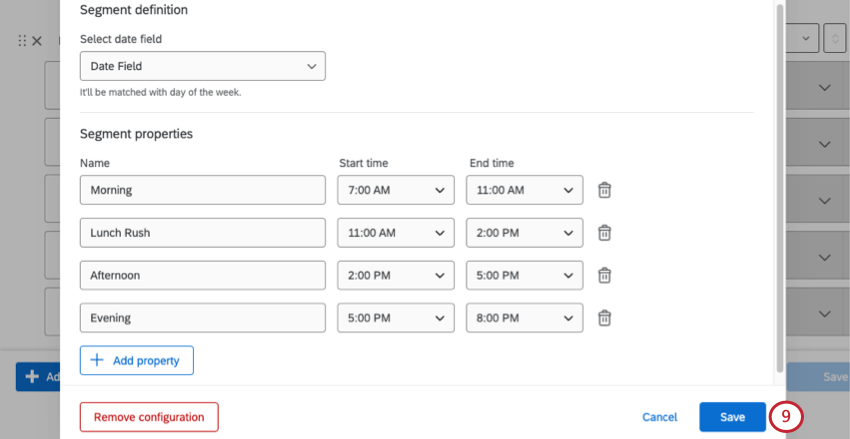 Qtip: You do not have to include every time period in your segments. In our example, we do not cover data from 8pm-7am, because that’s when our store is closed.
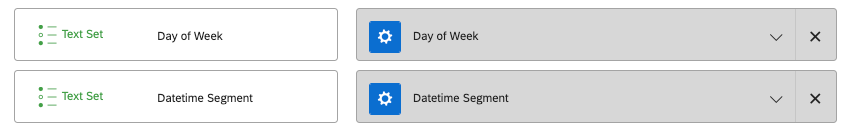
 - Two new text set fields will be mapped: Datetime Segment (the date time segments you just created) and Day of Week (i.e., Sunday through Saturday).
Recoding the Day of Week Field
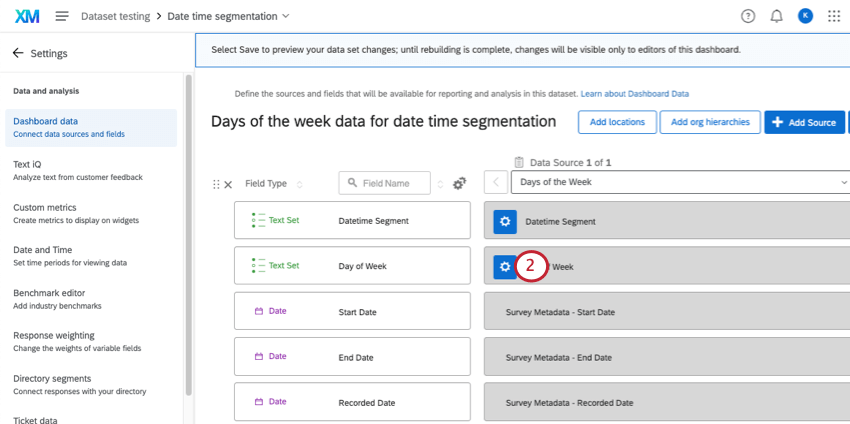
When you create a date time segment, a “Day of Week” field is added to your dashboard data. By default, the day values are mapped from 1-7. However, to make this data easier to read on a dashboard, we recommend recoding these values to the names or abbreviations of week days.
- Go to your dashboard’s Settings page.
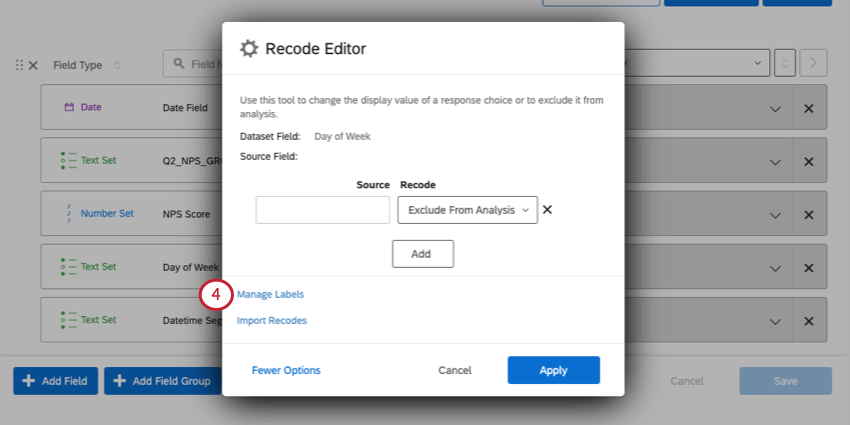
- Find the “Day of Week” field, and click the gear.
- Click More Options.
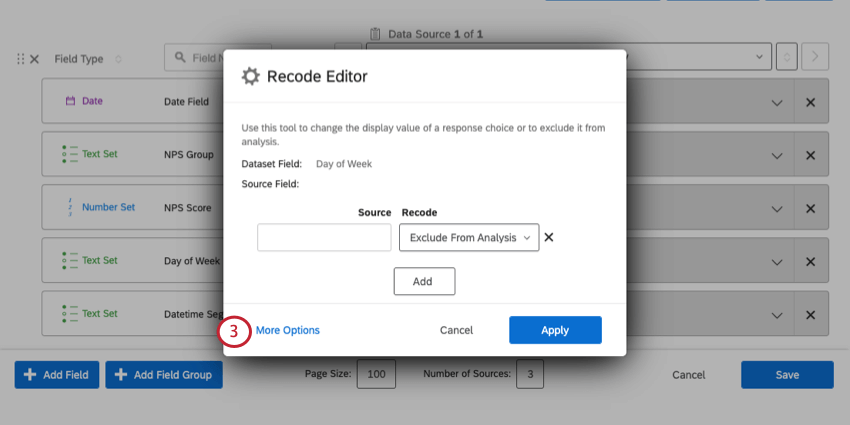
- Click Manage Labels.
- Add every day of the week. You can type out full names or abbreviations, depending on how you’d like them to appear in the dashboard.
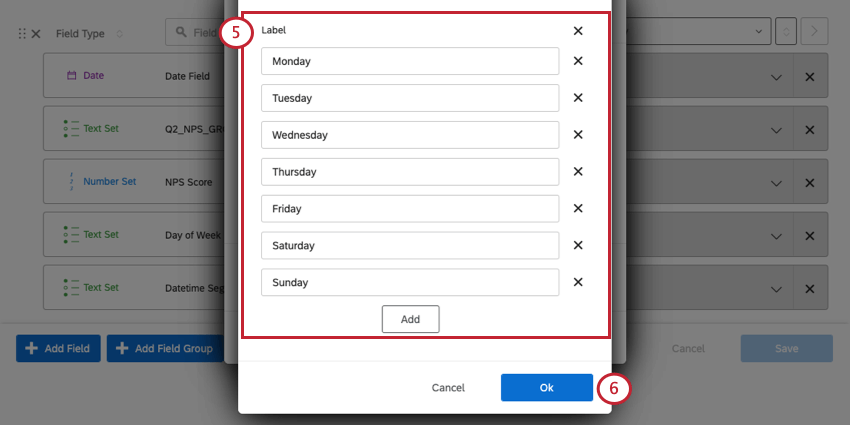
- When you’re finished, click Ok.
- On the left under Source, type the number. On the right, under Recode, select the day of the week. Here is a list of the number corresponding to each day:
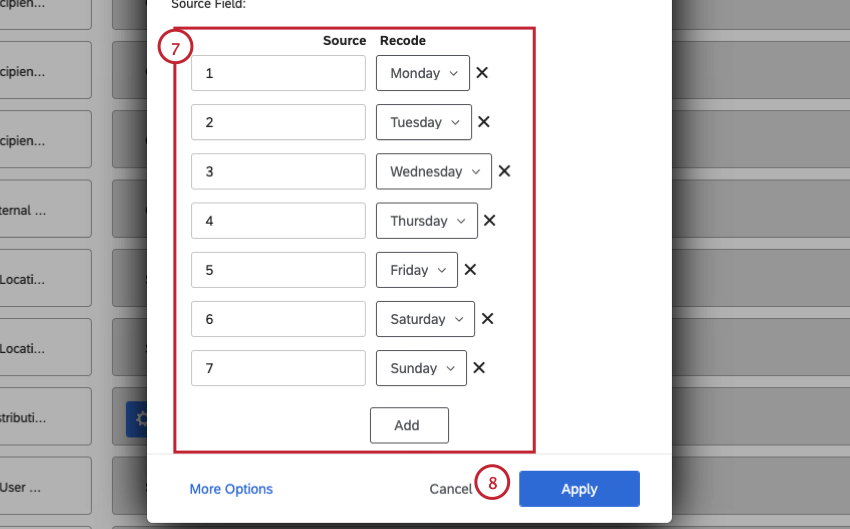
- 1 – Monday
- 2 – Tuesday
- 3 – Wednesday
- 4 – Thursday
- 5 – Friday
- 6 – Saturday
- 7 – Sunday
- When you’re finished, click Apply.
- Click Save.
Reporting on Date Time Segments in Widgets
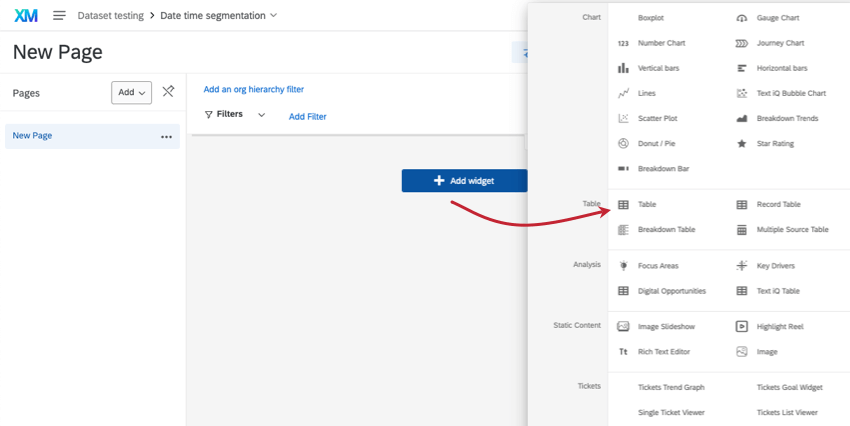
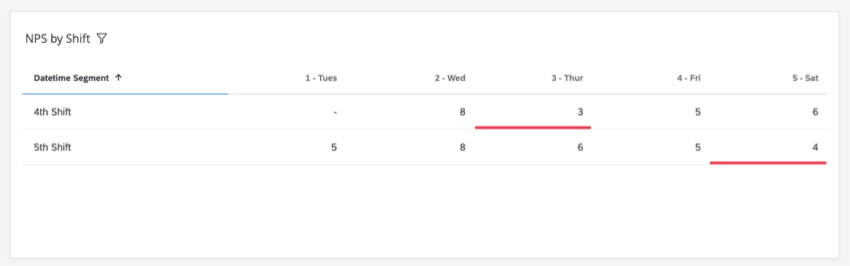
You can now add the “Datetime Segment” field to any widget compatible with text set fields. In this section, we’ll show you how to create a simple table that highlights metrics that are particularly high or low.
- Add a table widget to your dashboard.
- Under Metrics, add the metric you want to measure. We chose Average NPS.
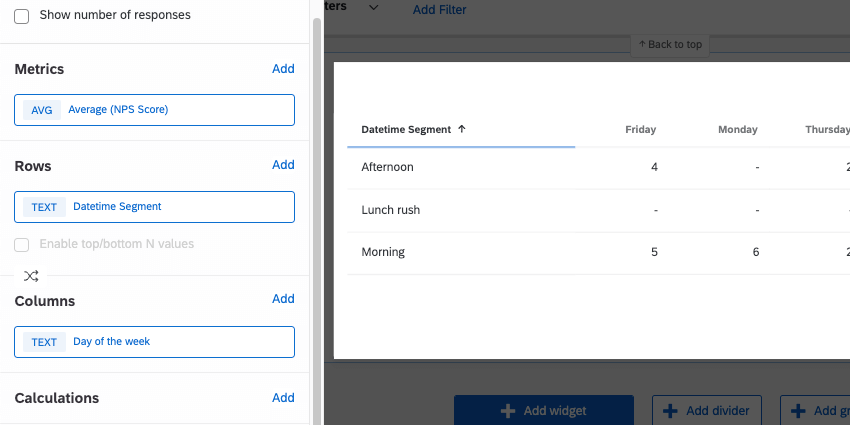
- Under Rows, add the “Datetime Segment” field.
- Under Columns, you can add an additional breakout. Common examples include representative, location, or day of week. We chose day of week.
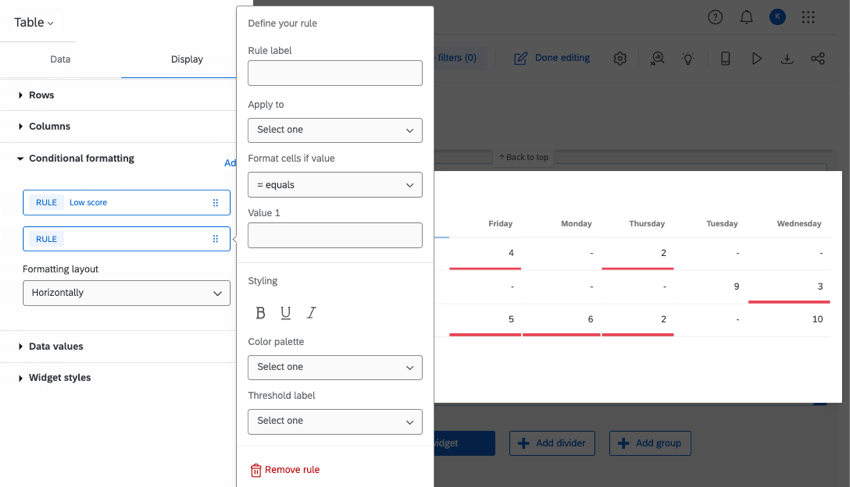
- Table widgets also let you add conditional formatting. This lets you highlight strengths and problem areas with colors and font effects. See Conditional Formatting for detailed steps.
Troubleshooting
If you’re having trouble getting date time segments to display properly in your dashboard widgets, try the steps in this section.
- Loading the latest data: Dashboard data can take some time to show the latest data. Keep in mind that depending on the size of your dataset, loading new data can sometimes take a few hours to complete. You’ll still be able to use the dashboard while the new data loads.
Qtip: A simple number chart that displays response count or a record grid that shows a list of responses can help you figure out if your data is finished loading.
- Date formatting: Date fields should be ISO 8601 format. ISO 8601 is in YYYY-MM-ddTHH:MMZ. “T” stands for “time,” and the meanings of each other letter can be found here. You can use any time zone. Times should be on a 24 hour clock. This formatting must be applied before you import or collect data.
Example: For example, let’s say it’s December 31, 2022, at 8:45pm in Pacific Standard Time. This becomes 2022-12-31T20:45-08:00.Qtip: See this external documentation for more details on ISO 8601. See Date Field Format (CX) for more on configuring these settings in Qualtrics.
- Date time segments: Here are a few tips for formatting date and time segments:
- If you use custom date fields set to a particular time zone, your segments should match that same time zone.
- Default metadata fields like start date, end date, and recorded date are in UTC (Coordinated Universal Time). Your segments should also be in UTC.
Example: Your business is located in Los Angeles, California, and is on Pacific Standard Time (PST). You choose to create date time segments with the default “End Date” field. You want to create a shift that lasts from 9am-5pm in PST. In UTC, this is 5pm-1am.
- Segments cannot overlap.
- It is fine to leave some time periods unmapped.
- Segments do not need to be the same length.
- Segment names can include any letter, number, spaces, or underscores ( _ ). Segment names can be up to 64 characters long. Names should not be empty.
- Excel and Sheets formatting: If you collected data in a survey, you don’t have to worry about this step. But if you imported your dashboard data source, or you imported your survey data, the issue might be with the source file and how the date information is formatted. See your chosen spreadsheet editor’s documentation for more help troubleshooting.
- Dashboard copying: Date time segmentation settings do not transfer when you copy a dashboard. You must recreate your date time segmentations in any copied dashboards.