-

Qualtrics Platform -

Customer Journey Optimizer -

XM Discover -

Qualtrics Social Connect
Configuring Dashboard Data for Journeys
About Configuring Dashboard Data for Journeys
When configuring your dashboard, you must map both milestones (also known as “stages”) and the outcomes of your data. Your milestones should match what you created for your journeys (whether you’re using the Journeys page or Customer Experience program journeys).
In the example we follow on this page, the “Stage” field will contain each of the milestones of the journey. You should also consider what metric you want to use for your outcome data. Outcome data refers to whatever impact you’re measuring over the course of your customer’s journey. For example, this may be NPS, satisfaction, or any other performance metric.
Once you’ve set up your dashboard data, you can visualize your customer journey in the dashboard.
Types of Dashboards
Journey data can be mapped into a few different types of dashboard. These include:
- Customer Experience Programs
- CX Dashboards
- Employee Engagement
- Lifecycle
- Pulse
- Ad Hoc Employee Research
- Employee Journey Analytics
Mapping Ongoing Journey Data to Dashboards
This section will detail how to configure your dashboard for surveys that were created after you created your journey; in other words, any surveys where you will be collecting new responses for the customer journeys dashboard.
- Create a Dashboard to visualize your journey.
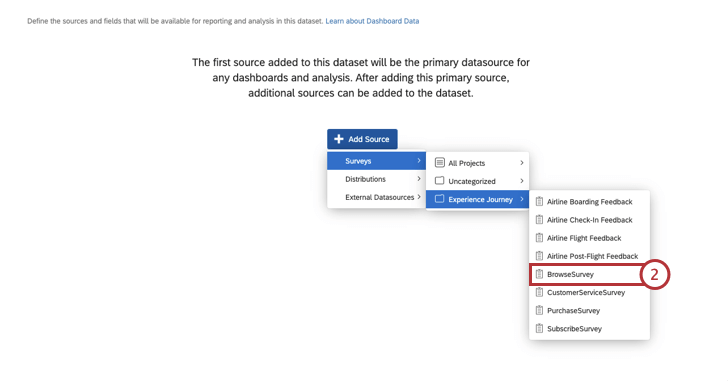
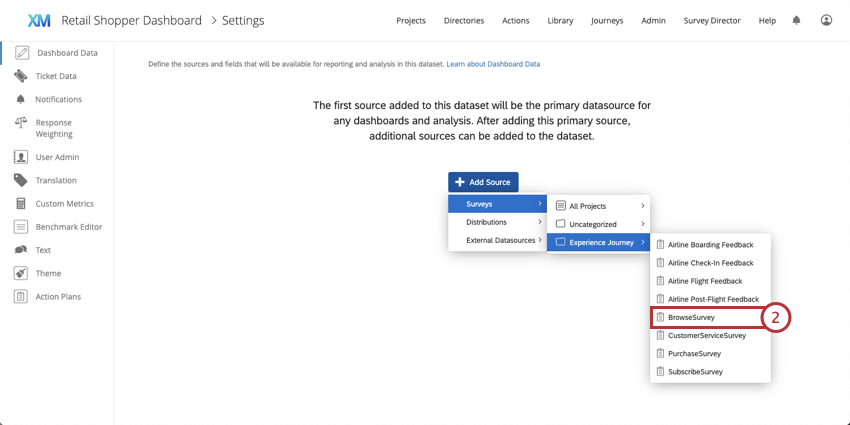
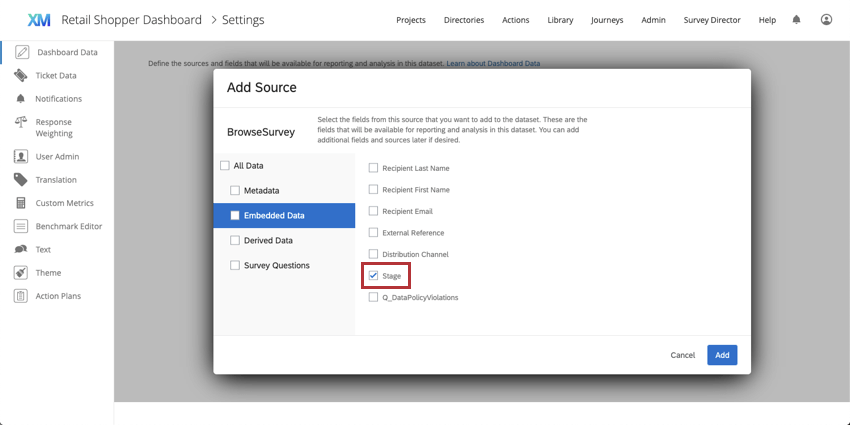
- Click Add Source and select your first journeys survey. For more information, see Mapping a Dashboard Data Source.
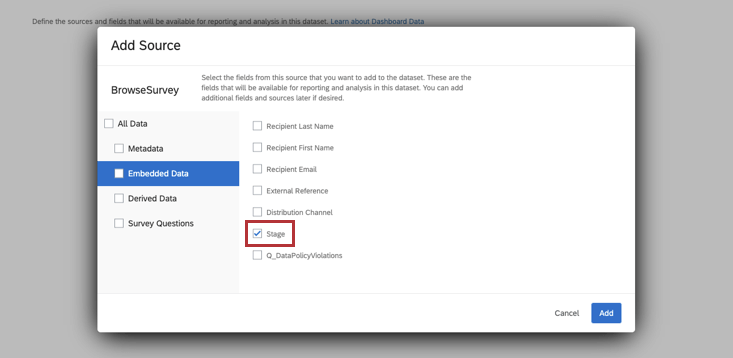
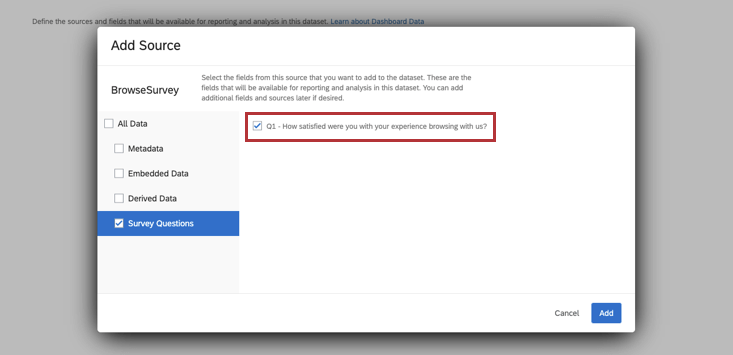
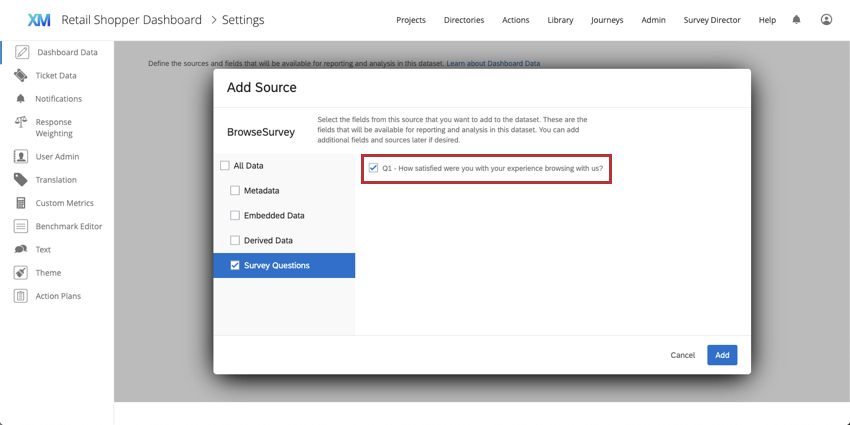
 Attention: When configuring your dashboard data, make sure that you have selected the embedded data field that will correspond to the journey stage and the questions you will be using as your outcome data. The question should correspond to the metric type you selected when Defining Your Journey; for example, if you used a specific NPS question to track customer experience across the journey, you must select that question when you’re configuring your dashboard source.Example: In this example, the embedded data field corresponding to the journey stage is called Stage, and outcome data is represented by the CSAT question, Q1 – How satisfied were you with your experience browsing with us?
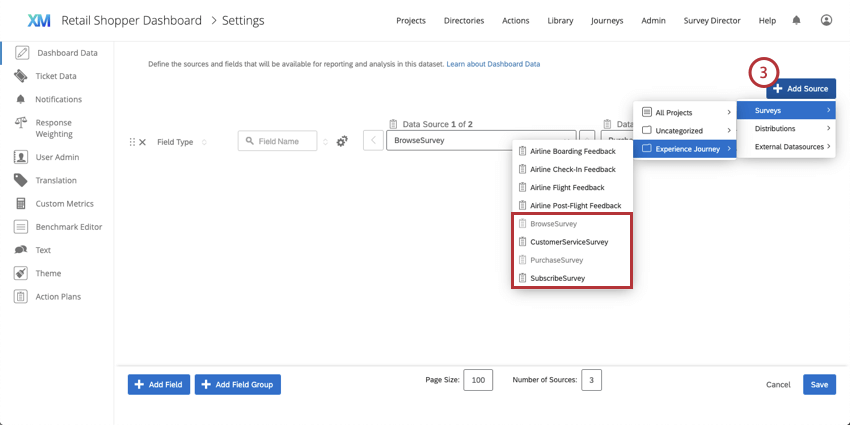
- Click Add Source to add your additional journey surveys as sources.
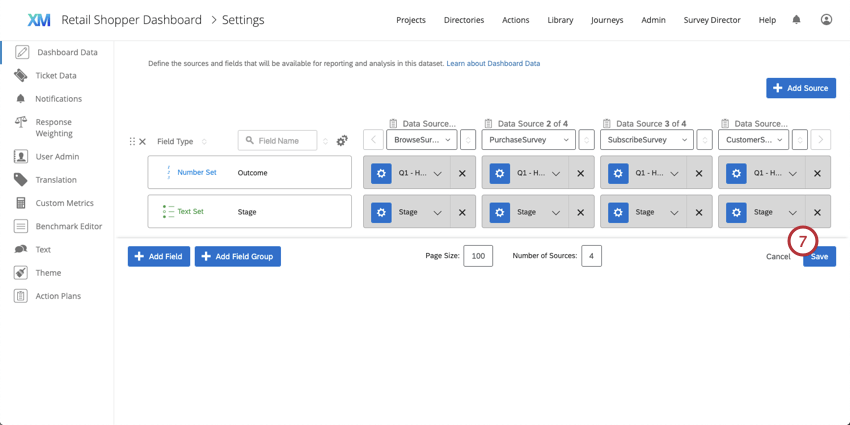
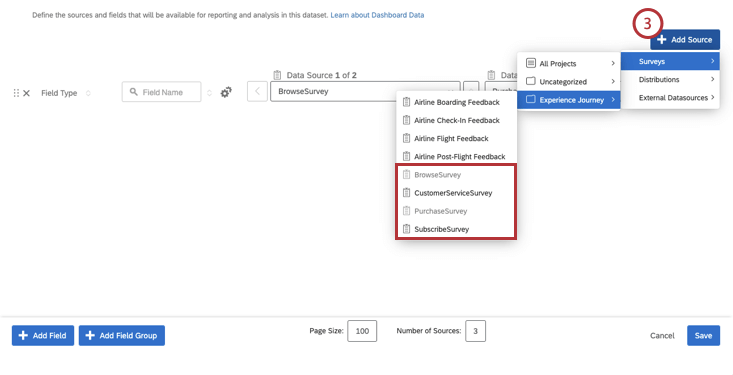 Example: In this example, BrowseSurvey, SubscribeSurvey, PurchaseSurvey, and CustomerExperienceSurvey are selected as sources for the journeys dashboard.
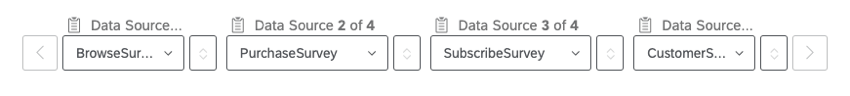
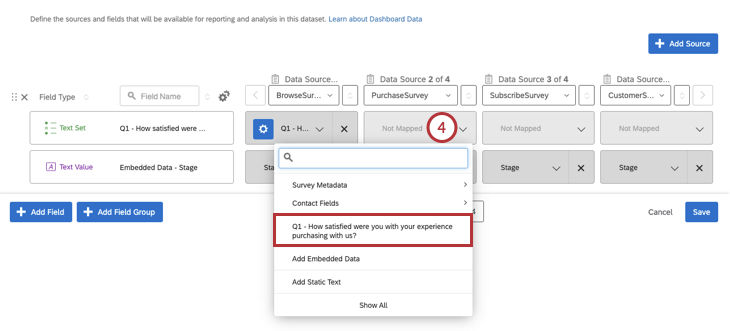
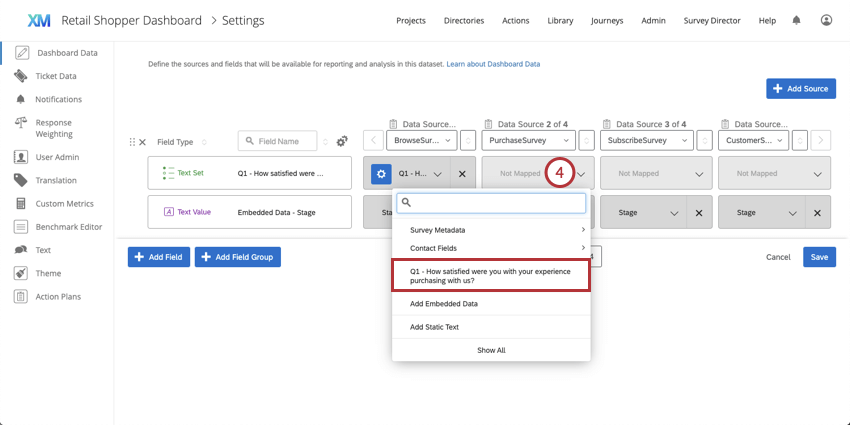
- Click Not Mapped to map the other data sources to your outcome questions.
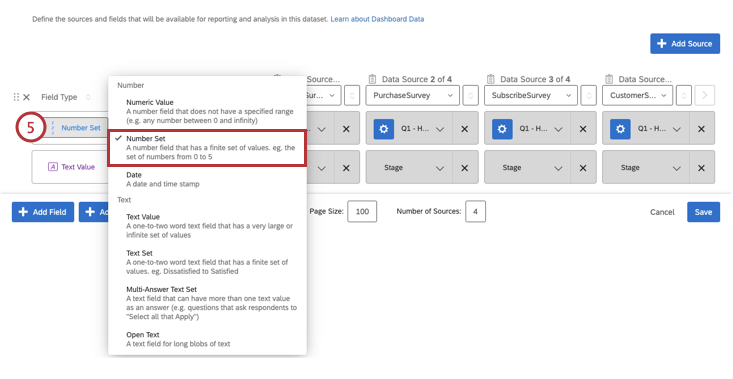
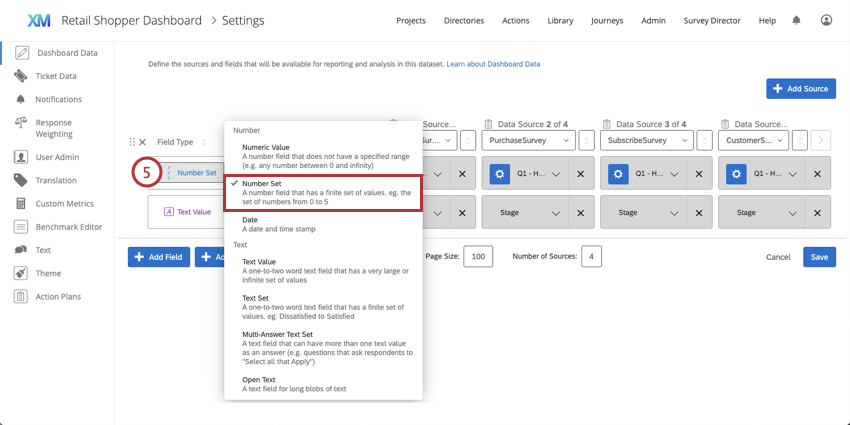
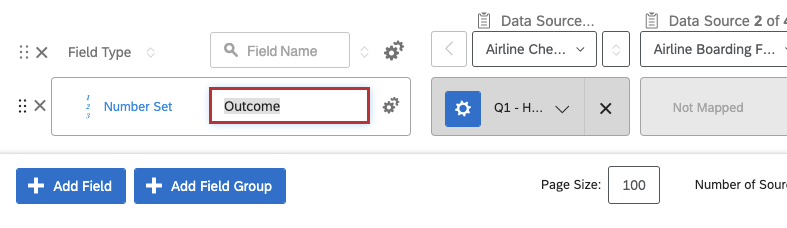
- Select Number Set as the field type of your outcome field.
 Qtip: You can rename your outcome field so that it is easily recognizable when you’re configuring your journey chart widget.
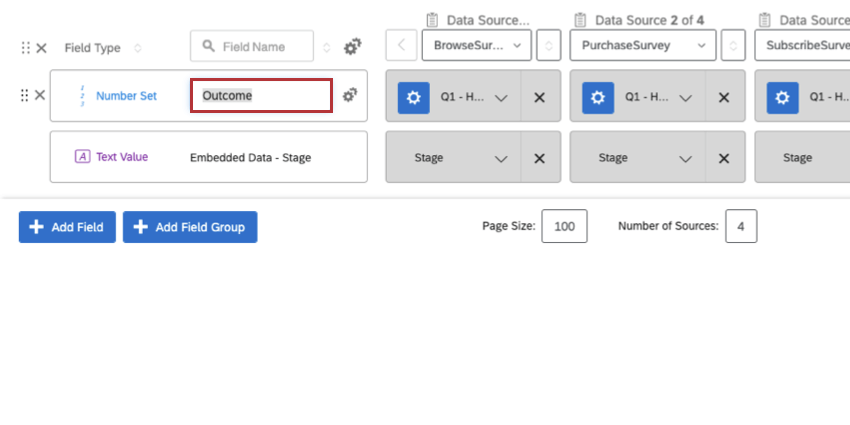
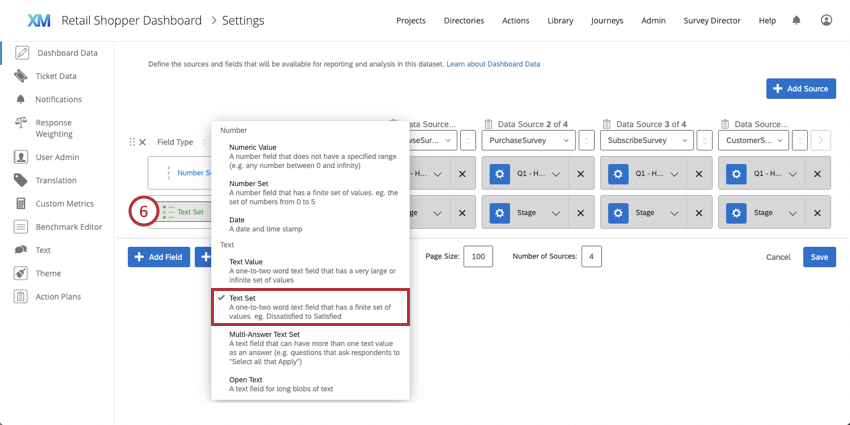
- Now that the outcome is configured, you can configure the journey stage data. Make sure that the field type is Text Set for your stage embedded data field.
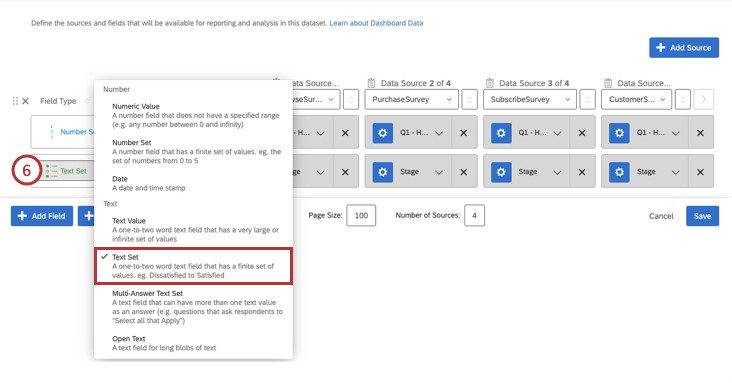 Attention: Make sure that your embedded data field is correctly identified in all of your sources.Qtip: You can rename your stage field so that it is easily recognizable when you’re configuring your journey chart widget.
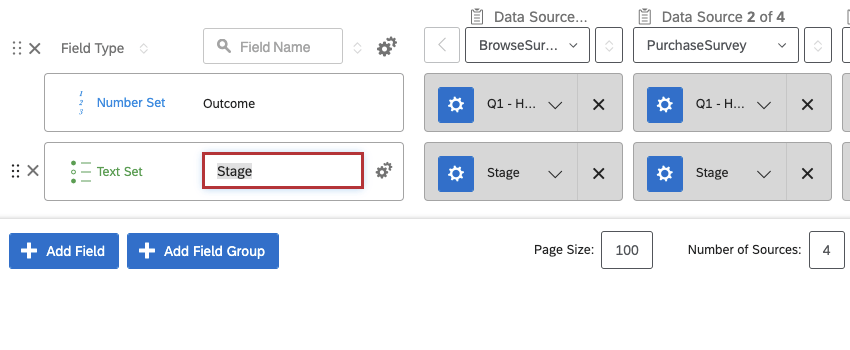
- Save your dashboard settings.
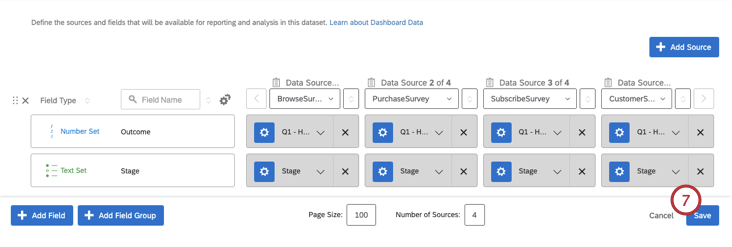
- View your dashboard. See Journey Chart Widget (CX) to create your journey widget.
Mapping Historical Journey Data to Dashboards
You may also want to visualize feedback from older surveys in your journey. The following section will show you how to configure your existing surveys in order to view previous data represented in your journey.
- Create a dashboard or open an existing dashboard to visualize your journey.
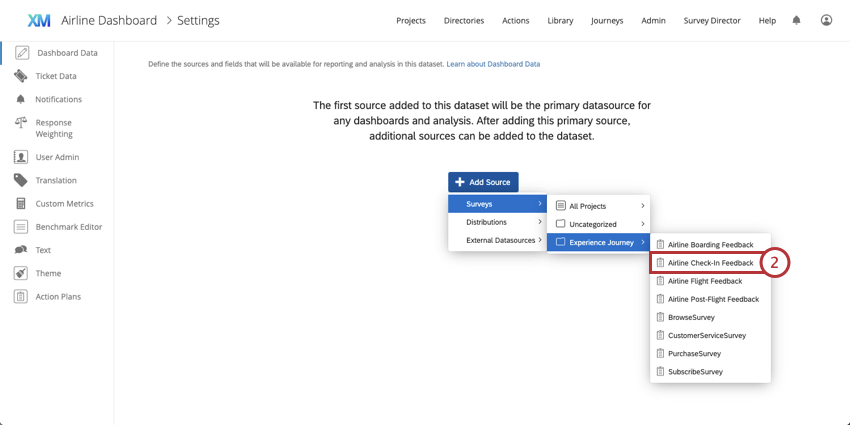
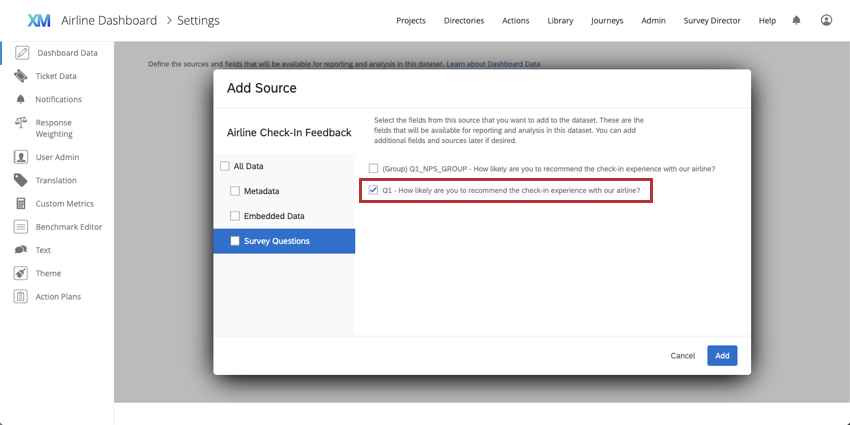
- Click Add Source and select your first journeys survey. For more information, see Mapping a Dashboard Data Source.
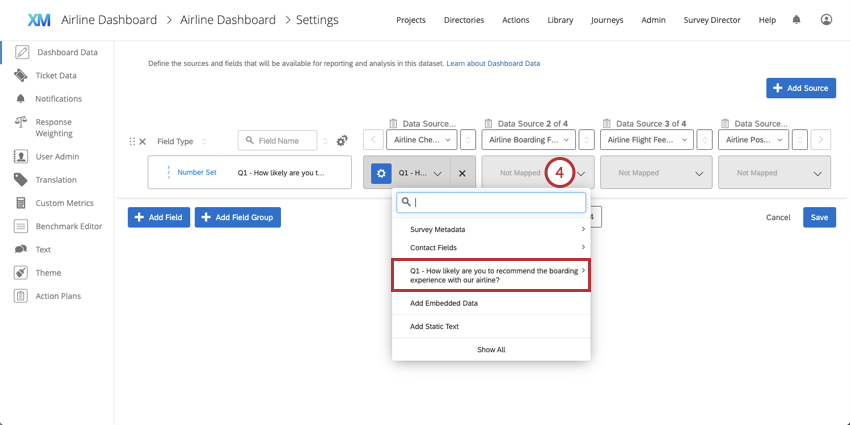
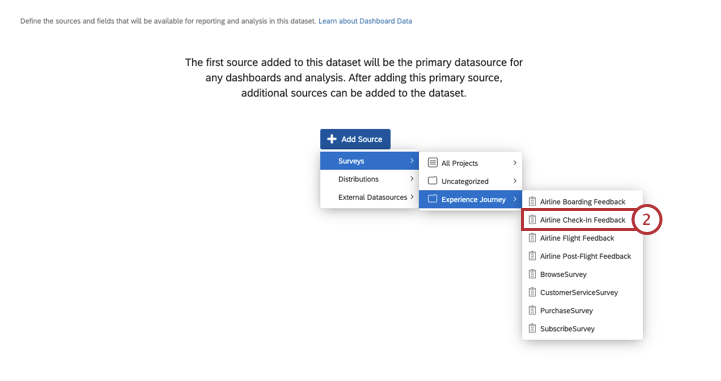 Attention: Make sure to select the question that represents your outcome data. The question should correspond to the metric type you selected when Defining Your Journey; for example, if you used a specific NPS question to track customer experience across the journey, you must select that question when you’re configuring your dashboard source.Example: In this example, outcome data is represented by the NPS question, Q1 – How likely are you to recommend the check-in experience with our airline? in the survey, so we will select that when configuring our dashboard.
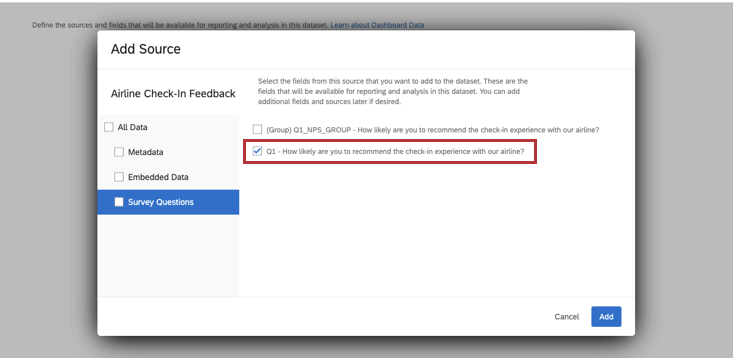
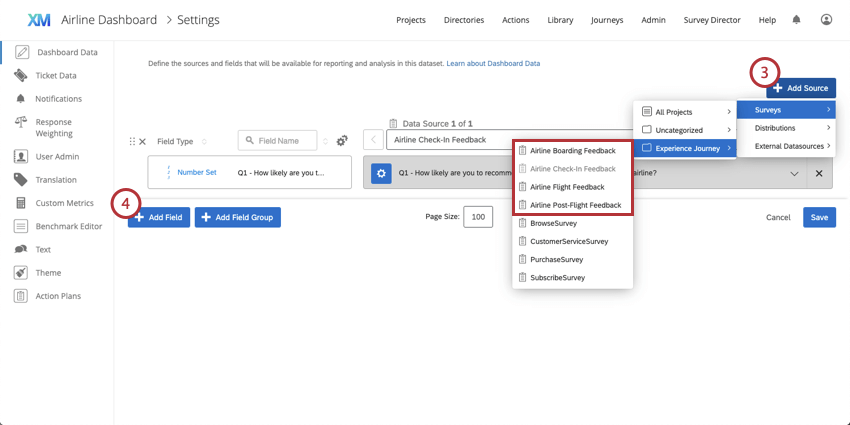
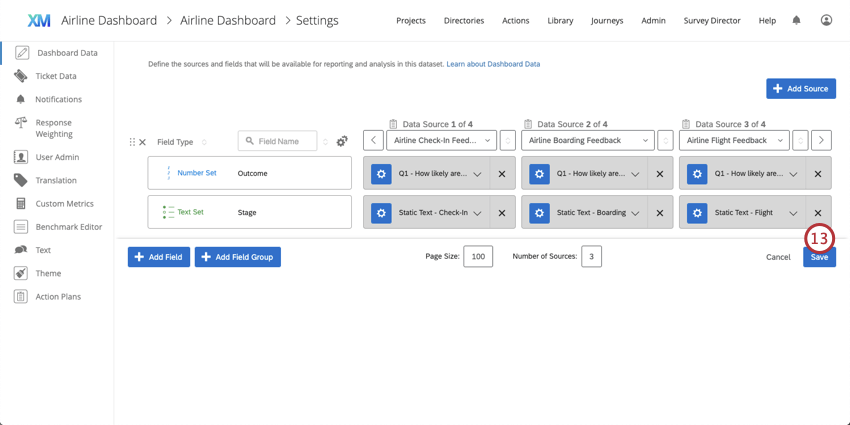
- Click Add Source to add your additional journey surveys as sources. In this example, the Airline Boarding, Check-In, Flight, and Post-Flight Feedback surveys are selected as sources for the journeys dashboard.
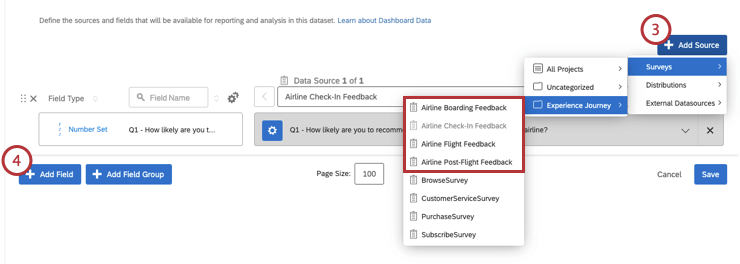 Example: In this example, the Airline Check-In, Boarding, Flight, and Post-Flight Feedback surveys are selected as sources for the journeys dashboard.
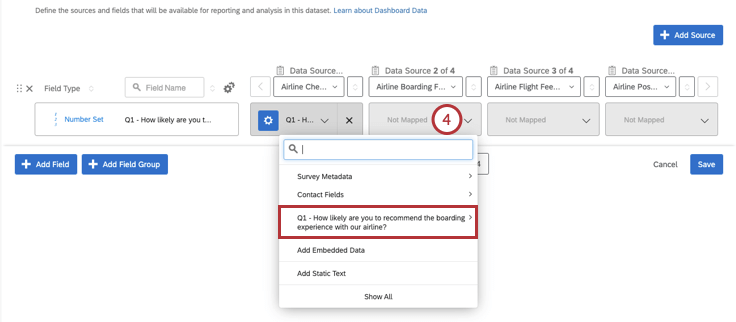
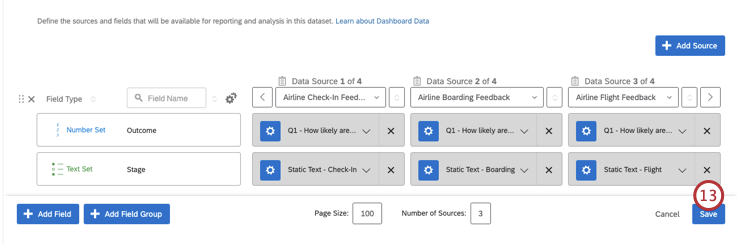
- Click Not Mapped to map the other data sources to your outcome questions.
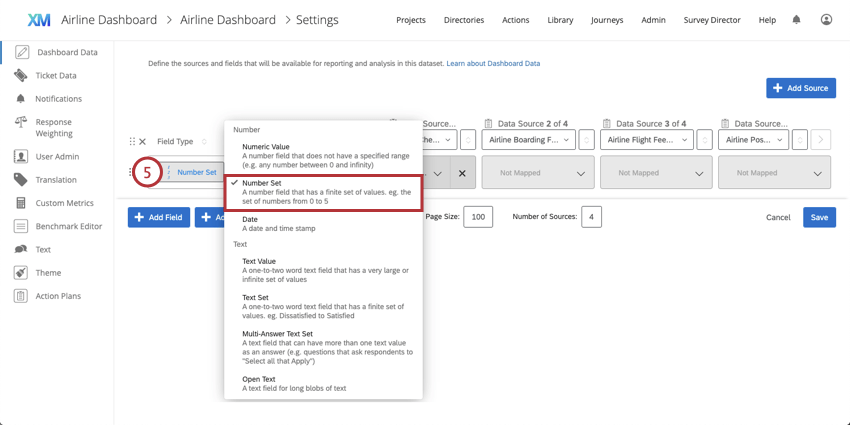
- Select Number Set as the field type of your outcome field.
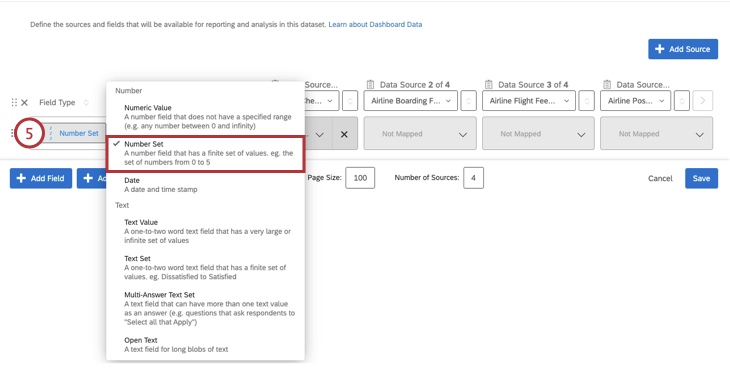 Qtip: You can rename your outcome field so that it is easily recognizable when you’re configuring your journey chart widget.
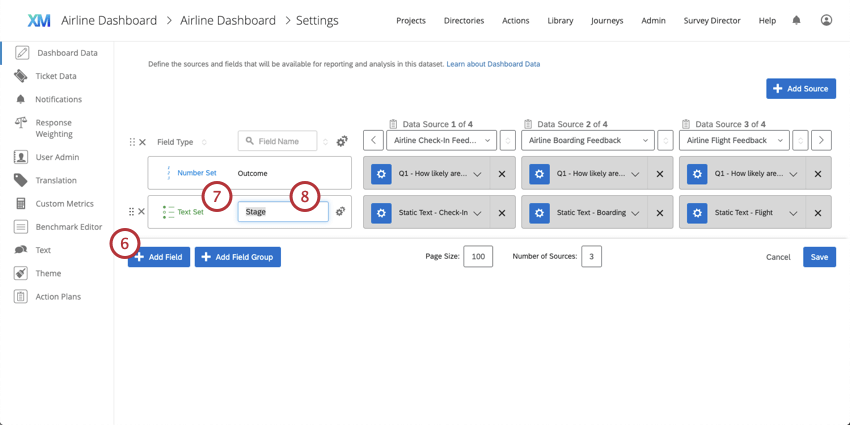
- Now that the outcome is configured, you can configure the journey stage data. Add a new field by clicking Add Field. In your dashboard, this field will represent the Stage dimension in your journey chart widget.
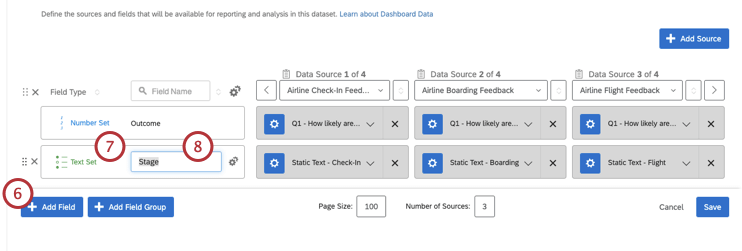
- Make sure that the field type is set to Text Set.
- Name your stage field.
Example: In this example, the field name is Stage so that it will be easy to locate when configuring the journey chart widget.
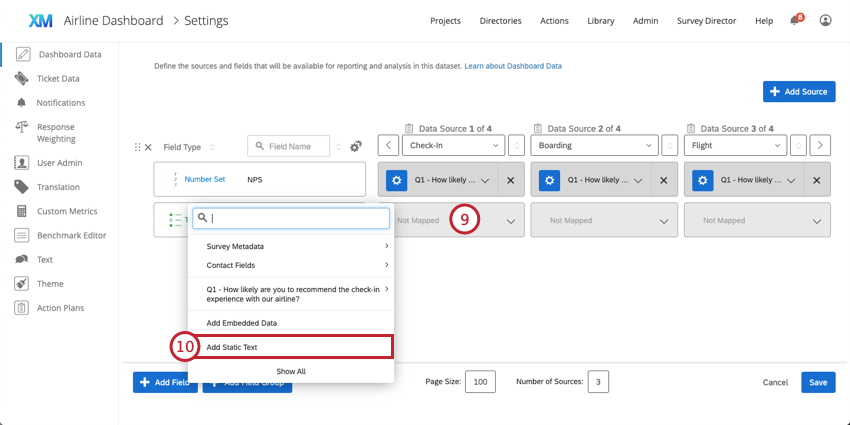
- Click Not Mapped on your first data source.
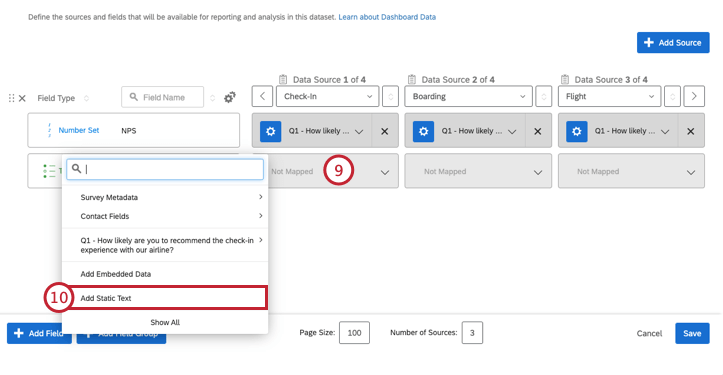
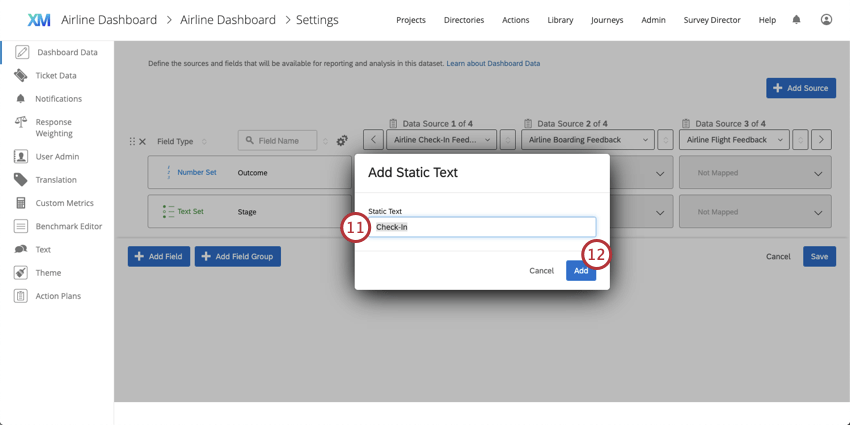
- Select the Add Static Text option from the dropdown.
- In the window that appears, input the stage name.
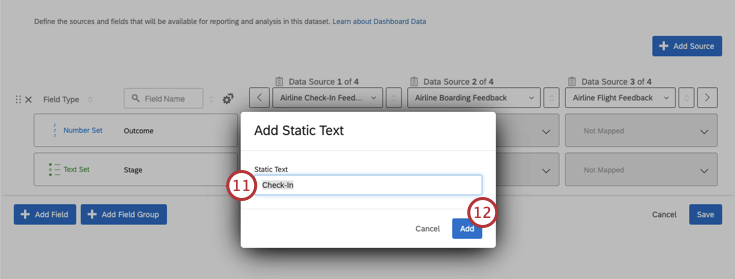 Qtip: We recommend that you use the value that corresponds to the stage name you defined in the Journeys page for organizational purposes.
 - Click Add.
- Once you’ve added all your stages as Static Text, Save your Dashboard Data settings.
- View your dashboard. See Journey Chart Widget (CX) to create your journey widget.
Recoding Outcome Metrics
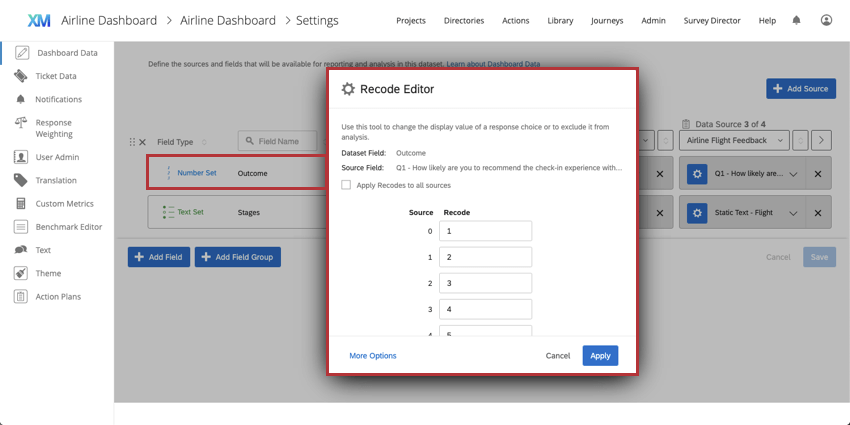
You can recode your outcome data in your dashboard. Recoding data determines what each value represents numerically, such as saying “Extremely dissatisfied” is equal to “1” and “Extremely satisfied” is equal to “5.”
First, you will need to set up your milestone data in the dashboard. Once your stage / milestone field is set up for all data sources, you can use the recode editor to configure your outcome fieldset.
After configuring your journey stages and outcomes, see Journey Chart Widget to create your journey widget.