-

Qualtrics Platform -

Customer Journey Optimizer -

XM Discover -

Qualtrics Social Connect
Ticket Reporting (CX)
About Ticket Reporting
In a ticket reporting page, you can create visualizations based on any tickets that you have created, just like you can for survey data. If you aren’t familiar with ticketing, check out our Tickets Task support page to learn the basics of setting up your close-the-loop ticketing system.
Mapping Ticket Data
Before you can report on your tickets, you need to connect your ticket data to your dashboard. See Ticket Reporting Datasets for a guide to creating ticket datasets, mapping ticket data, setting data restrictions, and more.
Creating Ticket Reporting Pages
You can’t report on your tickets on a regular dashboard page – you need to make a special page just for ticket reporting.
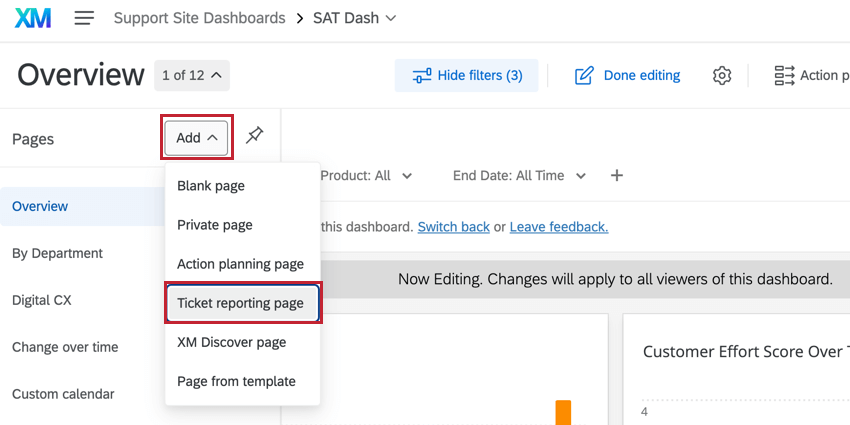
Click Add in the Pages menu and select Ticket reporting page.
Adding and Editing Widgets on a Ticketing Page
Reporting on tickets in CX Dashboards works just like reporting on survey data. Widgets are added and edited the same as they are in CX Dashboards. However, fields available in widgets will be based on ticketing fields rather than survey data.
See the Building Widgets (CX) support page for more information on customizing widgets.
Available Metadata Fields
Below is a list of all ticket metadata fields with a short description and their default field type. See more on ticket data field types.
- Key: The unique identifier automatically assigned to the ticket (e.g. T-52). It is mapped in as a Text Value.
- Name: The name of the workflow from which the ticket was triggered. The name is set in the Workflows tab of a specific survey. It is mapped in as a Text Value.
- Priority: The three possible values for priority are: low, medium, and high. The default value for a ticket is set in the Workflows tab and can be modified by the ticket owner. It is mapped in as a Text Set.
- Status: The default values for status are: open, in progress, and closed. However, a Brand Administrator can set up custom ticket statuses on their Follow-up page. It is mapped in as a Text Set.
Qtip: With some additional setup, it’s possible to report on the time spent between ticket statuses. To learn more, read the Time Between Ticket Statuses page.
- Owner Name: The owner name is the first and last name on the account of the ticket owner. It is mapped in as a Text Value.
- Role Name: If you assign a ticket to a role from the Workflows tab, this field will show the name of that role. Otherwise, it will read “NULL.” It is mapped in as a Text Value.
- Created At: The date that the ticket is created. It is mapped in as a Date Field.
- Updated At: The most recent time any edit was made to the ticket. This is mapped in as a Date Field.
- First Updated At: The time the ticket was first edited in any manner. This is mapped in as a Date Field.
- Closed At: The time that the ticket’s status was changed to “Closed.” This is mapped in as a Date Field.
- Ticket Source ID: The Survey ID of the survey in which the workflow that the ticket was created from is housed. This is mapped in as a Text Value.
- Ticket Source Type: The way in which the ticket was created. At this time, the only source available is “Survey.” This is saved as a Text Value.
- Root Cause: Root causes can be set in a workflow and then selected by a ticket owner. This is mapped as a Text Value.
- Resolution Time: The time (in minutes) between when the ticket was created and when its status was changed to “Closed.” This is mapped as a Text Value, but can also be mapped as a Numeric Value.
- Link: A URL to a specific ticket. This is mapped as a Text Value.
- Ticket Data: Any ticket data fields you’ve created can also be mapped into the ticket reporting dataset. They will be pulled in as a Text Set or Text Value field depending on the question type or Embedded Data they are mapped from.
Qtip: For date fields to pull into ticket reporting pages, they need to be mapped in ISO format (YYYY-MM-DD).
- Ticket Notes: Any ticket notes fields that you’ve added on your ticket workflow in the Follow-Up Details section can be mapped into the ticket reporting dataset. They will be pulled in as a Text Set or Text Value field depending on the question type the note is built on.
- Activity: Any changes that have been made to the ticket. Each activity contains status changes, assignee changes, comments, and more in chronological order, all separated by the delimiter ( | ).This is an Open Text field by default, but can be changed to Text Value.
- Comments: Any comments that have been added to the ticket, separated by the delimiter ( | ). This is an Open Text field by default, but can be changed to Text Value.
Example Widgets
Below are a few example widgets to help understand how the feature can be used:
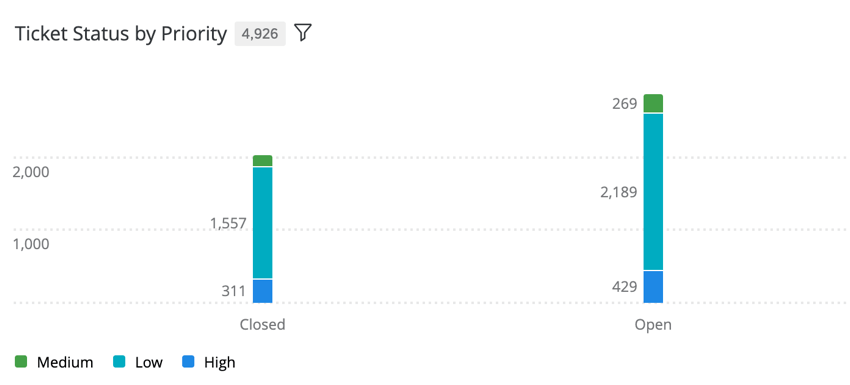
- A vertical bar widget that shows the priorities of tickets that are closed, in progress, and open. (Vertical bar widget with Metric: Count, X-Axis Dimension: Status, Data Series: Priority, Display Options: Show Data Values, Stack Chart.)
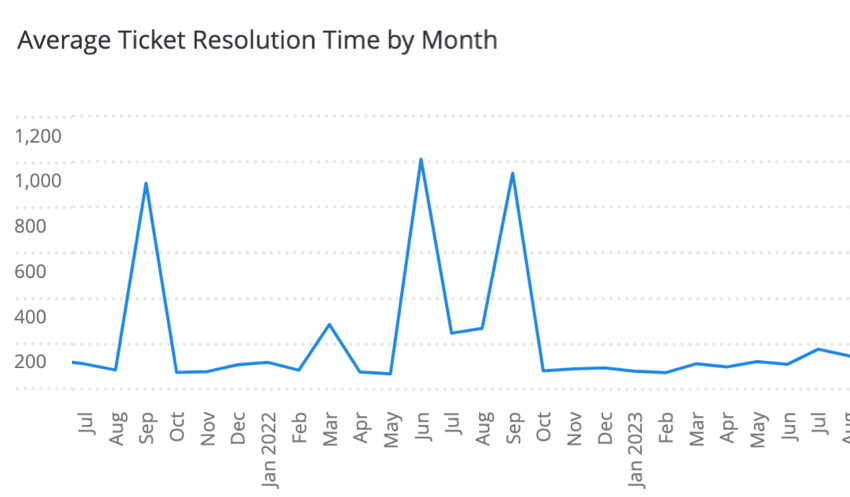
- A line widget of Average Resolution Time grouped by month.
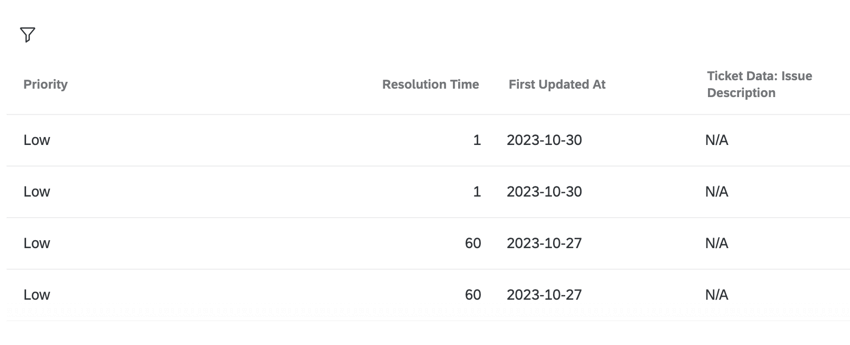
- A record table with columns that include Priority, Resolution Time, and First Updated At fields, as well as ticket data.
Ticket Data Restrictions
By default, all users and roles have access to all ticket reporting data. However, you can create ticket data restrictions to limit access to this data. See Ticket Data Restrictions for more details.
Navigating Between Tickets and Dashboards
There are times when editing or using your dashboard that you may need to quickly navigate between the dashboard and your tickets.
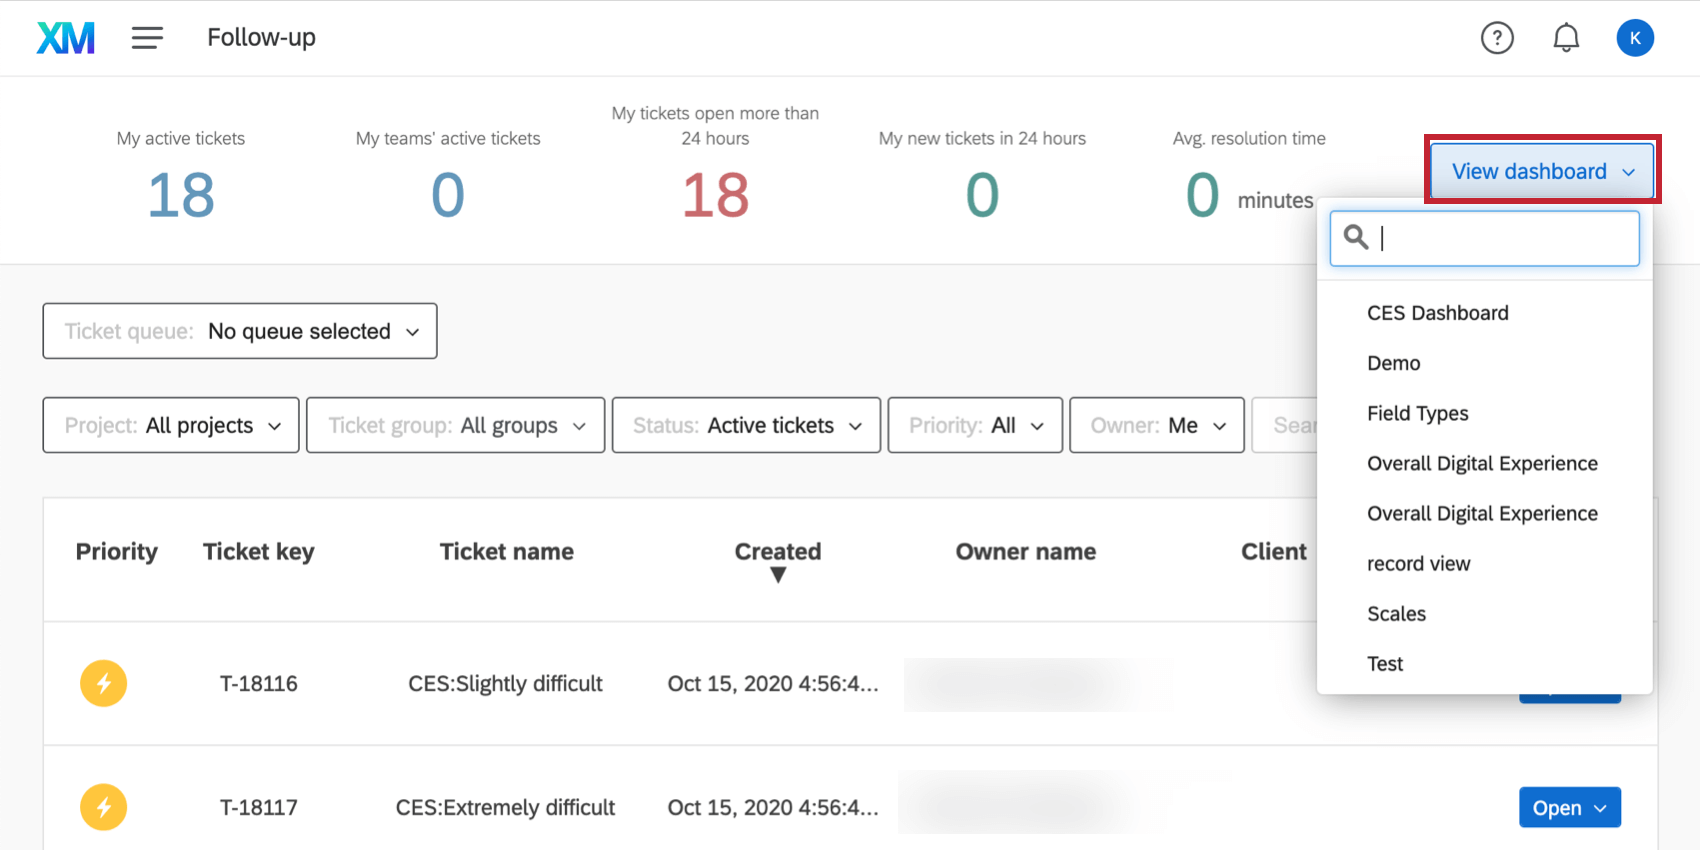
To access your tickets, click the navigation menu in the top left corner and select Tickets.
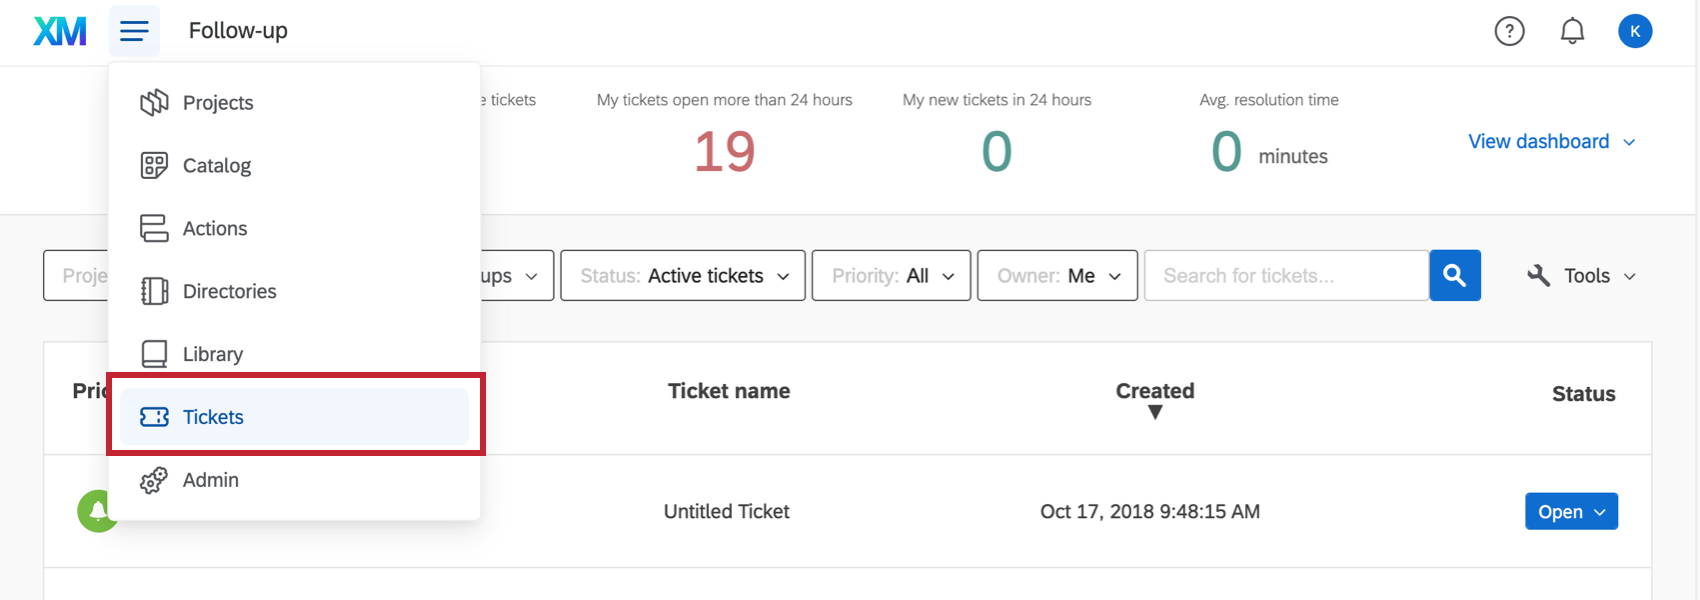
When inside your ticket page, you can return to a CX Dashboard by clicking the View Dashboard dropdown on the upper-right and choosing the dashboard by name.