-

Qualtrics Platform -

Customer Journey Optimizer -

XM Discover -

Qualtrics Social Connect
XM Directory Respondent Funnel
About XM Directory Respondent Funnel
XM Directory users can visualize CX program metrics such as email open rate and survey response rate with the use of the Respondent Funnel. The Respondent Funnel allows XM Directory distribution and contact metrics, transactional data, Embedded Data, and even contact import automation failures to be uploaded into CX Dashboards for transparency with all your key stakeholders.
Enabling Respondent Funnels for a User
Once Respondent Funnels are enabled for a brand, each user who wants to use the feature to build dashboards will have to complete the steps below.
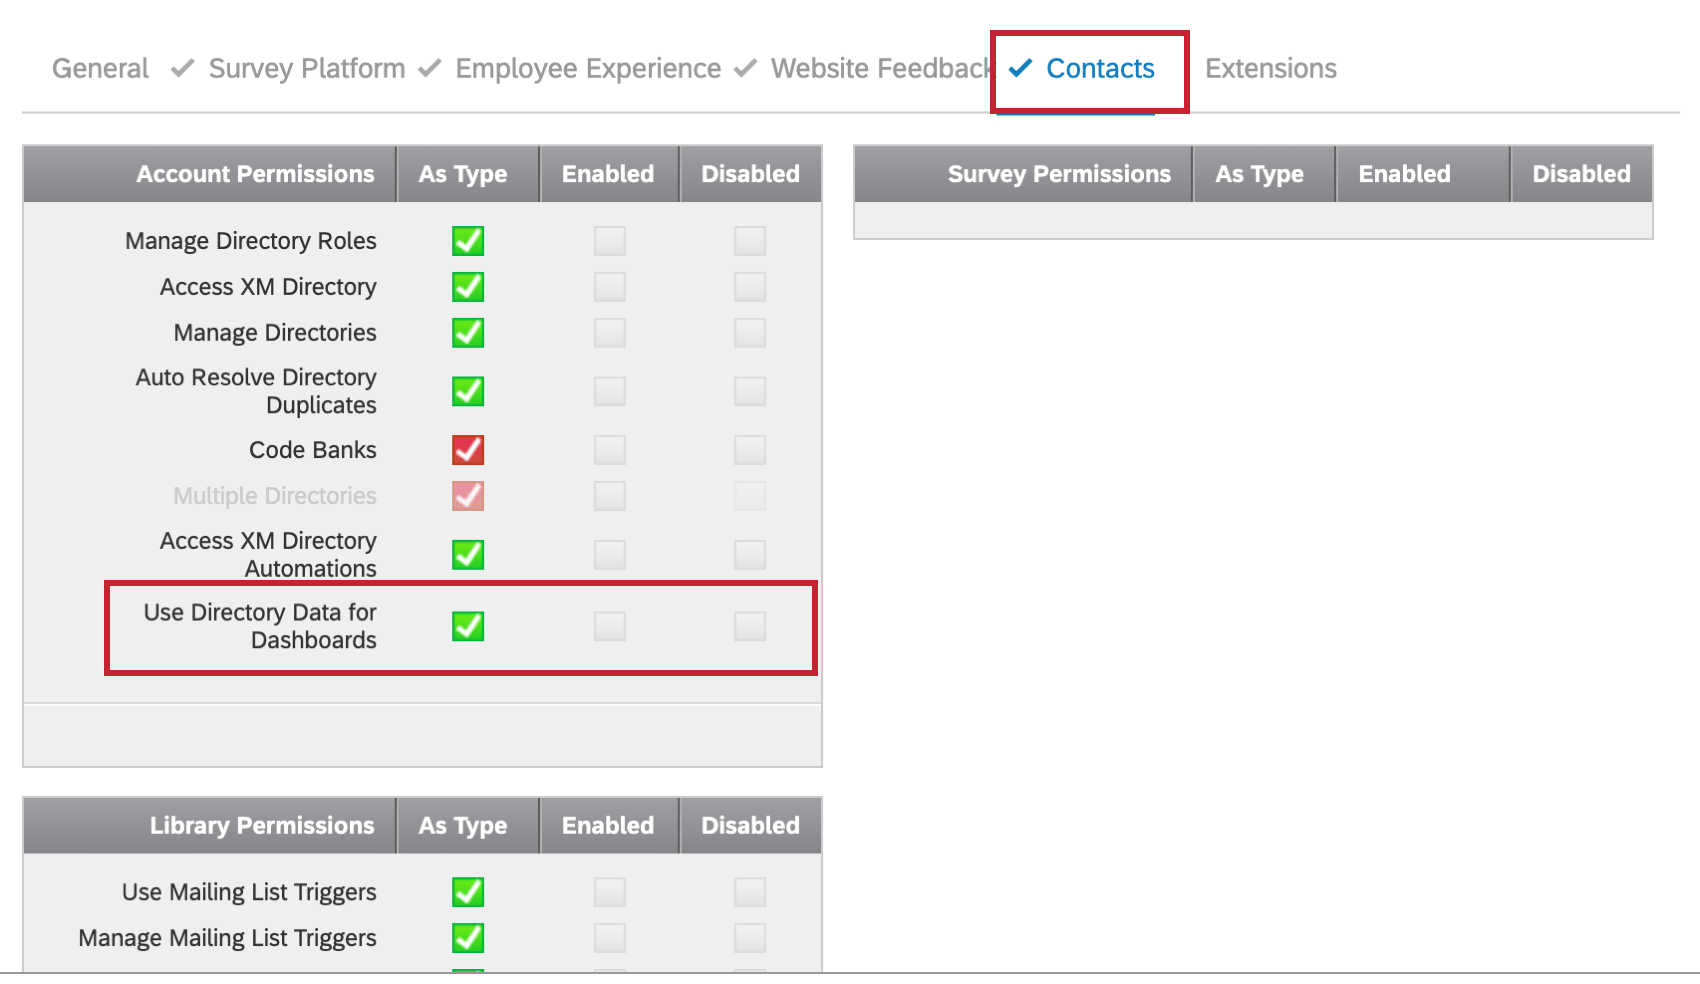
Enabling the User Permission
Enable the user permission under Contacts called Use Directory Data for Dashboards. Make sure you can also access and manage the directory.
Enabling the Dashboard
Before following these steps, make sure you are in the account you’d like to enable this feature for. If your brand has multiple directories, you must also make sure you are in the desired directory. You can enable the Respondent Funnel for multiple directories, but you must turn it on individually for each directory.
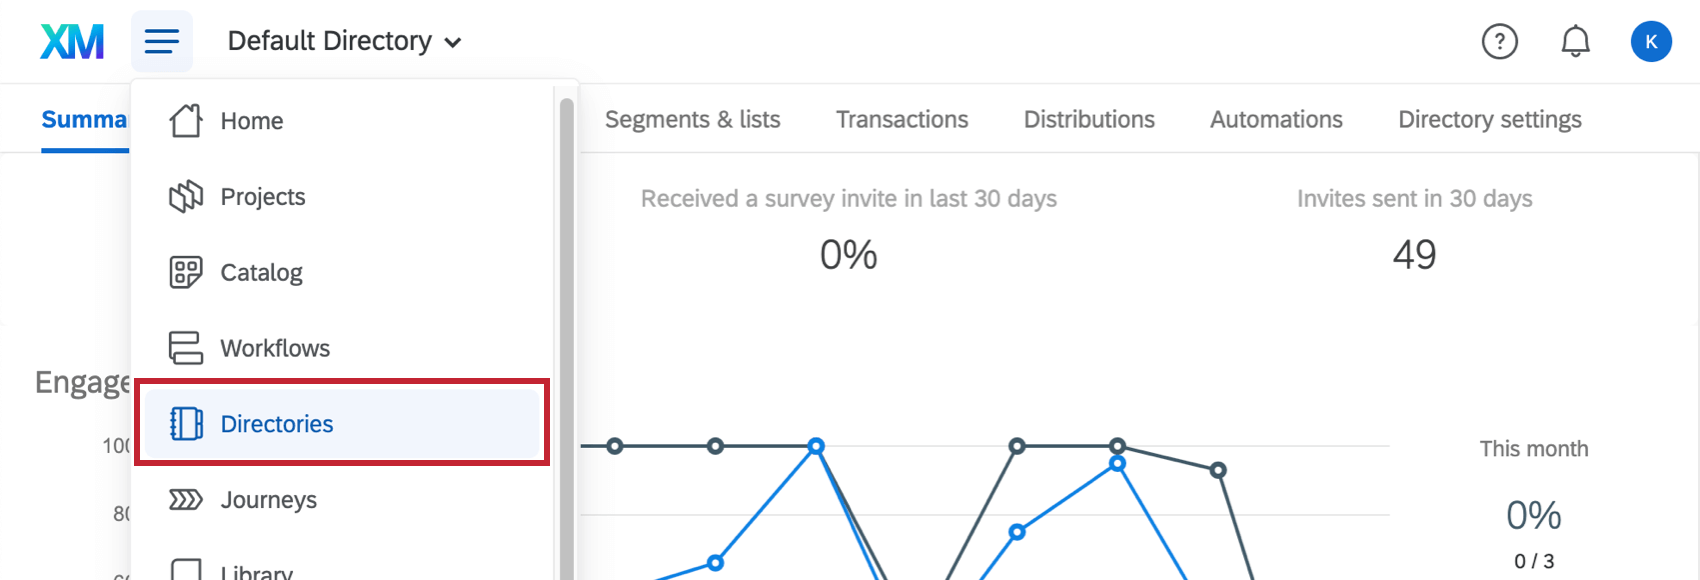
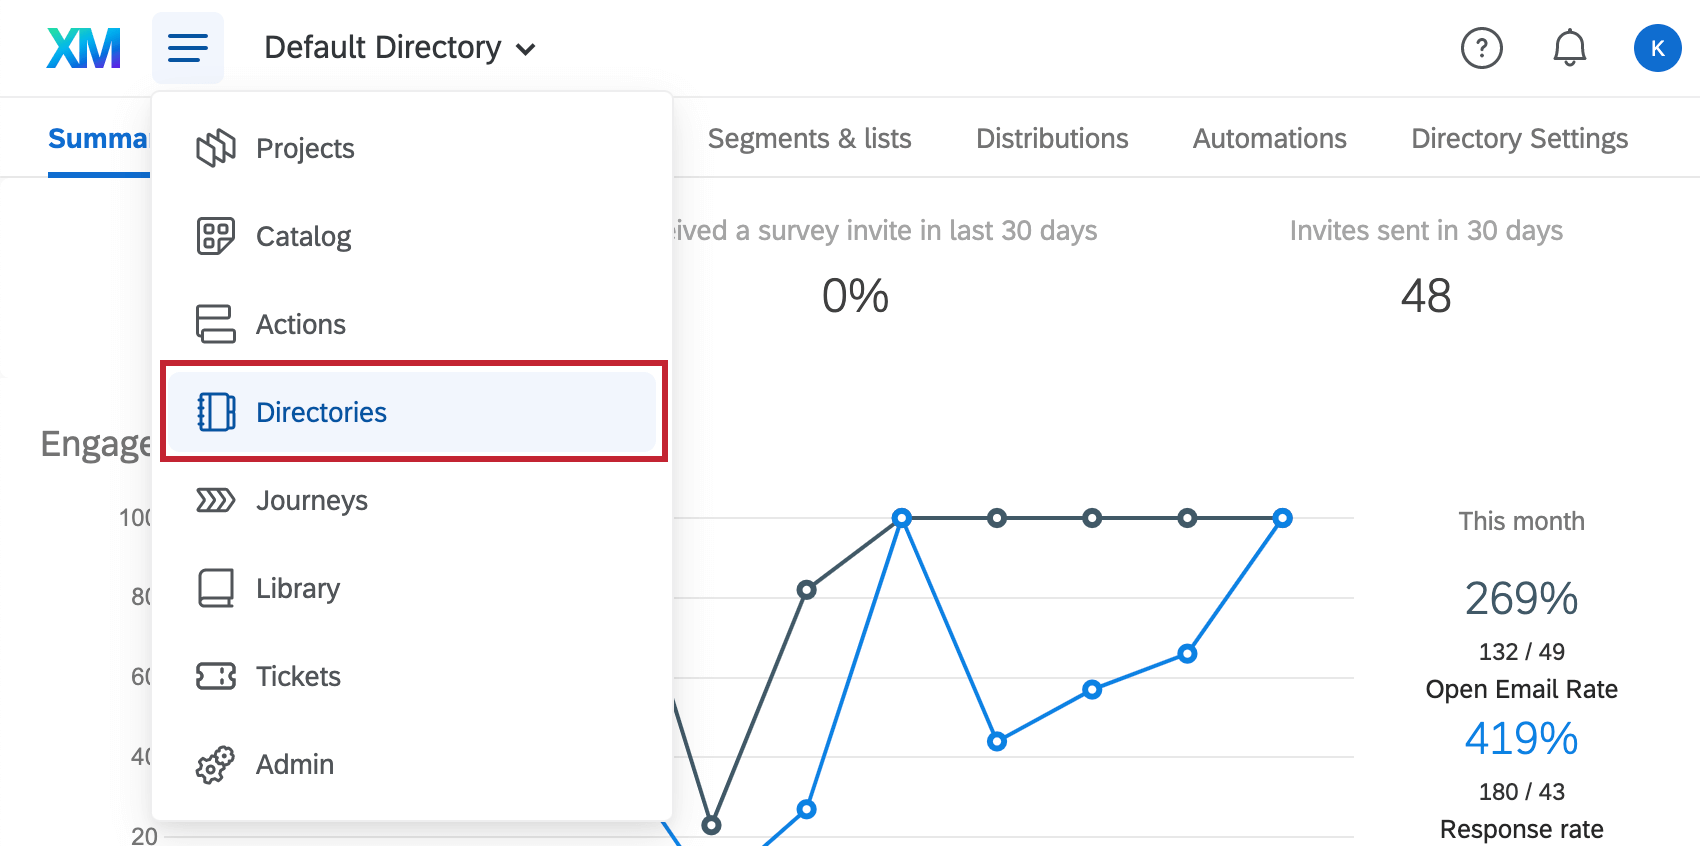
- Go to your directory by clicking Directories.
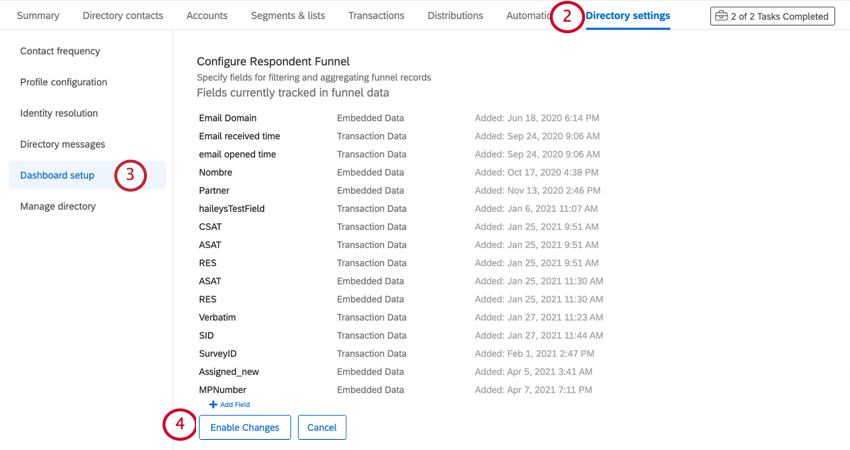
- Select Directory Settings.
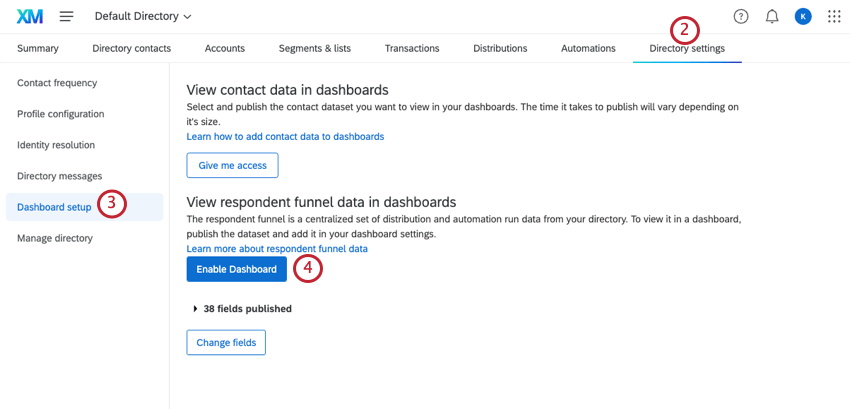
- Select Dashboard setup.
- Click Enable Dashboard.
Mapping Funnel Data
Before you can start building a dashboard about your XM Directory, you’ll need to map your funnel data to your dashboard. Your funnel data may be mapped into a dashboard with up to 20 other survey data sources. Note that Respondent Funnel records event data as events occur, and will not update if contact data changes or is deleted in the future. If you delete distributions or contacts, data from these deleted fields will still be present in Respondent Funnel.
In order to map your funnel data to the dashboard, follow the steps below.
For example, if a survey is started in September 2019 and finished in October 2019, the most recent timestamp for this funnel event would be October 2019. This event will then disappear from your dashboard in December of 2020.
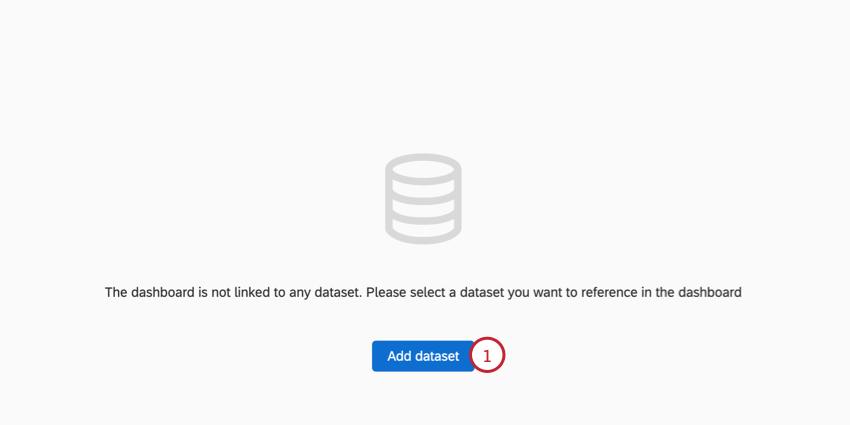
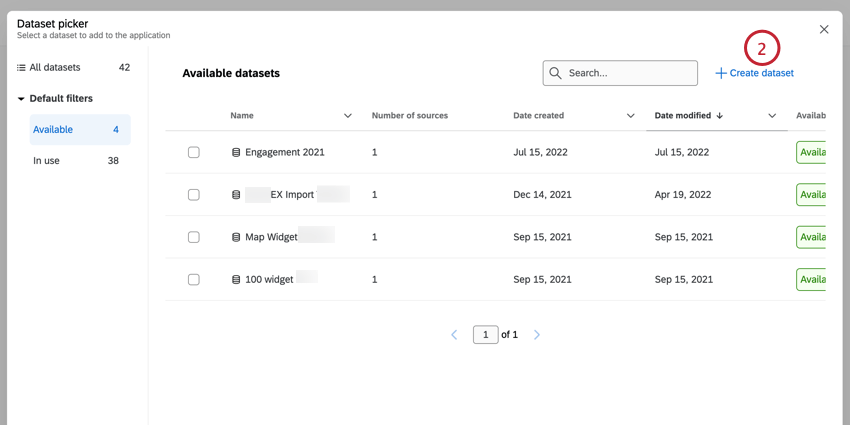
- In the dashboard data section of your dashboard, click Add datset.
- Click Create dataset.
- Name the dataset.
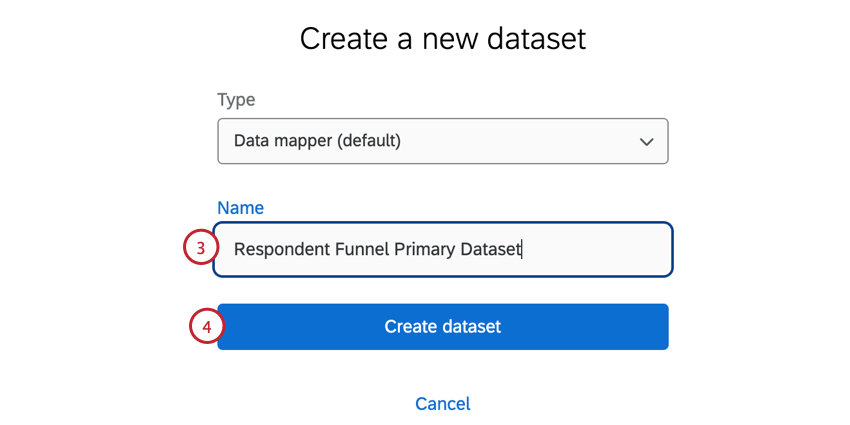
- Click Create dataset.
- Click Add Source.
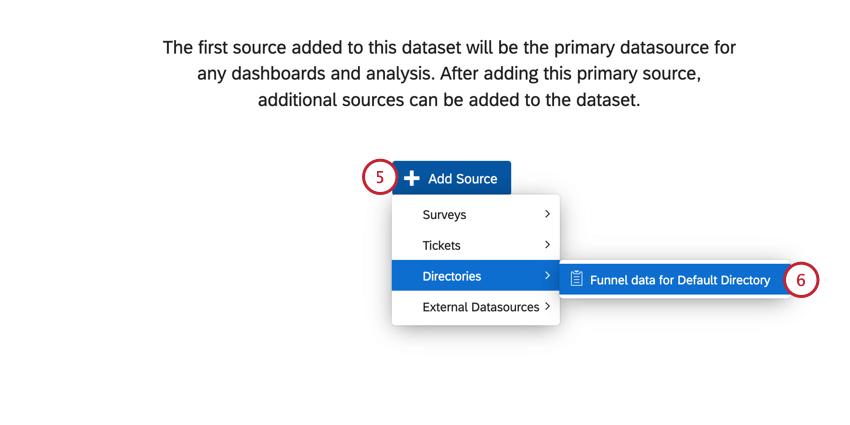
- Hover over Directories and select the funnel data for the directory you want to map.
Qtip: If you have multiple directories, you will have multiple options here, provided you have enabled the respondent funnel on each of these directories.Qtip: If you recently enabled the Respondent Funnel for your directory, this funnel data may not appear in the menu for some time. This step may take several minutes to two hours.
- Deselect any fields you do not want to include.
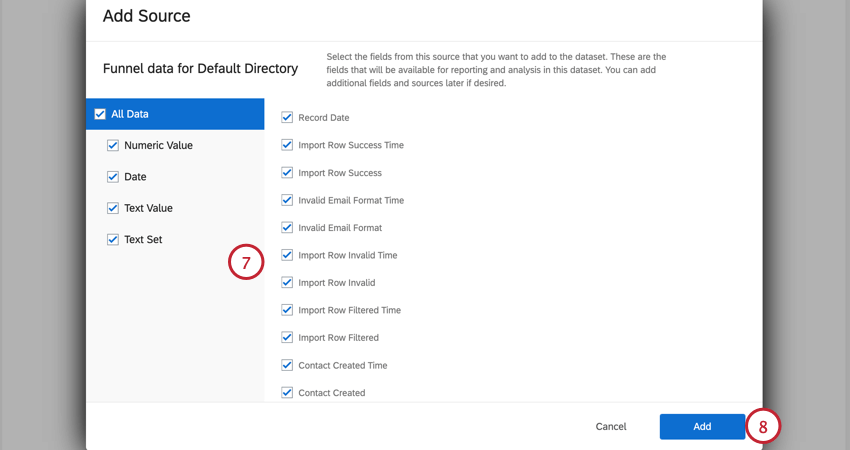
- Click Add.
Attention: New distribution events do not immediately appear in the dashboard and may take 24 hours to be included in reports.
Adding Respondent Funnel as a Secondary Data Source
If you add the respondent funnel to an existing dashboard with a different dataset, you will need to add and map your Respondent Funnel fields manually. For an overview of the fields to map, see Default Fields.
If you attempt to use the respondent funnel dashboard template without mapping your fields, you will see the below error message.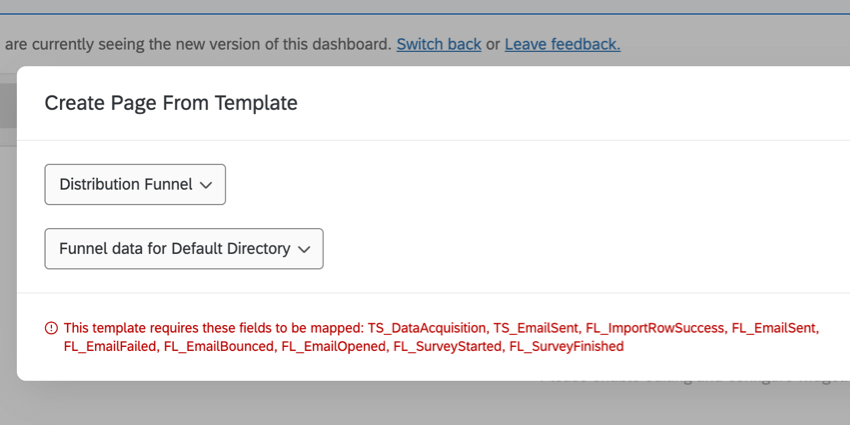
To resolve this message, map the missing fields into your dashboard. The fields you need to map are as follows:
| Error Message Field Name | Default Field Name |
| TS_DataAcquisition | Record Date |
| TS_EmailSent | Email Sent Time |
| FL_ImportRowSuccess | Import Row Success |
| FL_EmailSent | Email Sent |
| FL_EmailFailed | Email Failed |
| FL_EmailBounced | Email Bounced |
| FL_EmailOpened | Email Opened |
| FL_SurveyStarted | Survey Started |
| FL_SurveyFinished | Survey Finished |
Response Rate and Completion Rate
Before you can report on response rate and completion rate in your dashboard, you will need to add 2 custom metrics.
Response Rate
- In the dashboard settings, click on the Custom metrics page.
- Click Add Custom Metric.
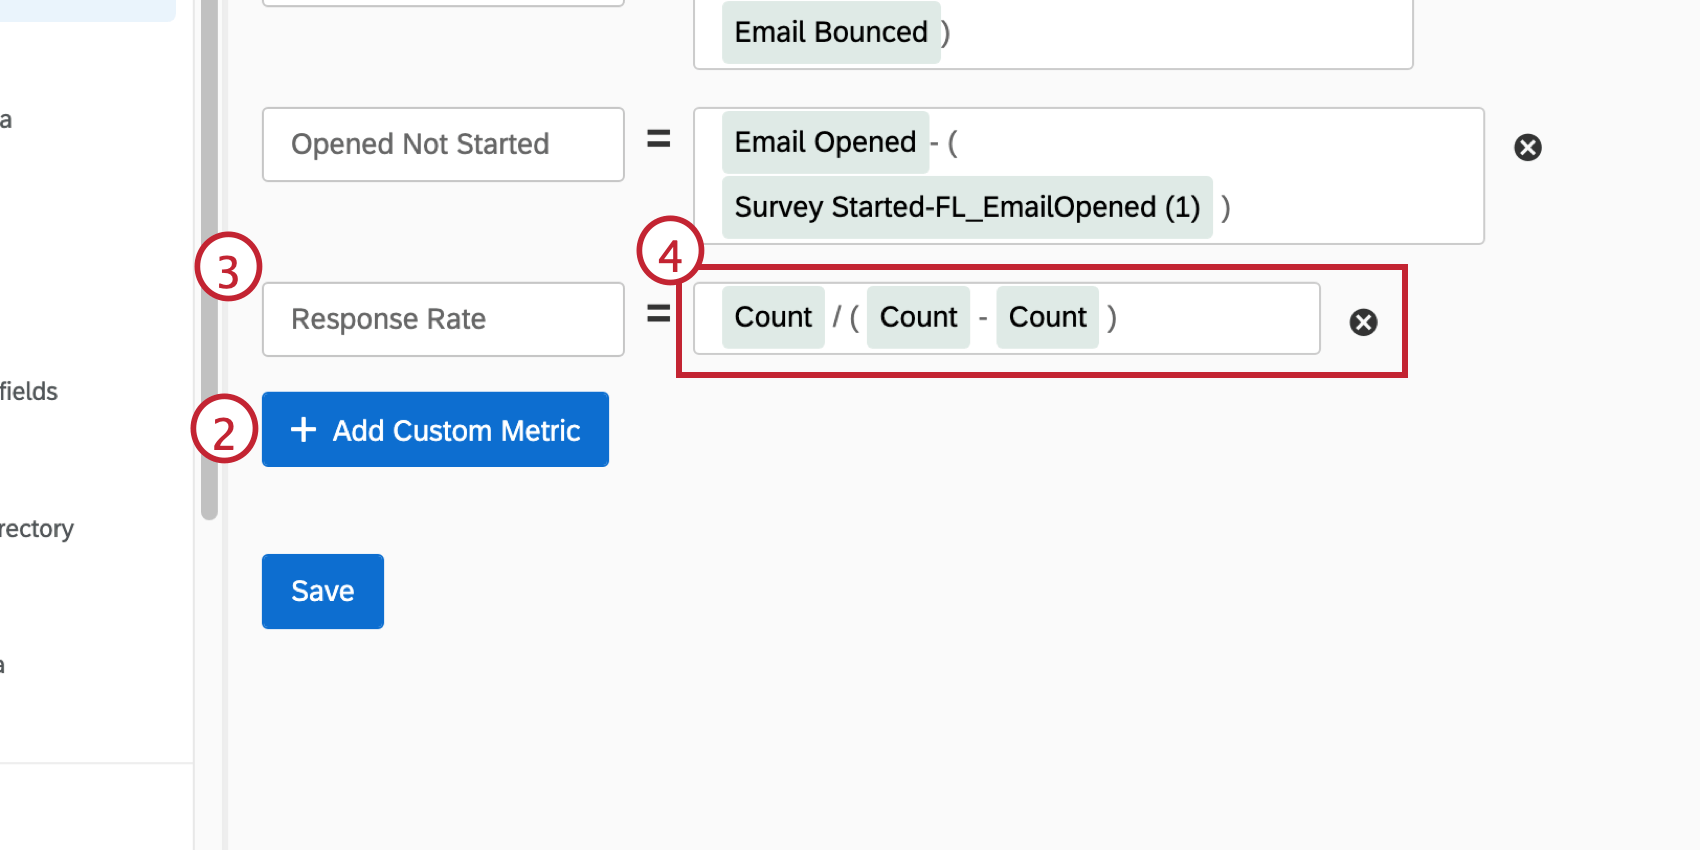
- Call it “Response Rate.”
- Add the following equation: (Count) / ( (Count) – (Count) ).
- Click the numerator.
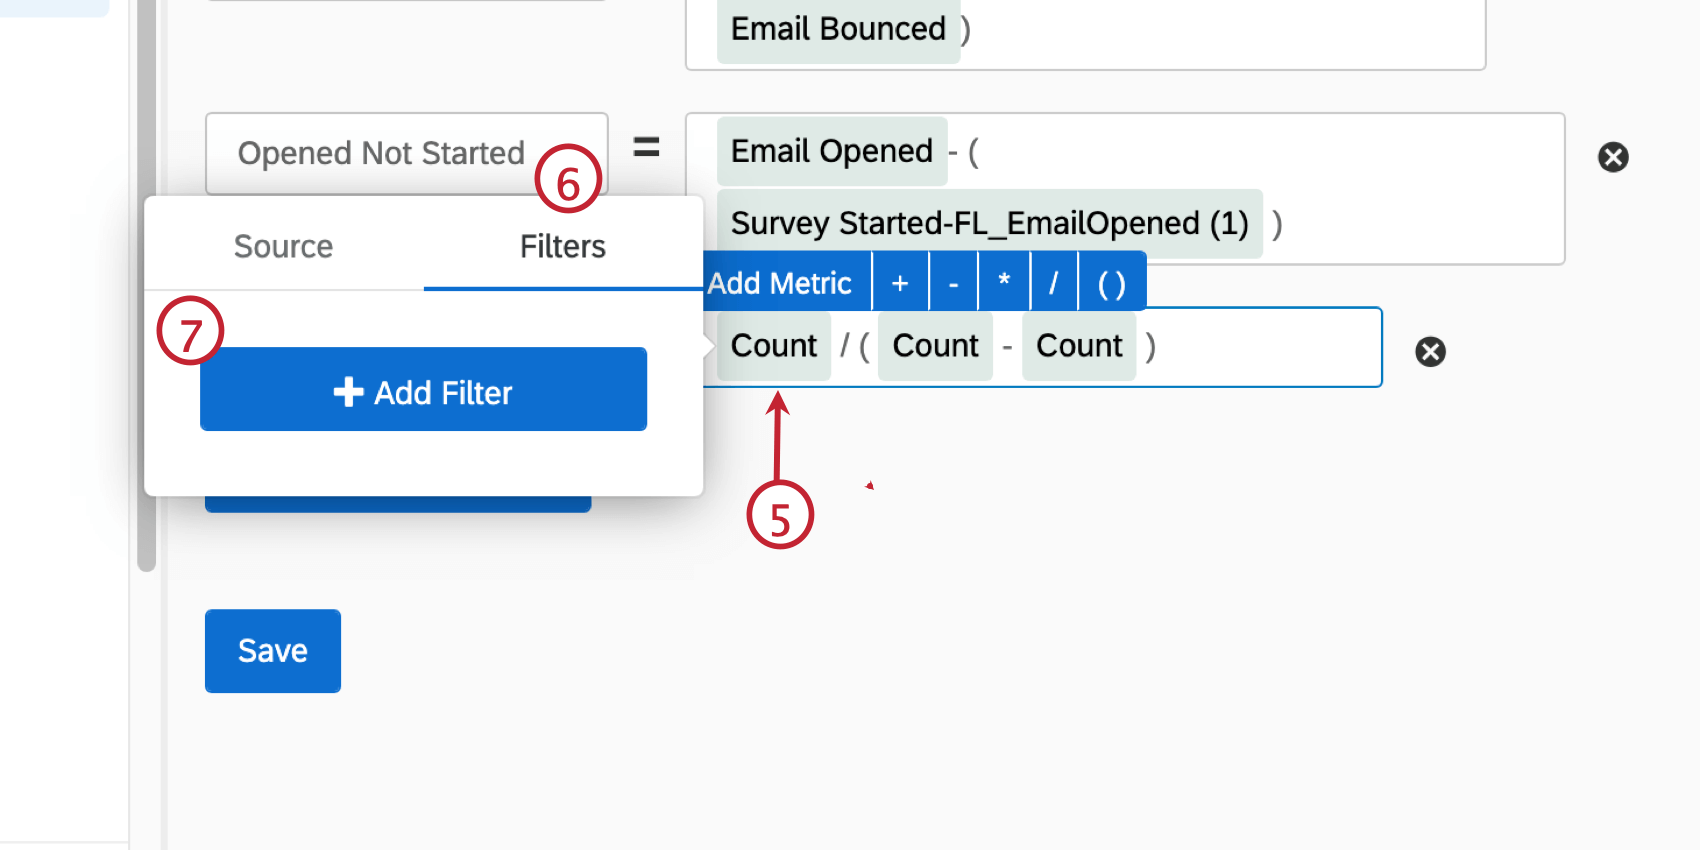
- Go to the Filters section.
- Click Add Filter.
- Select Survey Finished.
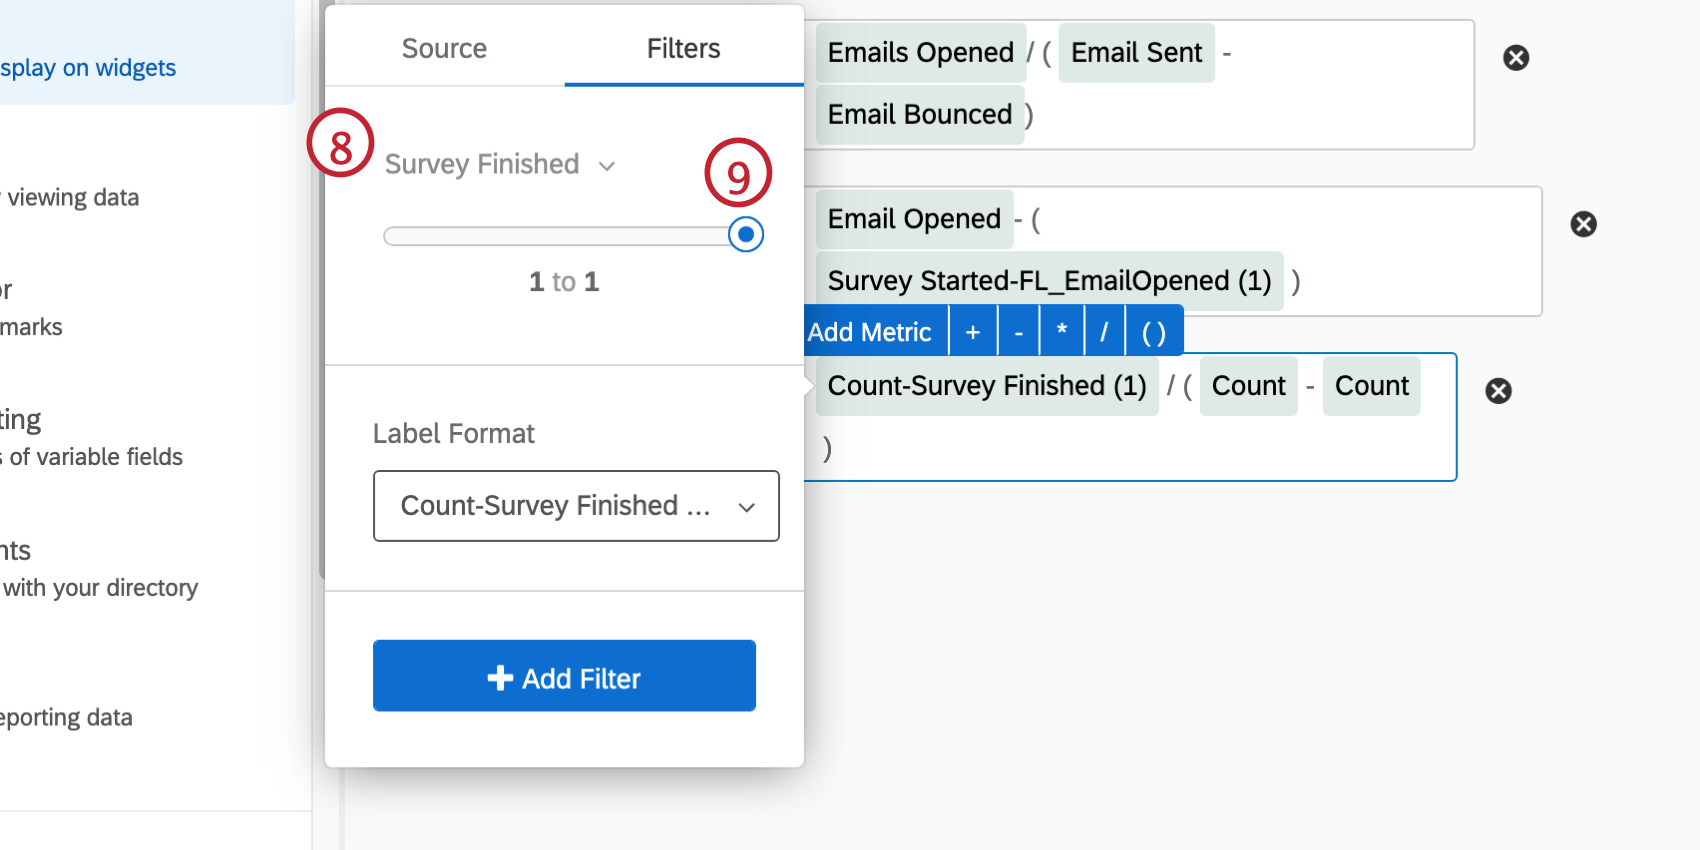
- Use the slider to select 1 to 1.
- Click the first metric in the denominator.
- Go to the Filters section.
- Click Add Filter.
- Select Email Sent.
- Use the slider to select 1 to 1.
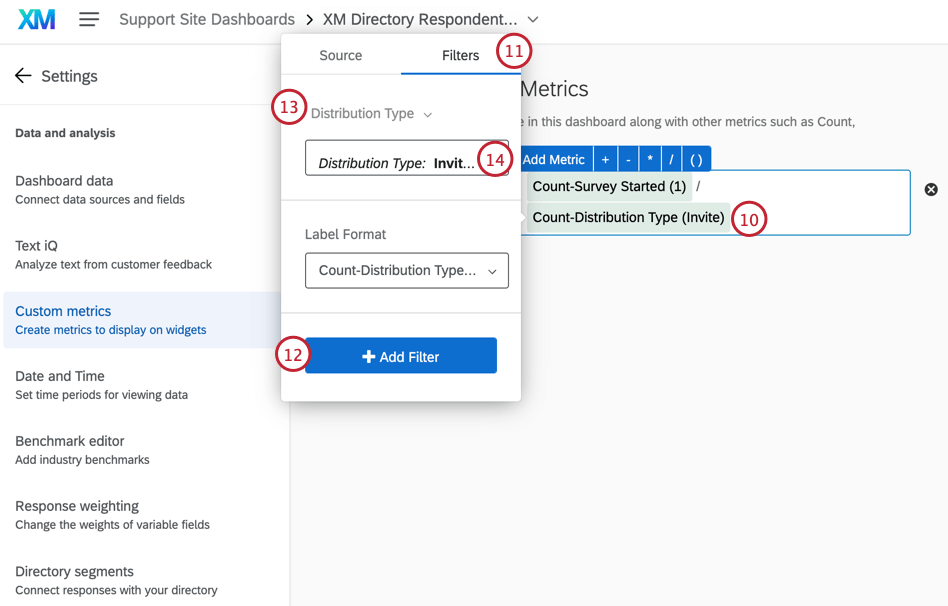
- Click the second metric in the denominator.
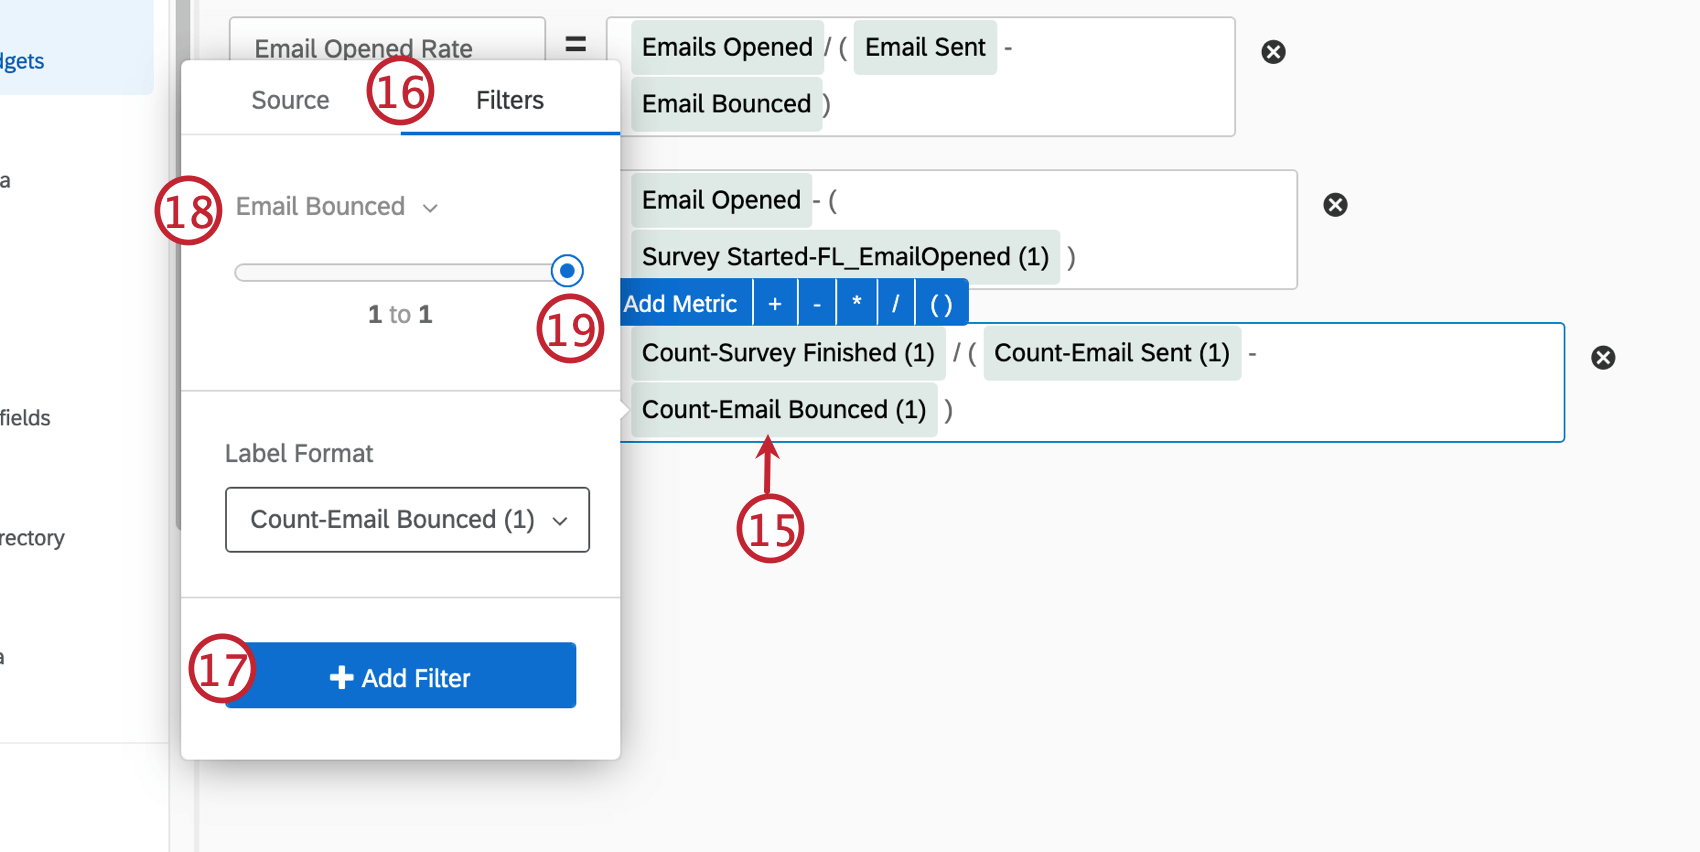
- Go to the Filters section.
- Click Add Filter.
- Select Email Bounced.
- Use the slider to select 1 to 1.
- Save your changes.
Completion Rate
- Similarly, create a second custom metric and call it “Completion Rate.”
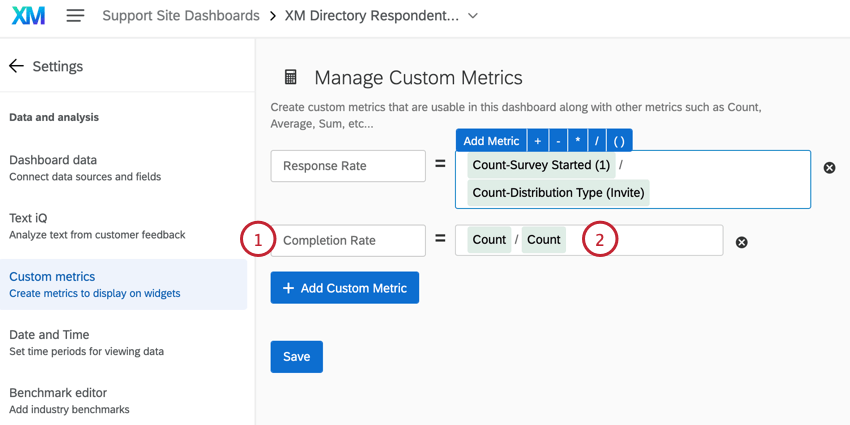
- Add the following equation: (Count) / (Count).
- Click the numerator.
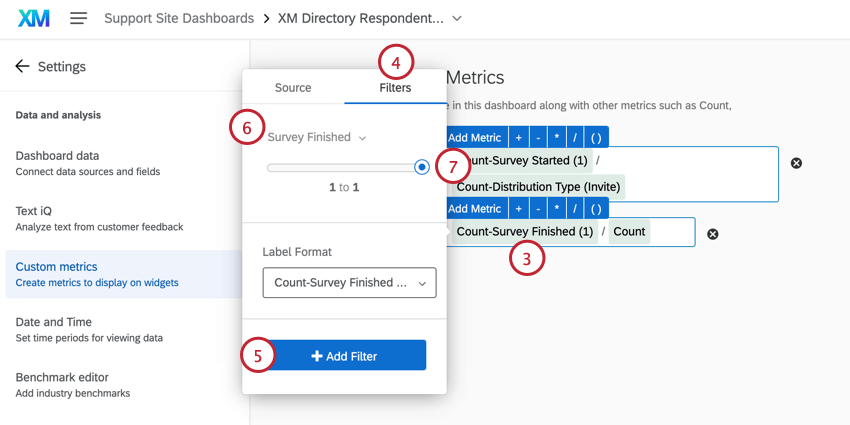
- Go to the Filters section.
- Click Add Filter.
- Select Survey Finished.
- Use the slider to select 1 to 1.
- Filter the denominator so it includes only responses where Survey Started.
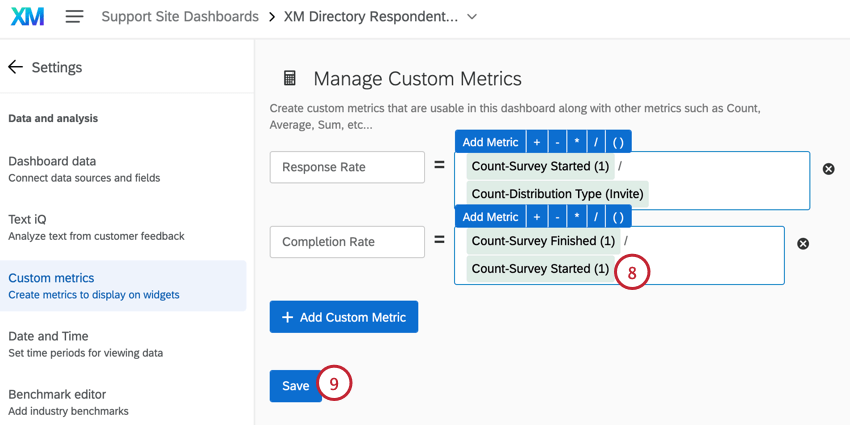
- Click Save.
Example Custom Metrics
Custom metrics help to report on respondent funnel data. There are a few common custom metrics that are useful for analyzing data:
- Emails Succeeded: (Email Sent) – (Email Bounced)
- Emails Opened: (Emails Opened) / (Email Sent) – (Email Bounced)
- Opt Out Rate: (Unsubscribed) / (Email Sent) – (Email Bounced)
- Bounce Rate: (Email Bounced) / (Email Sent)
Loading Historical Data
Once a Respondent Funnel is generated, you will automatically be able to report on all data after the feature was enabled for your brand. Loading historical data allows you also to report on data from previous distributions that was collected before the Respondent Funnel was enabled.
- Navigate to the respondent funnel you enabled.
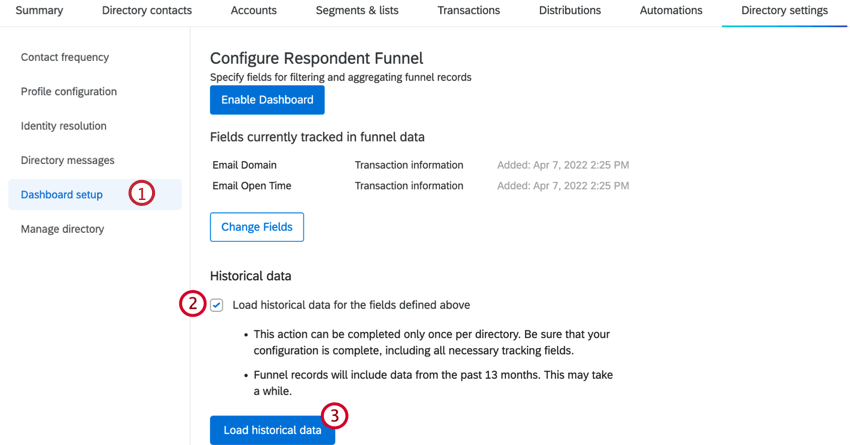
- Select the checkbox next to Load historical data for the fields defined above.
- Click Load historical data.
Attention: The option to load historical data will not appear for Respondent Funnels which were created over 13 months ago. This is because all data from that period is already stored and there is nothing additional to load in.
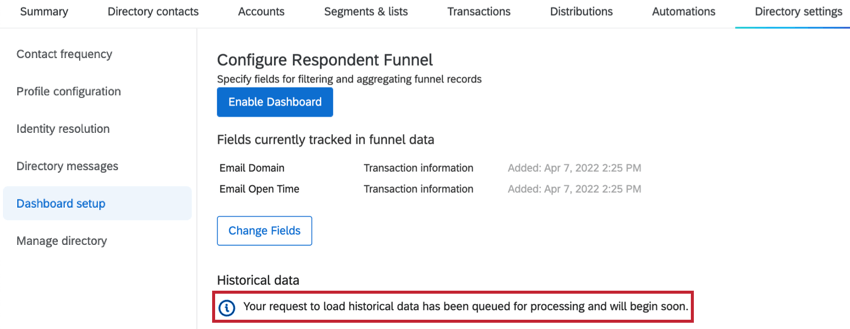
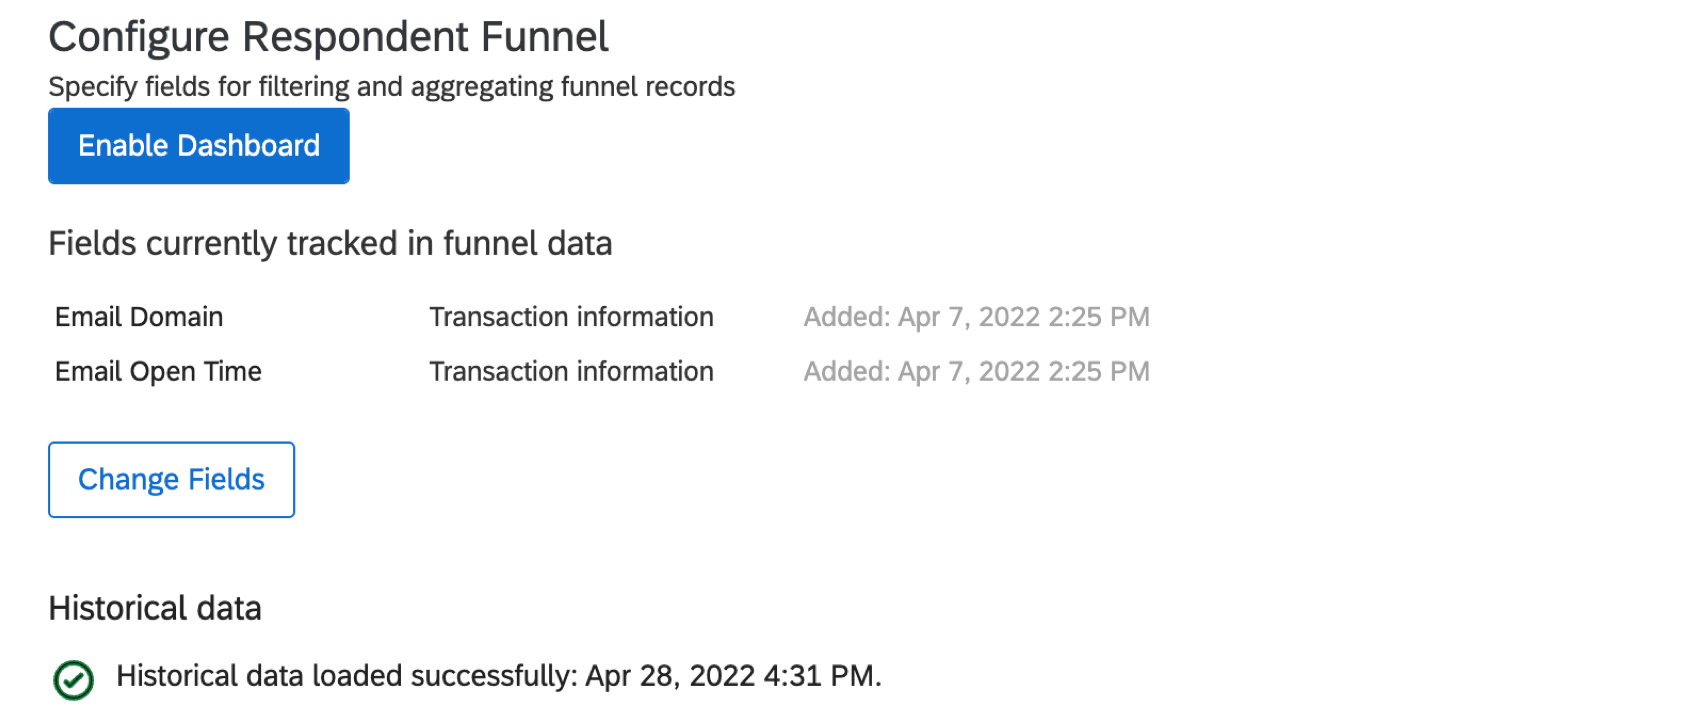
- The status of the historical data load will be displayed within the respondent funnel window.
Default Fields
Special Considerations for Fields
- Emails skipped due to Contact Frequency Rules and events related to Contact Import Automations are not automatically tracked for Respondent Funnels created after December 1, 2022. Please contact Qualtrics Support if you would like to enable tracking for these fields in your Respondent Funnel.
- When making email distribution calculations (e.g., Email Bounced, Email Opened, Email Sent), the Respondent Funnel will consider all email types. To limit what emails are used in these calculations, add a filter for the Distribution Category field and filter by your desired email type. More information about the Distribution Category field can be found in the table below.
- To view data for a specific survey, you’ll need to add a dashboard filter based on Survey ID. We recommend recoding your Survey IDs to their corresponding survey name to make filtering easier.
- Survey Finished and Survey Partial Recorded are separate fields within the Respondent Funnel. Survey Finished only includes complete responses and does not include partial responses.
- Email Sent and Email Blocked are separate fields within the Respondent Funnel. This provides a more detailed record of what happened with each sent distribution.
Default Fields Overview
Many fields will be mapped into your dashboard by default. The Field Type listed here is what fits the field the best; you may need to recode fields somewhat after mapping. See the tables below for all the fields that will be mapped in by default.
For Number Sets, the value will be 0 to imply the opposite of the description occurred. Remember Number Sets can be recoded to Text Sets to add more intuitive labelling.
Available Email Fields
| Field Name | Field Type | Description |
| Bounce Type | Text Set | If your message bounced, indicates if it was a hard of soft bounce. |
| Email Blocked | Number Set | 1 if the email was a duplicate. Duplicate emails are the same message, subject line, and recipient as another email sent within a 12-hour window. |
| Email Blocked Time | Date | DateTime that the email was blocked by the recipient. |
| Email Bounced | Number Set | 1 if the sent email bounced. Bounced emails left Qualtrics, did not reach the recipient’s inbox, and were returned to Qualtrics servers. |
| Email Bounced Time | Date | DateTime that an email bounced. |
| Email Duplicate | Number Set | An older field that is no longer used. |
| Email Duplicate Time | Date | DateTime that an email was determined a duplicate and not sent. |
| Email Failed | Number Set | 1 if the email was attempted but failed to send. There are many reasons why emails can fail. The most common reason is an incorrectly formatted email address. |
| Email Failed Time | Date | DateTime that an email failed to send. |
| Email Opened | Number Set | 1 if the email was opened after being sent out. |
| Email Opened Time | Date | DateTime that an email was opened by the recipient. |
| Email Sent | Number Set | 1 if Qualtrics sent the email. Email Sent includes email survey invitations and reminder and thank you emails, as well as SMS invitations. |
| Email Sent Time | Date | DateTime that an email successfully sent. |
| Email Skipped | Number Set | 1 if this email was not sent due to contact frequency rules. This field is no longer tracked for funnels enabled on or after December 1, 2022. |
| Email Skipped Time | Date | DateTime that an email was not sent due to Contact Frequency rules. This field is no longer tracked for funnels enabled on or after December 1, 2022. |
| Invalid Email Format | Number Set | 1 if this row had an invalid email address format. |
| Invalid Email Format Time | Date | DateTime the email format was determined invalid. |
Available Distribution Fields
| Field Name | Field Type | Description |
| Distribution Category | Text Set | Indicates the category of email that sent. Values include Invite, Thank You, Reminder, and Other. You can add this field as a dashboard filter to easily allow you to filter based on different categories of emails. |
| Distribution Channel | Text Set | The method used to distribute your message. Possible values include Email, GeneratedLink, Intercept, SMS, Unknown, and WhatsApp. |
| Distribution ID | Text Set | Qualtrics Distribution ID. This value will be blank if no distribution was scheduled for this transaction. |
| Distribution Type | Text Set | Indicates the type of distribution that sent. Since there are many different distribution types, there’s a large set of possible values for this field. |
Available Contact Fields
| Field Name | Field Type | Description |
| Contact Directory Subscribed | Number Set | Indicates if the contact resubscribed via the opt-out link to the directory. 1 if a contact subscribed from the link in the survey email, and 0 if a contact either does not click the opt-out link or clicks the opt-out via the distribution email. Note, this will only update if the contact subscribes via the opt-out link in their email invitation. Manually changing a contact’s subscription status will not update this field. |
| Contact Directory Subscribed Time | Date | DateTime the contact subscribed from your directory. |
| Contact Directory Unsubscribed | Number Set | Indicates whether the contact unsubscribed from the directory in response to this distribution. 1 if unsubscribed and 0 if subscribed. Note, this will only update if the contact unsubscribes via the opt-out link in their email invitation. Manually changing a contact’s subscription status will not update this field. |
| Contact Directory Unsubscribed Time | Date | DateTime the contact unsubscribed from your directory. This value will be blank if the contact is still subscribed. |
| Contact ID | Text Value | Qualtrics ID for the individual contact. |
| Contact List Subscribed | Number Set | Indicates if the contact subscribes to the list in response to this distribution. 1 if subscribed and 0 if unsubscribed. Note, this will only update if the contact resubscribes via the opt-out link in their email invitation. Manually changing a contact’s subscription status will not update this field. |
| Contact List Subscribed Time | Date | DateTime the contact subscribed to the contact list. |
| Contact List Unsubscribed | Number Set | Indicates if the contact unsubscribed from the list in response to this distribution. 1 if unsubscribed and 0 if subscribed. Note, this will only update if the contact unsubscribes via the opt-out link in their email invitation. Manually changing a contact’s subscription status will not update this field. |
| Contact List Unsubscribed Time | Date | DateTime the contact unsubscribed from the contact list. This value will be blank if the contact is still subscribed. |
| Directory ID | Text Set | Qualtrics Directory ID. This can be helpful for differentiating between multiple directories. |
| Email Address | Text Value | Email of the XM Directory contact. |
| External Data Reference | Text Value | The External Data Reference of the XM Directory contact. |
| First Name | Text Value | FirstName of the XM Directory contact. |
| Language | Text Set | Language of the XM Directory contact. |
| Last Name | Text Value | LastName of the XM Directory contact. |
| List ID | Text Set | ID of the mailing list the contact was added to. |
| Phone Number | Text Value | Phone number of the XM Directory contact. |
| RecipientID | Text Set | The contact’s ID within a specific mailing list. |
Available Survey Fields
| Field Name | Field Type | Description |
| Response ID | Text Value | Qualtrics Response ID; blank if no survey response was collected for this transaction. |
| Survey Finished | Number Set | 1 if the recipient finished the survey. |
| Survey Finished Time | Date | DateTime that the contact clicked the final “Submit” button to complete the survey. |
| Survey ID | Text Set | Qualtrics Survey ID. This value will be blank if no distribution was scheduled for this transaction. |
| Survey Partial Recorded | Number Set | 1 if the survey is an incomplete response. |
| Survey Partial Recorded Time | Date | DateTime the incomplete response was recorded. |
| Survey Response Screened Out | Number Set | 1 if the recipient was screened out of the survey. |
| Survey Response Screened Out Time | Date | DateTime that a contact was screened out of a survey. |
| Survey Started | Number Set | 1 if the recipient started the survey. |
| Survey Started Time | Date | DateTime that the contact started the survey. |
Available Automation Fields
| Field Name | Field Type | Description |
| Automation ID | Text Value | Qualtrics Automation Run ID. This field is used for custom Qualtrics implementations. If you do not have a custom solution, we recommend that you do not use this field. |
| Contact Create Failed | Number Set | 1 if the contact was unsuccessfully created as the result of an import. |
| Contact Create Failed Time | Date | DateTime that a contact was unsuccessfully created as a result of an import. |
| Contact Update Failed | Number Set | 1 if a contact failed to be updated. |
| Contact Update Failed Time | Date | DateTime that a contact was not successfully updated as a result of an import. |
| File Name | Text Set |
If present, name of the automation source file that this transaction was imported from. This is only included for unsuccessfully processed rows. |
| Import Row Filtered | Number Set | 1 if automation filtered out (did not import) this row. |
| Import Row Filtered Time | Date | DateTime that a row was filtered by the automation. This value will be blank if the row was not filtered. |
| Import Row Invalid | Number Set | 1 if automation rejected this row as invalid. |
| Import Row Invalid Time | Date | DateTime that a row was considered invalid by the automation. This value will be blank if the row was not filtered. |
| Import Row Success | Number Set | 1 if automation attempted to import a row and the import succeeded. This will only be populated if the automation imported transactional data. |
| Import Row Success Time | Date | DateTime that a row of the automation was imported into XM Directory. This will only be populated if the automation imported transactional data. |
| Row Number | Text Value | Row number in the automation source file that a given transaction was imported from. This value is not always present. |
| Transaction Created | Number Set | 1 if a transaction was created for this row. |
| Transaction Created Time | Date | DateTime that a transaction was created. |
| Transaction Create Failed | Number Set | 1 if the transaction failed. |
| Transaction Create Failed Time | Date | DateTime that a transaction failed. |
| Transaction ID | Text Value | Qualtrics Transaction ID. |
Available Filter Fields
| Field Name | Field Type | Description |
| Filtered Category | Text Set | Categories are: Duplicate, NoDistributionSettings, NoLookup, Excluded, BadDistributionDate, ImproperFormat, MissingRequiredColumns, and OverQuota. |
| Filtered Reason | Text Set | An additional clarifying message about the category will be included with categories Excluded and MissingRequiredColumns. |
Miscellaneous Fields
| Field Name | Field Type | Description |
| Record Date | Date | DateTime that the record was recorded in the Respondent Funnel fieldset. The Record Date field can be nice for some users because all the different event dates are aggregated into one place; however there is a small lag between the event’s occurrence and when it is actually recorded in the fieldset. If users want to use the most accurate information, it is best to use the event-specific fields like Email Sent Time, Email Skipped Time, etc. |
Enabling Additional Fields
In order to report on transactional data or contact embedded data not included in the default fields, you will need to complete the following steps.
You should try to complete this step before users map their Respondent Funnel data, but it’s okay if you don’t. If data has already been mapped, then these fields can be added as new fields to Dashboard Data.
- Go to your directory by selecting Directories.
- Go to the Directory Settings.
- Select Dashboard setup.
- You may need to select Change Fields.
- Click Add Field.
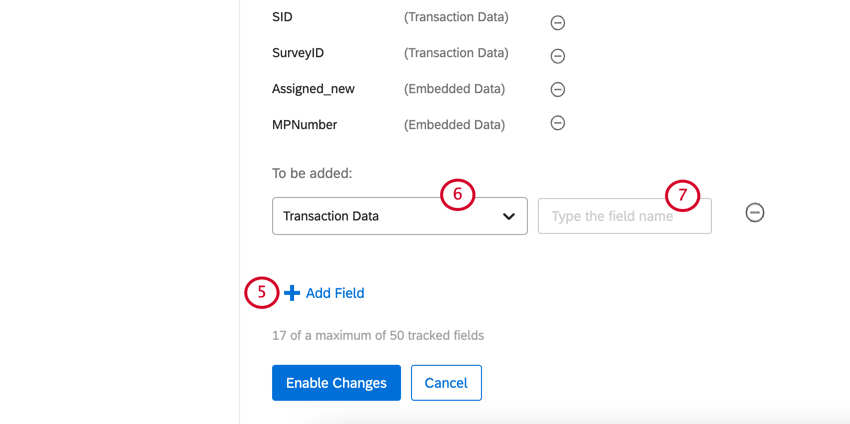
- Determine if the field you’re adding is transactional data or embedded data.
- Type the name of the field. Be careful to use the exact same spelling, capitalization, and spaces.
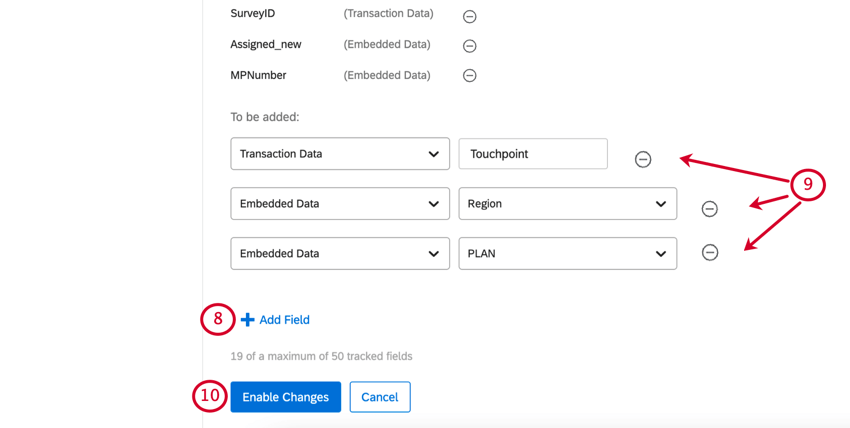
- Click Add Field to add another field.
 Attention: You can remove and add new fields as you need, but you can have no more than 50 fields at one time.
 - Click Remove to remove a field from the Respondent Funnel.
- Click Enable Changes to add these fields as possible Fields mapped in a Respondent Funnel.
Please note that fields added here are not retroactive. The Respondent Funnel can only report on data fields that were configured when a distribution originally sent. If a data field is added here after a distribution has already sent, you will not be able to report on the data field for that distribution. However, you will be able to report on that data field for future distributions.
Mapping Additional Fields
If you enable additional fields before creating your dashboard, your fields will be automatically mapped for you. However, if you add these fields after creating your dashboard, you may need to manually map your fields by following the steps below.
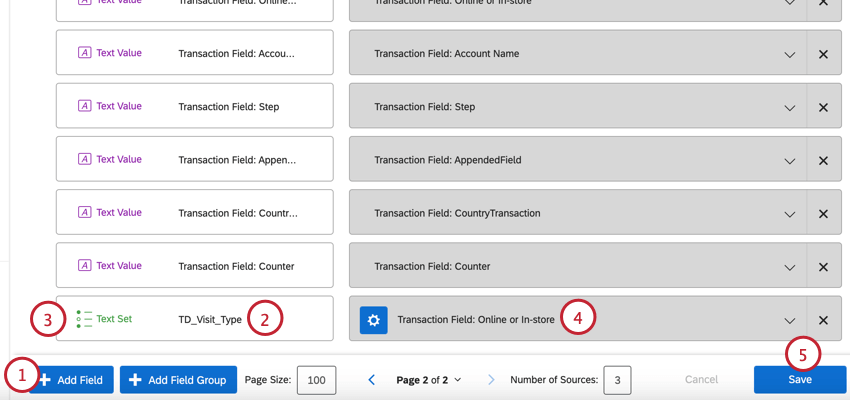
- In your dashboard data, click Add Field.
- Give your field a name. When naming your field, add a prefix to the field’s name that specifies if the field is embedded data or transaction data. Add ED_ for embedded data or TD_ for transaction fields.
Example: If I want to map the transaction field, “Visit_Type,” then my field name in my dashboard will be “TD_Visit_Type.”
- If needed, adjust the field type for your mapping.
- Select the embedded data or transactional data field that you want to display in your dashboard.
- Click Save.
Using the Respondent Funnel Template
After you map your funnel data into a separate dashboard, you can technically build your dashboard however you want. This template is meant to make things easier by providing a complete report with a clean, strategic layout for your data.
- While editing your dashboard, click Add in the Pages menu.
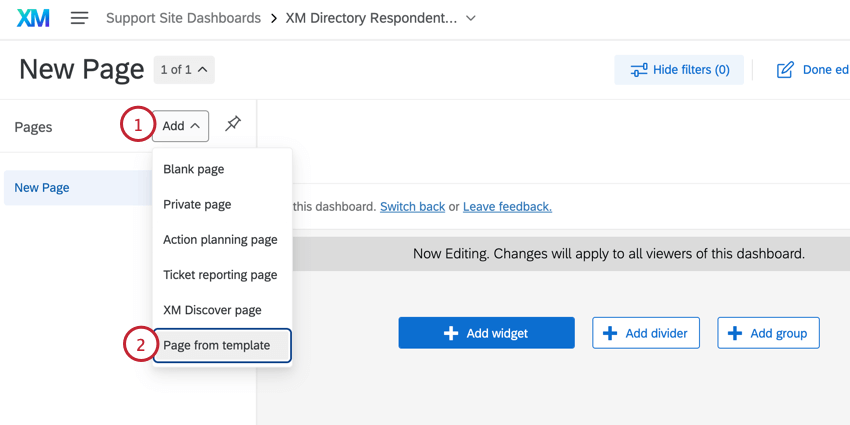
- Select Page from template.
- Select the Distribution Funnel template.
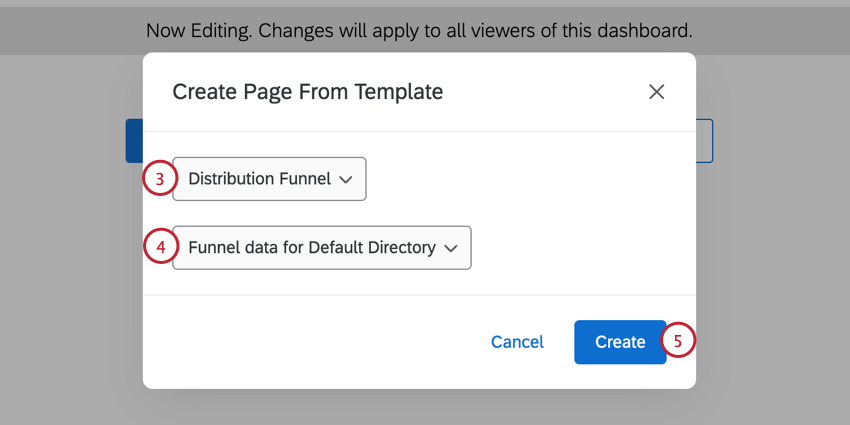
- Select the funnel data for the directory you’d like to report on.
Qtip: If you have multiple directories, you will have multiple options here, provided you have enabled the respondent funnel on each of these directories.
- Click Create.
Troubleshooting
Comparing Response Data and Respondent Funnel Fields
Sometimes when you’re comparing the data in your standard dashboard to your respondent funnel, you’ll notice a difference in response rates. This is to be expected, because there are some fields that don’t perfectly match between respondent funnels and survey response data.
| Respondent funnel field | Survey response field | Description |
| Survey Started Time | Start Date | The time the respondent clicked the survey link. |
| No match | End Date | The last time the respondent accessed the survey link. |
| Survey Finished Time | Recorded Date | The time the survey was recorded, either by the client seeing the end of survey message or by their response in progress being closed by the system. |
| Record Date | No match | The time the record was created in the funnel. This is typically the time of distribution. |
| Survey Finished = 1
Survey Partially Finished = 0 |
Survey Finished = True | A true “finished” survey is one where the respondent saw the end of survey message. |
| Survey Finished = 0
Survey Partially Finished = 1 |
Survey Finished = False | A false survey finish is one where the respondent didn’t see the end of survey message and their response was closed by the system according to the incomplete survey options. |