 XM Knowledge Base
NPS® is often held up as the gold standard customer experience metric. First developed in 2003 by Bain and Company, it’s now used by millions of businesses to measure and track how they’re perceived by their customers.
It measures customer perception based on one simple question:
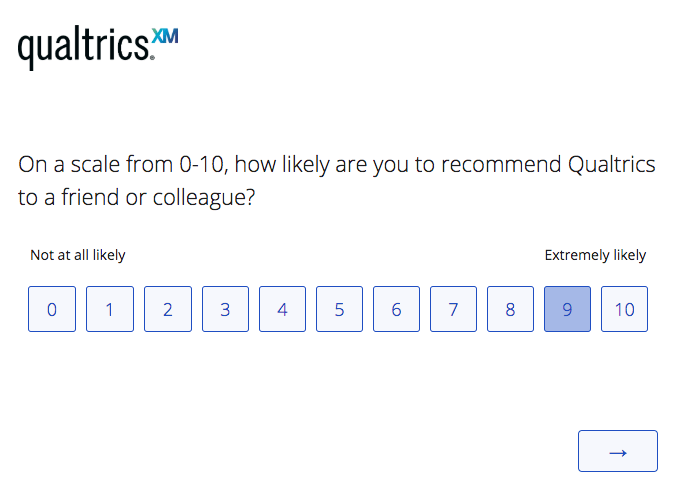
How likely is it that you would recommend [Organisation X/Product Y/Service Z] to a friend or colleague?
Respondents give a rating between 0 (not at all likely) and 10 (extremely likely) and, depending on their response, fall into one of 3 categories to establish an NPS score:
- Promoters respond with a score of 9 or 10 and are typically loyal and enthusiastic customers.
- Passives respond with a score of 7 or 8. They are satisfied with your service but not happy enough to be considered promoters.
- Detractors respond with a score of 0 to 6. These are unhappy customers who are unlikely to buy from you again, and may even discourage others from buying from you.

Detractors
(score 0-6) are unhappy customers who can damage your brand and impede growth through negative word-of-mouth

Passives
(score 7-8) are satisfied but unenthusiastic customers who are vulnerable to competitive offerings.

Promoters
(score 9-10) are loyal enthusiasts who will keep buying and fuel growth by referring others.

Calculating your Net Promoter Score
It’s simple to calculate your final NPS score – just subtract the percentage of detractors from the percentage of promoters.
For example, if 10% of respondents are detractors, 20% are passives and 70% are promoters, your NPS score would be 70-10 = 60.
Turning detractors into promoters can impact your NPS and improve loyalty to your brand.
Learn more: How to Measure NPS
Transactional vs Relational NPS programmes
Relational NPS surveys are deployed on a regular basis (i.e. quarterly or annually). The goal is to get a periodic pulse on your customers and understand how they feel about your company overall. This data can be used to check the health of customer relationships year-on-year and provide a benchmark for company success.
Transactional NPS surveys are sent out after the customer interacts with your company (e.g. during a purchase or support call). They are used to understand customer satisfaction on a granular level and provide feedback about a very specific topic.
It’s best to use both types to understand your customer at macro and micro levels.
Learn more: Transactional vs. Relational NPS®: which should you use?
What can you measure using NPS?
You can measure almost anything using NPS. In addition to understanding the overall NPS for your organisation, you can track scores for everything from individual products, stores, web pages, or even staff members.
Consider implementing NPS into marketing or customer experience strategy too. It can be used with industry NPS benchmarks to see how you’re doing compared to your competitors. It will help you understand your target market better and see how customers respond to your product or service, social media campaigns, and customer service agents. The goal is to gain loyal customers who become brand evangelists rather than just consumers.
Using NPS to survey and measure employees (eNPS)
While most Net Promoter Score surveys are designed to collect customer feedback, they can also be used to measure employee sentiment, or what is commonly referred to as Employee Net Promoter Score (eNPS). eNPS measures how likely your staff members are to recommend your company as a place to work.
Qualtrics recommends against using eNPS in place of other more comprehensive survey methodology such as employee engagement surveys. eNPS lacks the complexity an engagement survey has, as it’s only one question. It can be a good starting point, but doesn’t give you a complete picture of employee health, and you won’t know where to make improvements once you get the data.
Get our free Net Promoter Score template
Instant downloadHow do you create an NPS survey?
NPS surveys are relatively easy to create, but it’s important to think about the long-term data use when deciding how you’ll administer them. You could use survey software, but that will limit your ability to take action on the results because it only measures one metric.
We recommend using a Customer Experience Management Platform or NPS software to get a comprehensive view of your customers. Customer experience management platforms allow you to keep track of all the interactions your company has with your customers, both current and potential.
With this system in place, you can then use NPS data to see which touchpoints have high NPS scores and which touchpoints have lower scores. For a guide to the questions to ask in your NPS survey, read on.
Demographic questions
It’s not uncommon to start an NPS survey with demographic questions like age, gender, income, etc. This response data can be helpful when you are creating segmentation during your research and analysis. However, you should try to avoid demographic questions in the survey if they are not needed, or if you can get the answers from data you already have in other systems, like a CRM or customer database. Remember, the fewer survey questions the better.
The Net Promoter Score question
This is the core question which will be the primary way you measure your score. The other questions mentioned are used to make the score data easier to analyse and follow up with the respondent to address their feedback.
Reason for score
In this open text question, you ask the customer their primary reason for giving the numerical score in the central NPS question. This information will help you discover the drivers for promoters and detractors in your responses.
Going through the open text feedback can be a time-consuming process, so consider using a text analysis tool like Text iQ. If you are fielding more than a few dozen responses in your distribution a text analysis tool will save you a lot of time.
How can we make your experience better?
In this question, you ask the respondent to suggest what you can do to improve their experience. This can be helpful if you are planning to do closed-loop follow up and customer ticketing with your respondents. If you know this answer you already have a headstart to resolving the issue directly with the customer.
Keep in mind that not all cases will need both the “reason for your score” and “how could we improve” questions as many times they will have the same answer. For example, if the reason they gave a bad score was long call waiting times, the way to improve the experience will probably be to shorten wait times.
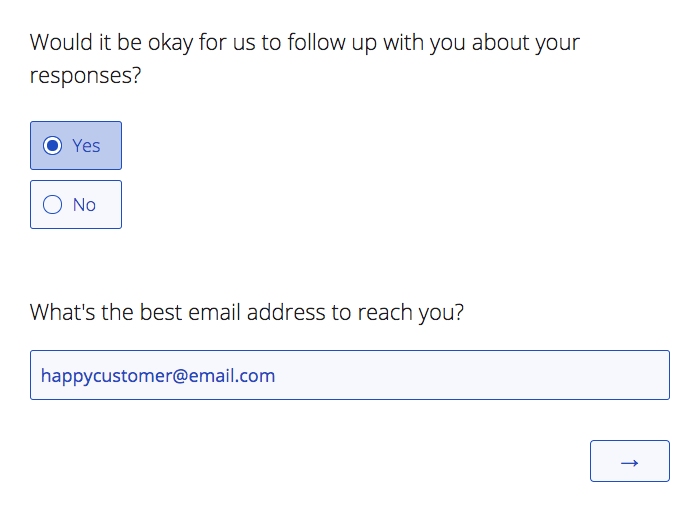
Permission to follow up with the customer
It’s good practice to ask the survey respondent if you can follow up with them if needed. If an issue has been raised in the survey response, not everyone will want to talk to someone about it. Depending on how your survey was distributed, you may or not have that customer’s email or phone number, so don’t forget to ask for it if you need to. Don’t ask for this information if you can get their contact info with metadata from another system, similar to the demographic question mentioned earlier.
Get our free Net Promoter Score survey template
Instant dowloadWhat can you do with your NPS score?
Remember, NPS is an indicator. It provides an overall metric to track and it allows you to monitor improvements in a product, service or organisation. But there is so much that influences NPS.
Take call centre agents, for example. One agent may have an NPS score of 78 while a colleague has an NPS of 32. Considered just on their scores, it’s almost impossible to understand why. If you understand the context that each agent is working in it might start to make sense. Perhaps the agent with the lower score is working with customers who are trying to cancel a service where the other is working with brand new clients. Naturally, these two agents will have different scores due to the customer’s experience before they contact the agent.
You might also be tracking things like Average Handling Time (AHT) or First Call Resolution (FCR) or even asking for feedback on particular traits like whether the agent was polite or helpful. These are all data points that can help you understand what’s driving your NPS score. So when you analyse the data, you can understand what’s influencing your scores.
By running a key driver analysis, you might find that AHT is the biggest driver of your NPS score, allowing you to prioritise improvements in that area. You might find too that key drivers are different for different segments like age groups or genders, so you can adapt your approach to different audiences in order to offer the experience they expect.
The more data you can collect and analyse alongside your NPS score, the more you’ll be able to understand what’s driving your customer experience, allowing you to prioritise your improvements to have the biggest impact on your customers.
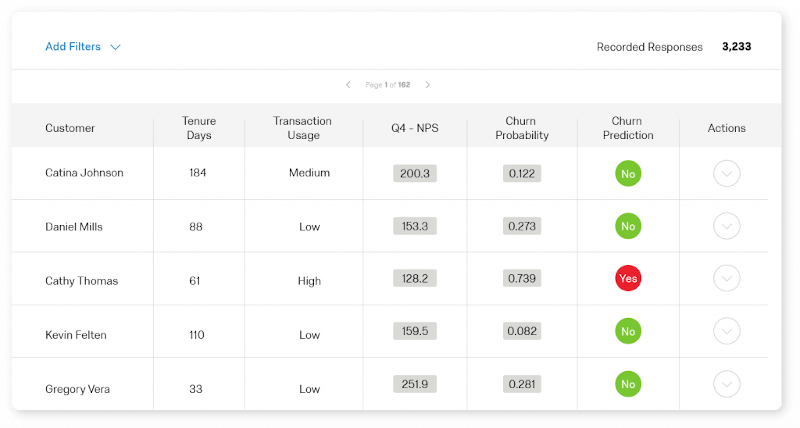
Using NPS survey responses as an input into a customer churn model
Layering together customer churn data with customer experience metrics, such as NPS, can help you predict when a customer is likely to cancel your service. This can help you link your experience data (X-data) to operation data (O-data), such as renewal rates, more closely. It can also help you win CX champions among senior leaders.
In the past, creating a customer churn model was the work of advanced statisticians, but with Qualtrics Predict iQ, you can set up a model and start identifying customers who are likely to leave and arrange for a customer care team to follow up with them.
Segmentation in your NPS survey responses
Segmenting your customers’ NPS scores is a great way to see if you notice patterns and find ways to improve certain touchpoints or experiences. Segmentation can be done by behaviour, demographic or market. You can use NPS scores along the customer journey to ask for feedback through the customer’s preferred channel, at the right moment, and monitor metrics over time.
Related NPS resources:
Get our free Net Promoter Score template