-

Qualtrics Platform -

Customer Journey Optimizer -

XM Discover -

Qualtrics Social Connect
Recorded Responses
About Recorded Responses
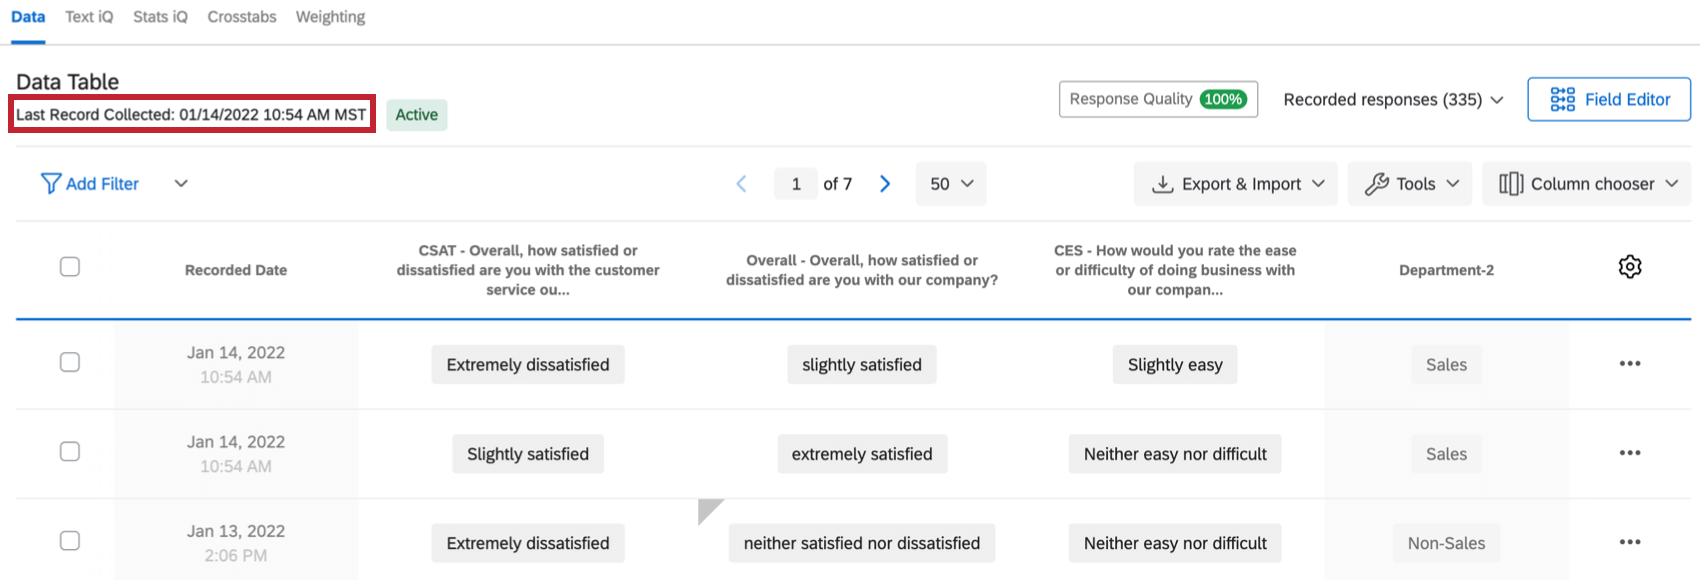
When you enter the Data & Analysis tab, you will land on the Recorded Responses page by default. Recorded responses contain all the responses recorded for your survey (that are not in progress), and includes all the data that can be displayed in reports or exported from the platform. From here, you can view and manage the data you’ve collected. On this support page, we will cover what is considered a “recorded response,” customizing columns, individual response PDFs, deleting data, and more.
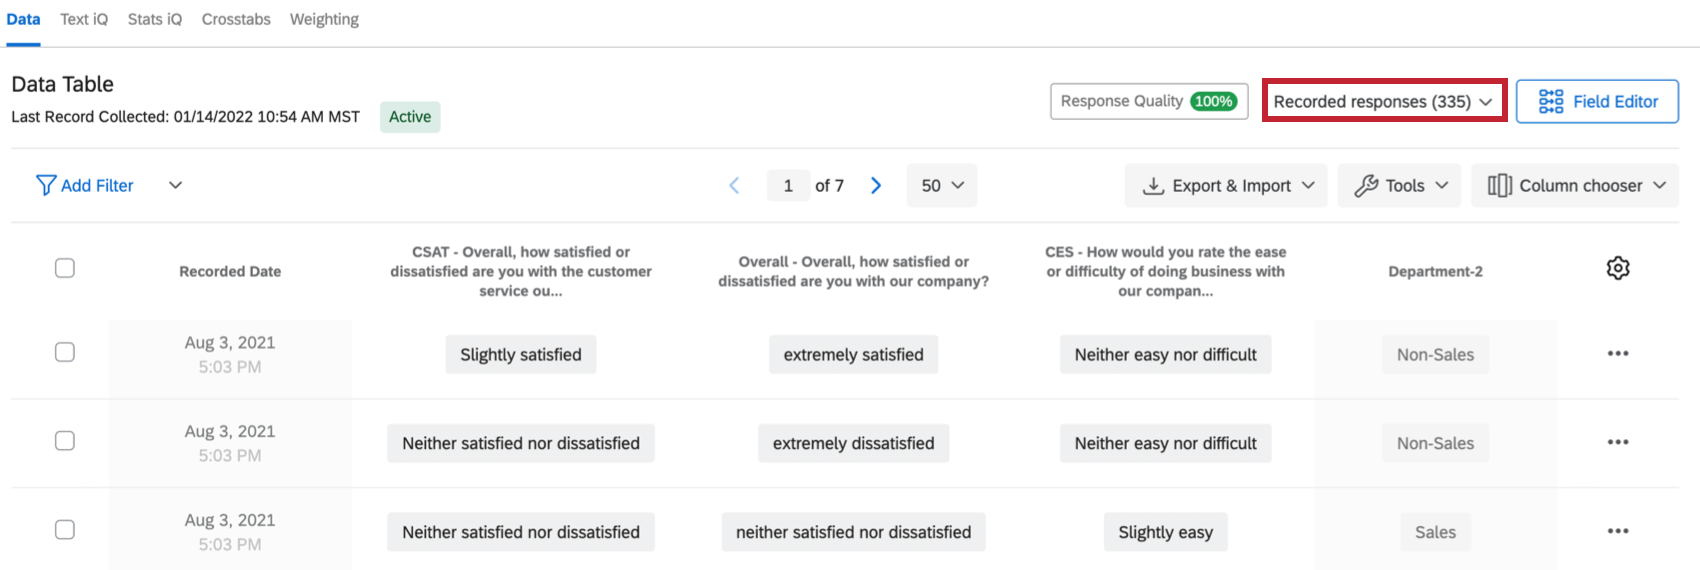
The number of recorded responses displays in the top-right corner of the Recorded Responses page.
What Counts as a Recorded Response?
Recorded responses include any survey response that is completed or incomplete responses that were closed. This includes:
- Responses that were 100% completed by the respondent.
- Responses where the respondent got all the way to the end of the survey, even if they skipped
- Preview, test, and imported responses.
- Responses uploaded from the offline app.
- Incomplete survey responses that were manually closed out from the Responses in Progress page.
- Incomplete survey responses that were automatically closed due to the incomplete survey responses survey option.
Only recorded responses are used in Text iQ, Stats iQ, Crosstabs, and both types of reports.
Dataset Update Frequency
Depending on how frequently your dataset is updated, your Data section will return a specific dataset update status. This status allows you to get a quick understanding of how frequently your dataset is updated with new responses.
Dataset Update Statuses
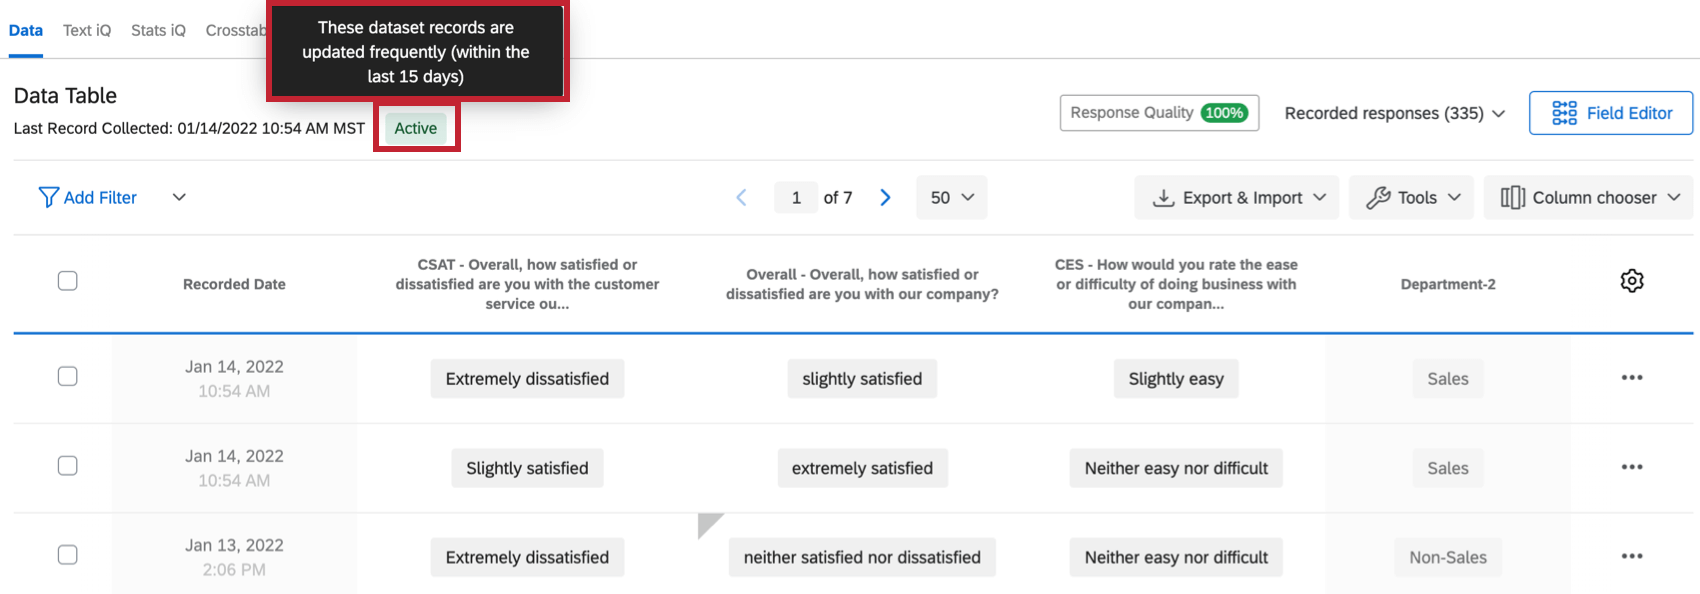
There are 3 possible dataset update statuses you’ll be able to see: Active, Partially active, or Inactive.
- Active: This dataset is updated frequently (within the last 15 days).
- Partially active: This dataset is updated occasionally (within the last 15-30 days).
- Inactive: This dataset is updated infrequently (hasn’t been updated in more than 30 days).
You can view more information about your dataset records by hovering over the Active, Partially active, or Inactive status in your Data section. When you hover over the status, a tooltip will appear with more details about the update status of your dataset.
Navigating Pages of Responses
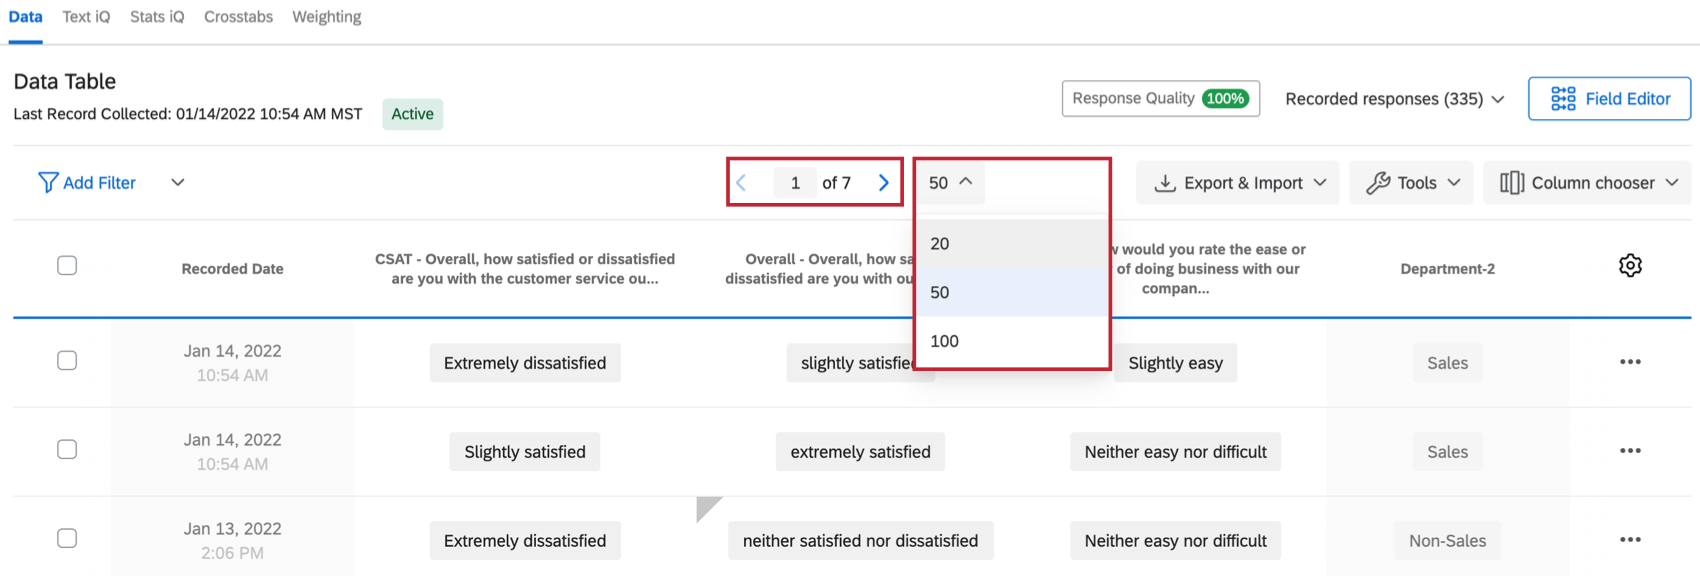
You may collect more responses than can appear on 1 page. Use the table navigation at the top of the table to view additional responses. You can click the page number and enter a specific page to view, as well as select how many records to display on 1 page.
Viewing Individual Responses
- Navigate to the Data & Analysis tab.
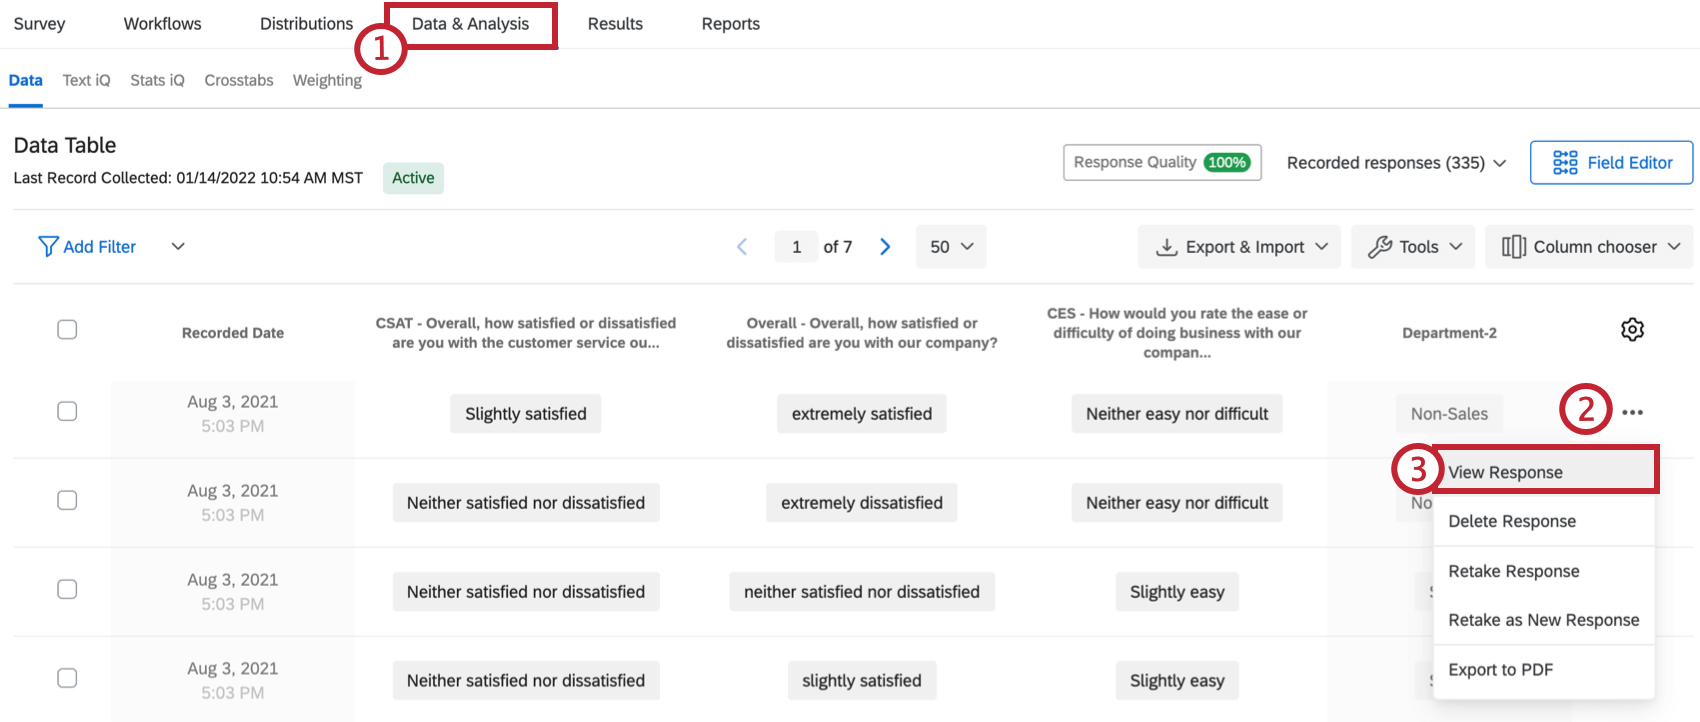
- Find the response you want to view, and click the 3 dots to the far-right under the gear icon.
- Choose View Response.
- View the response summary.
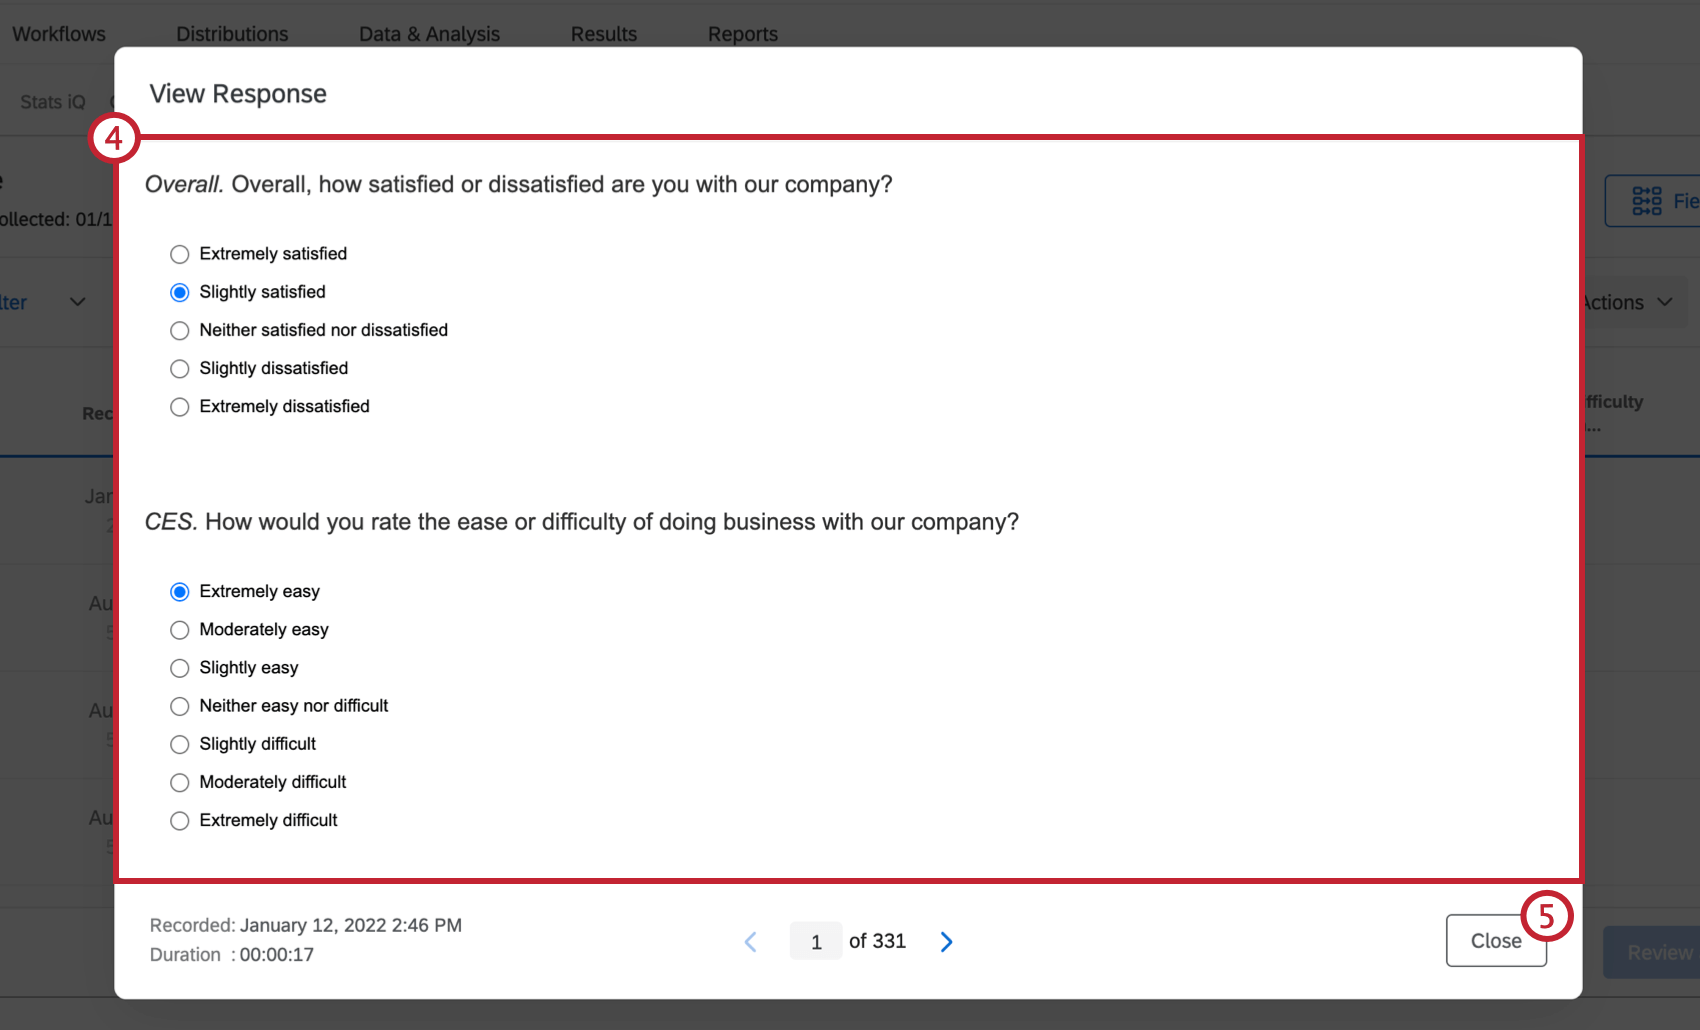 Attention: The question text that is displayed in the response summary is of the current version of your survey as it appears in the survey editor. If you’ve made changes to your survey since your respondent submitted their response, the response summary will update to include those changes. However, your respondent’s data will remain unchanged. Because of this behavior, your response summary may look different than expected if your survey has been edited after data collection.
 - Click Close to return to your recorded responses.
This Question Was Not Displayed to the Respondent
When viewing an individual response, you may see the phrase “this question was not displayed to the respondent” for some questions. There are a few different scenarios which can cause this message to appear.
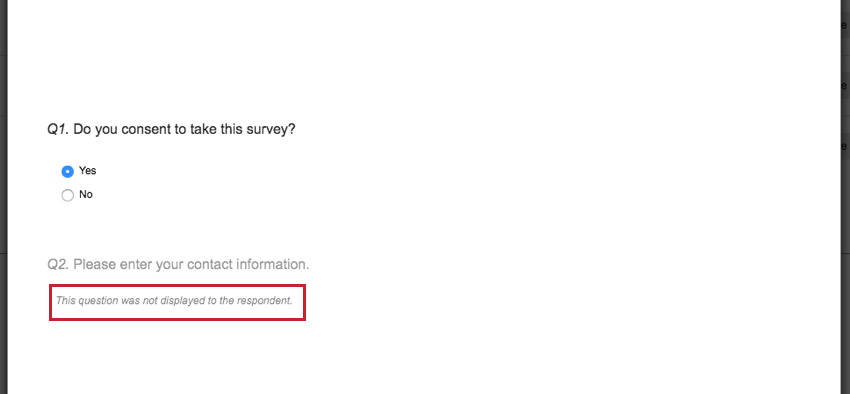
The common causes of this message are outlined below:
- This is an incomplete survey response, and the respondent didn’t reach the question before their response was recorded.
- The question was not shown to the respondent due to branch logic or display logic.
- The respondent saw a previously published version of the survey without the question.
- The question was nested in a block under an authenticator into which the respondent failed to authenticate.
- Question randomization or a randomizer survey flow element caused the question not to be seen.
Exporting an Individual Response to PDF
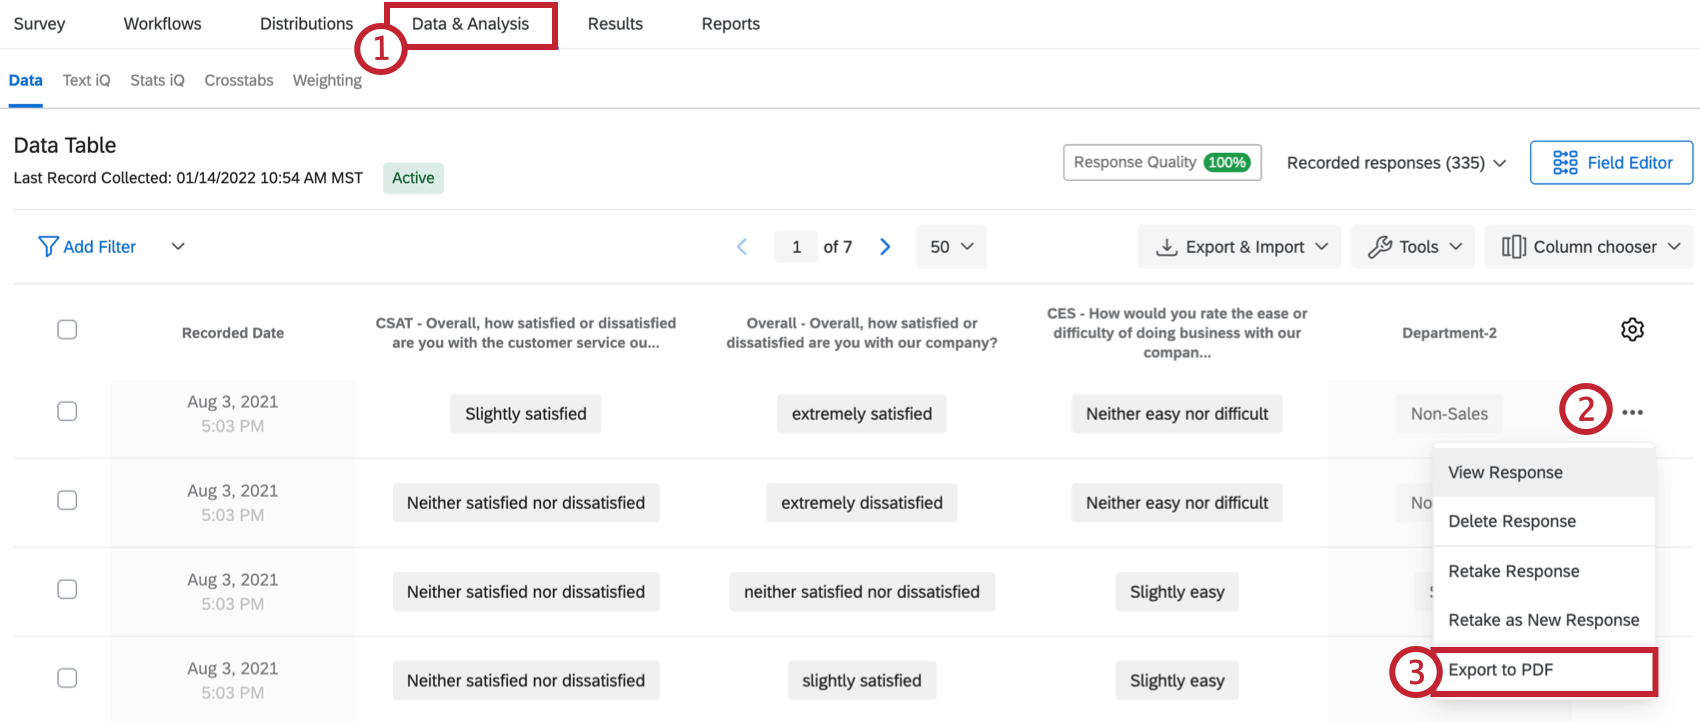
- Navigate to the Data & Analysis tab.
- Find the response you want to view, and click the 3 dots to the far-right under the gear icon.
- Choose Export to PDF.
- Name your file.
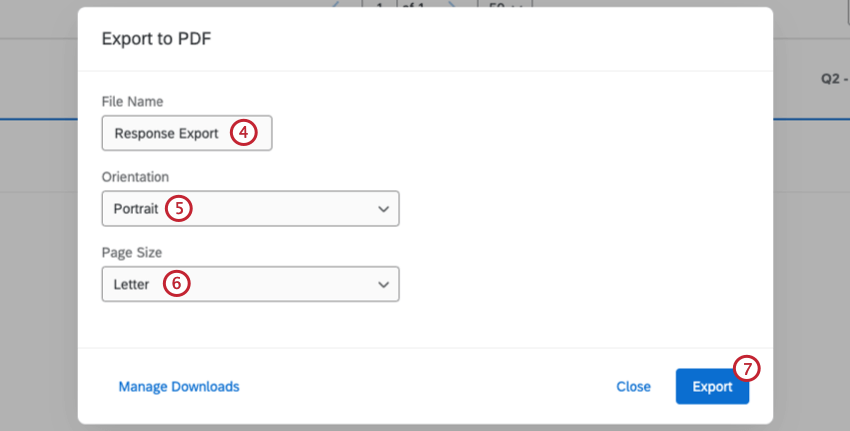
- Select a file orientation.
- Select the page size.
- Click Export.
Deleting Responses
You can easily remove specific responses from your dataset. You can delete a single response, selected responses, or responses based on filters.
How to delete a single response
- Navigate to the Data & Analysis tab.
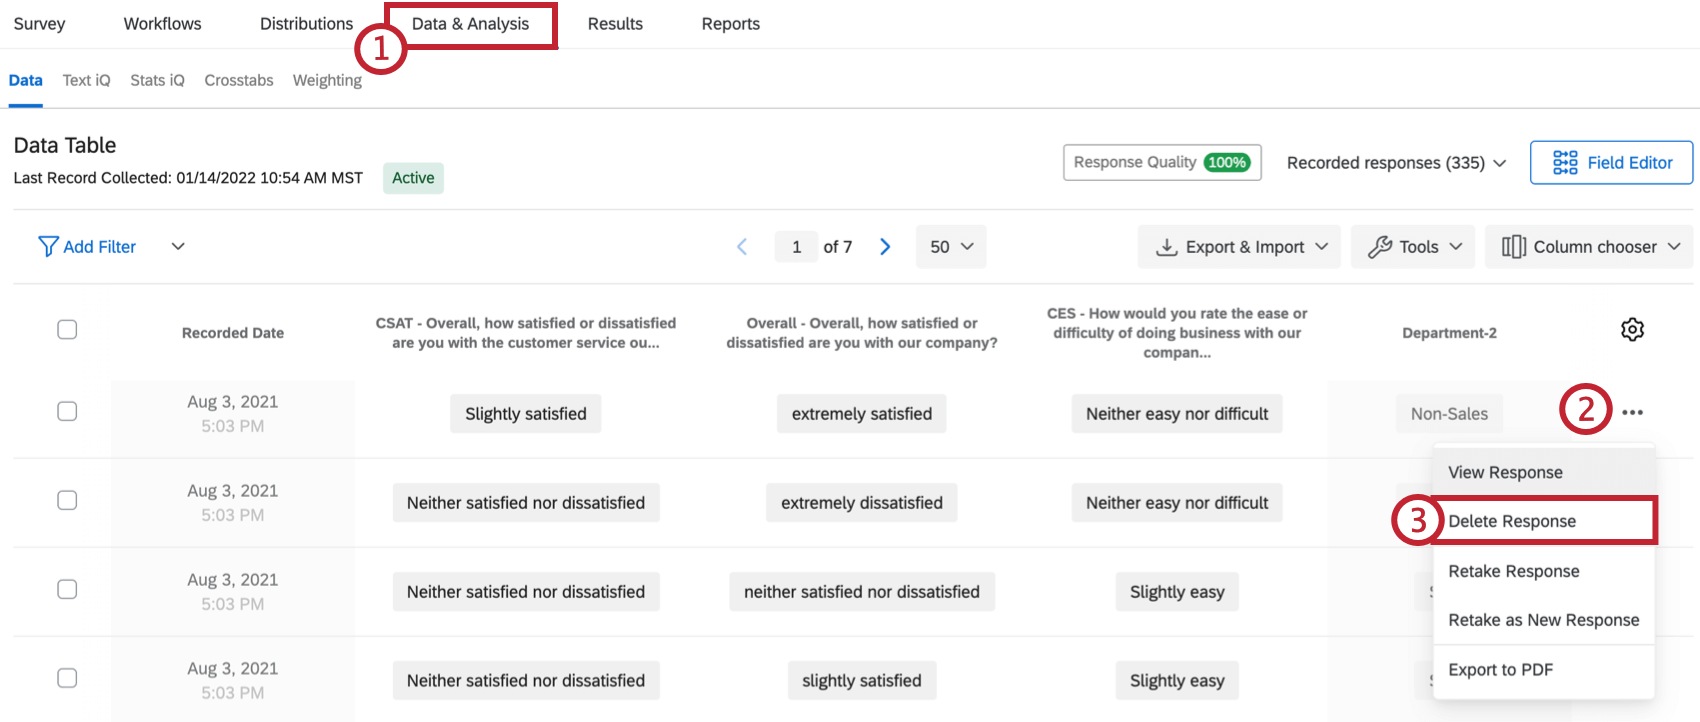
- Navigate to the response you want to delete. Click the 3 dots to the far-right of the response, under the gear icon.
- Select Delete Response.
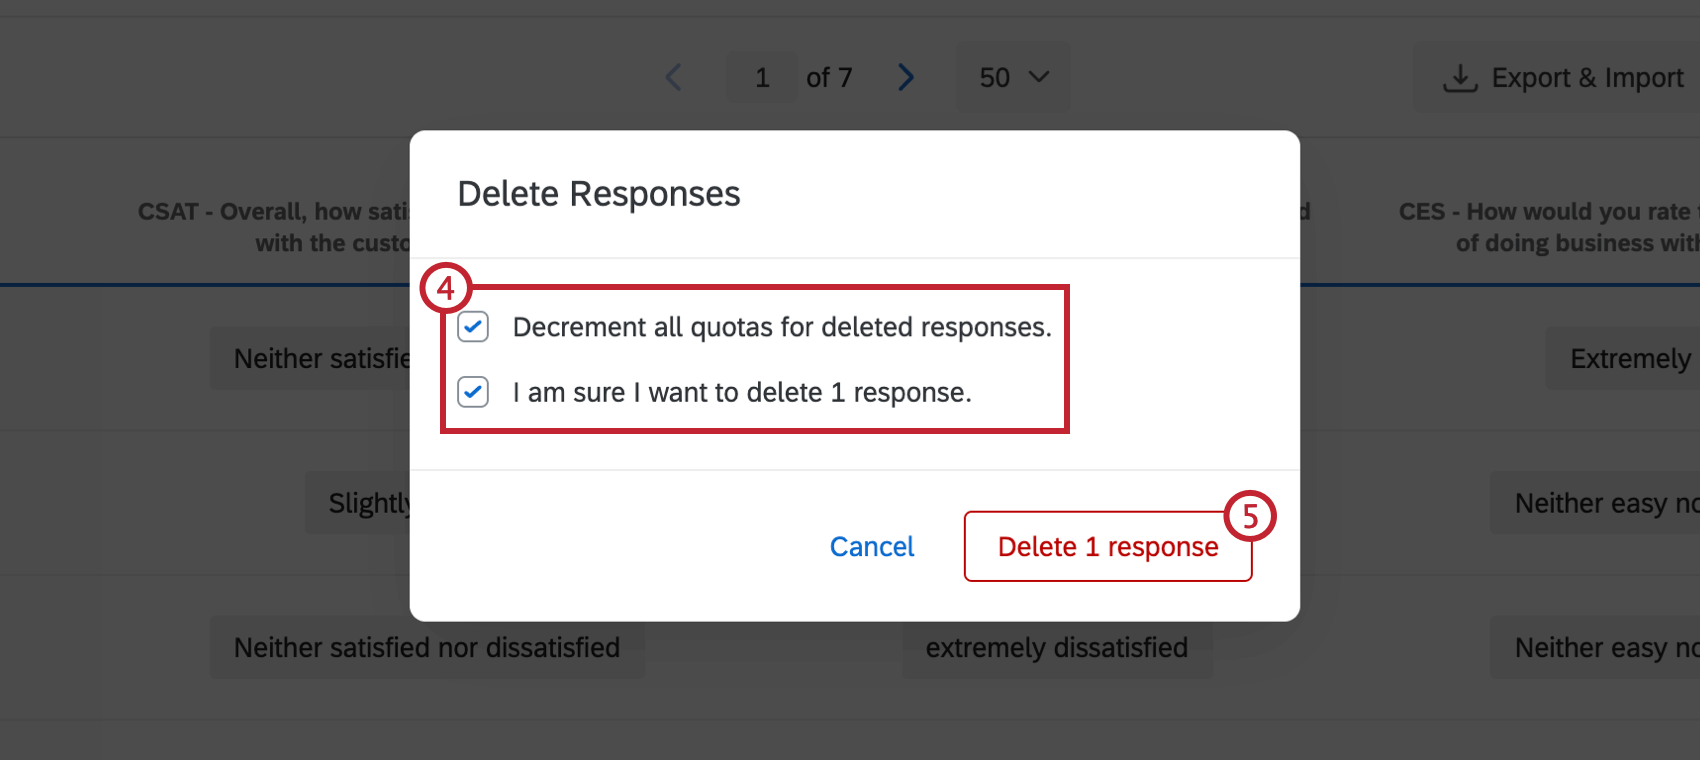
- Select the checkbox for I am sure I want to delete responses. If desired, select the checkbox for Decrement all quotas for deleted response.
 Qtip: “Decrement all quotas for deleted responses” means that your quotas will be decreased accordingly when you delete the responses. For example, if one of the responses you are about to delete previously increased your quota count when the response was submitted, your quota will be decreased by one when you delete this response and check the box for “Decrement all quotas for deleted responses.” If your survey does not have any quotas in use, checking or unchecking this box will not affect anything.
 - When ready, click Delete X responses.
How to Select and Delete Multiple Responses
- Navigate to the Data & Analysis tab.
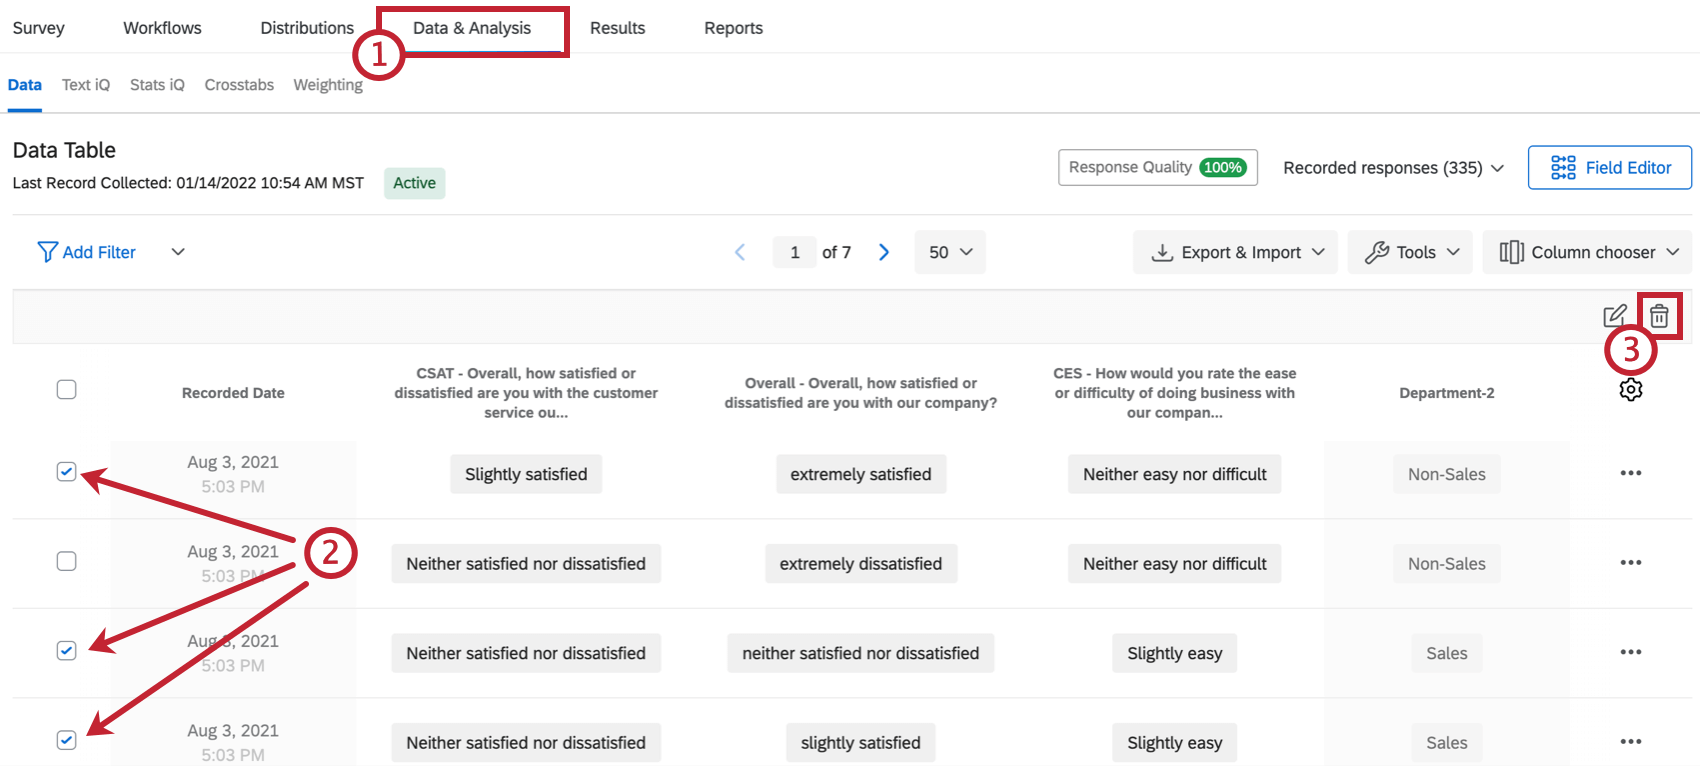
- Click the checkbox for the response(s) you want to delete.
- Click the trash icon.
- Select the checkbox for I am sure I want to delete responses. If desired, select the checkbox for Decrement all quotas for deleted response.
Qtip: “Decrement all quotas for deleted responses” means that your quotas will be decreased accordingly when you delete the responses. For example, if one of the responses you are about to delete previously increased your quota count when the response was submitted, your quota will be decreased by one when you delete this response and check the box for “Decrement all quotas for deleted responses.” If your survey does not have any quotas in use, checking or unchecking this box will not affect anything. - When ready, click Delete X responses.
How to Delete All Responses at Once
In this section, we go over how to delete all the responses in your survey at once.
- Navigate to the Data & Analysis tab.
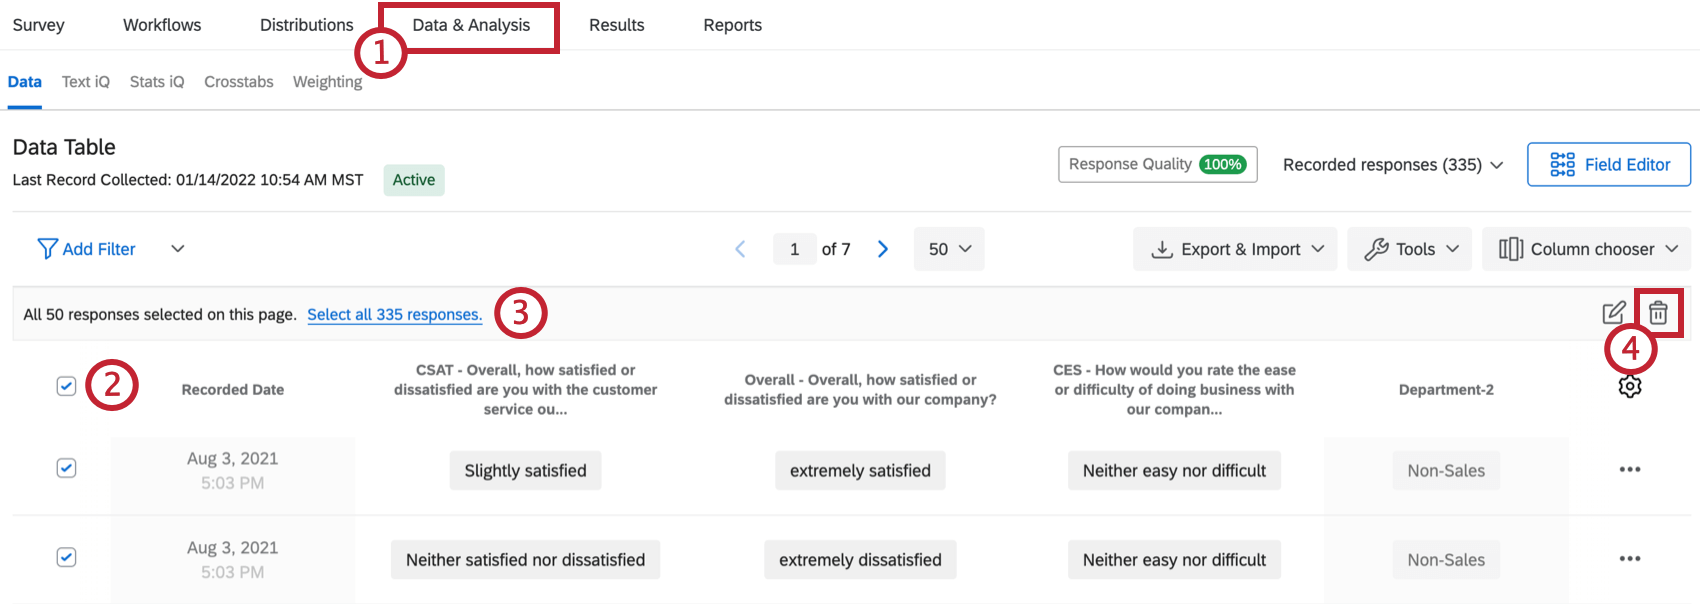
- Click the top checkbox to select all responses on the page.
- Click the blue text to select all responses for the survey.
- Click the trash icon.
- Select the checkbox for I am sure I want to delete responses. If desired, select the checkbox for Decrement all quotas for deleted responses.
 Qtip: “Decrement all quotas for deleted responses” means that your quotas will be decreased accordingly when you delete the responses. For example, if one of the responses you are about to delete previously increased your quota count when the response was submitted, your quota will be decreased by one when you delete this response and check the box for “Decrement all quotas for deleted responses.” If your survey does not have any quotas in use, checking or unchecking this box will not affect anything.
 - When ready, click Delete x responses.
How to Filter For and Delete Responses
There are times when you may need to delete a lot of data at once that doesn’t necessarily fit a response type. This section covers how to use filters to delete many responses at once.
- Navigate to the Data & Analysis tab.
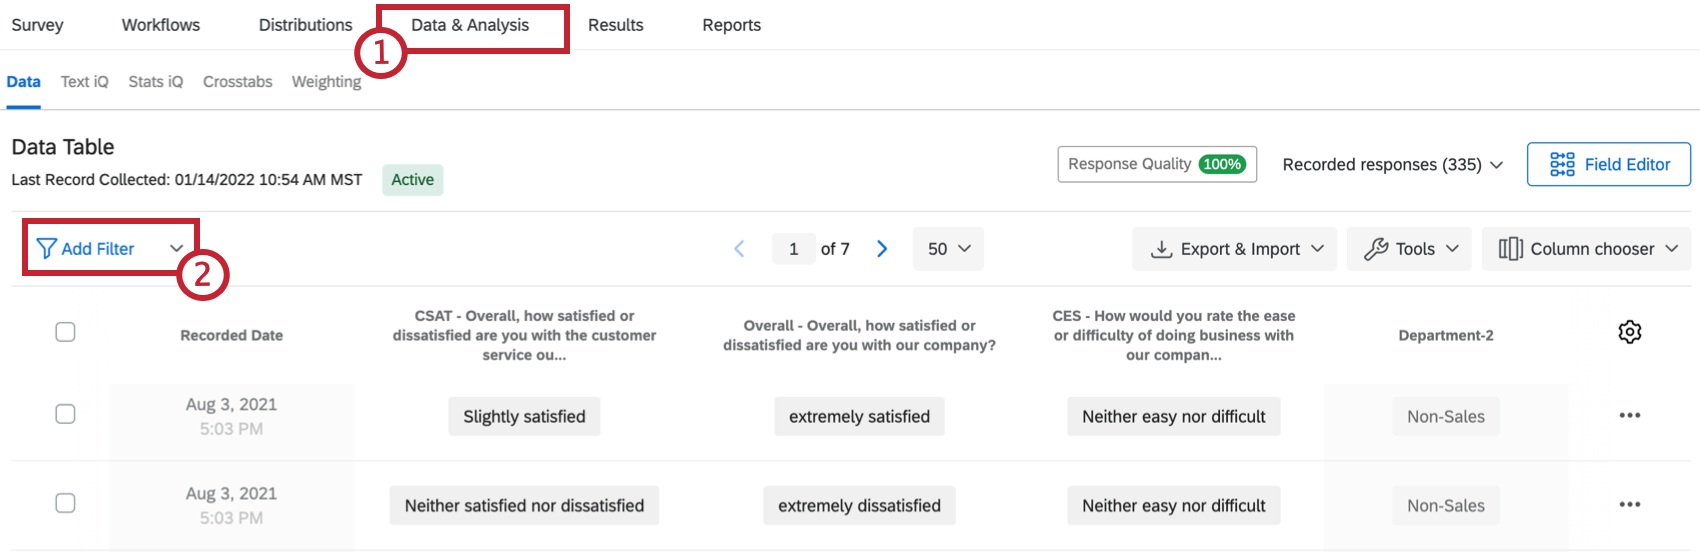
- Click Add Filter.
- Create a new filter or choose from your saved filters.
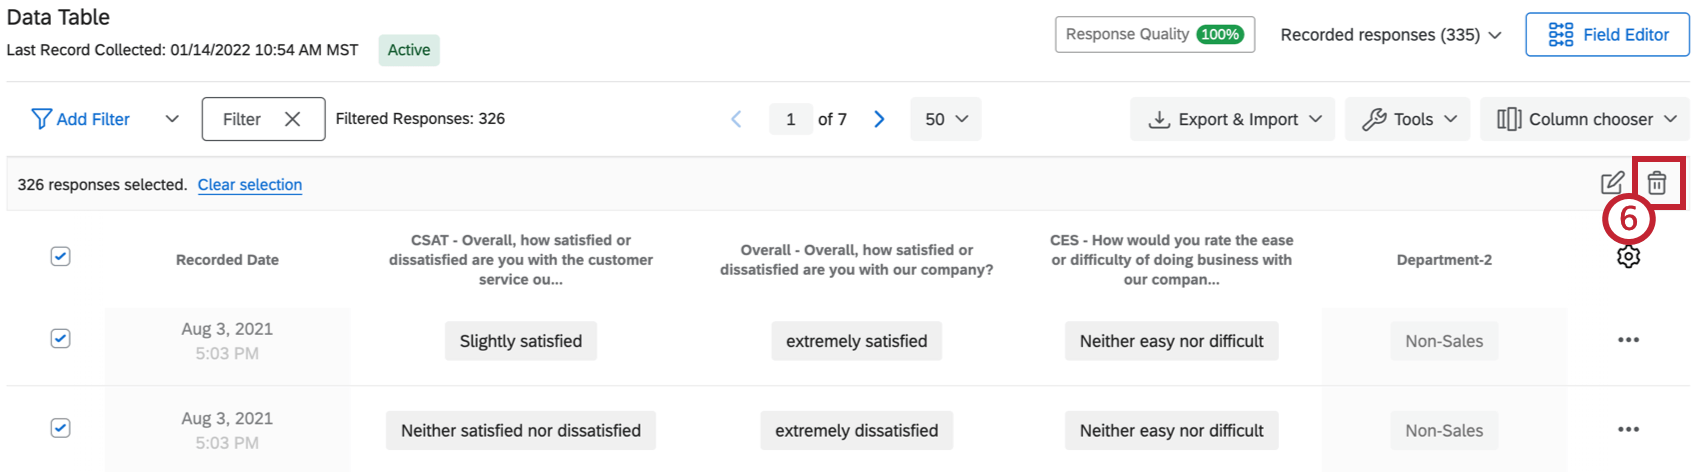
- Enter your filter criteria and select all responses. If you need assistance building a filter, see Filtering Responses.
- By default, clicking the Select All checkbox will select all the relevant responses on that page of the response viewer.
- Click the trash icon.
- Select the checkbox for I am sure I want to delete responses. If desired, select the checkbox for Decrement all quotas for deleted response.
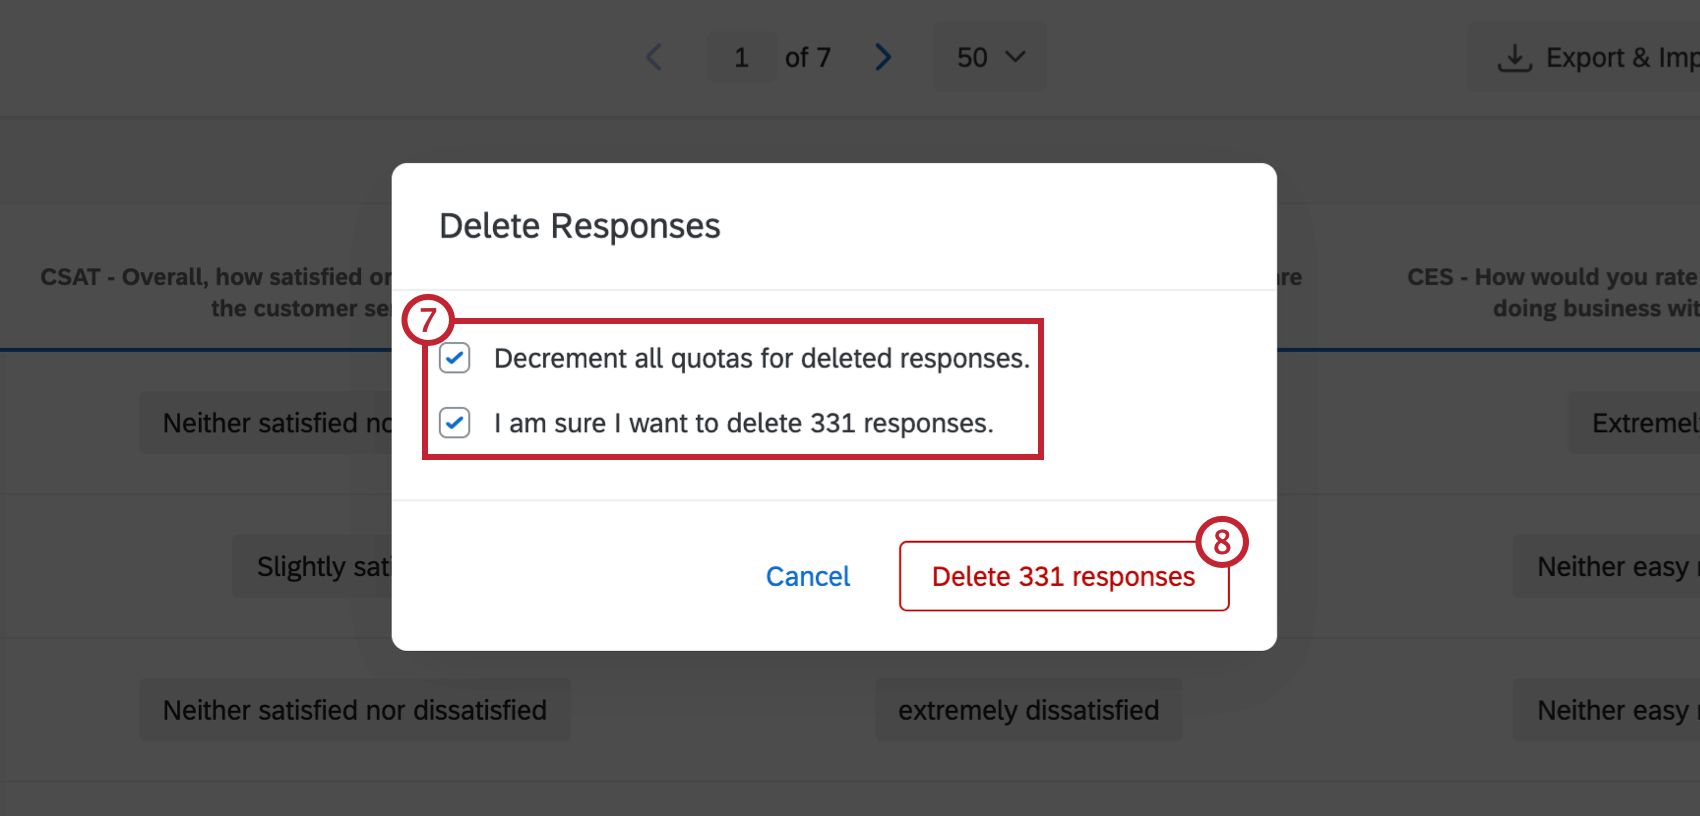 Qtip: “Decrement all quotas for deleted responses” means that your quotas will be decreased accordingly when you delete the responses. For example, if one of the responses you are about to delete previously increased your quota count when the response was submitted, your quota will be decreased by one when you delete this response and check the box for “Decrement all quotas for deleted responses.” If your survey does not have any quotas in use, checking or unchecking this box will not affect anything.
 - When ready, click Delete x responses.
Choosing Columns
By default, the columns on the Recorded Responses page display the Recorded Date for each response, in addition to a few questions from the survey. However, you can change which columns of data you would like to display. The column options include any data you collected in the survey, such as answers to questions, survey metadata, Embedded Data fields, and custom fields.
You can only display up to 100 columns at a time.
How to Choose Columns
- Navigate to the Data & Analysis tab and click Column chooser.
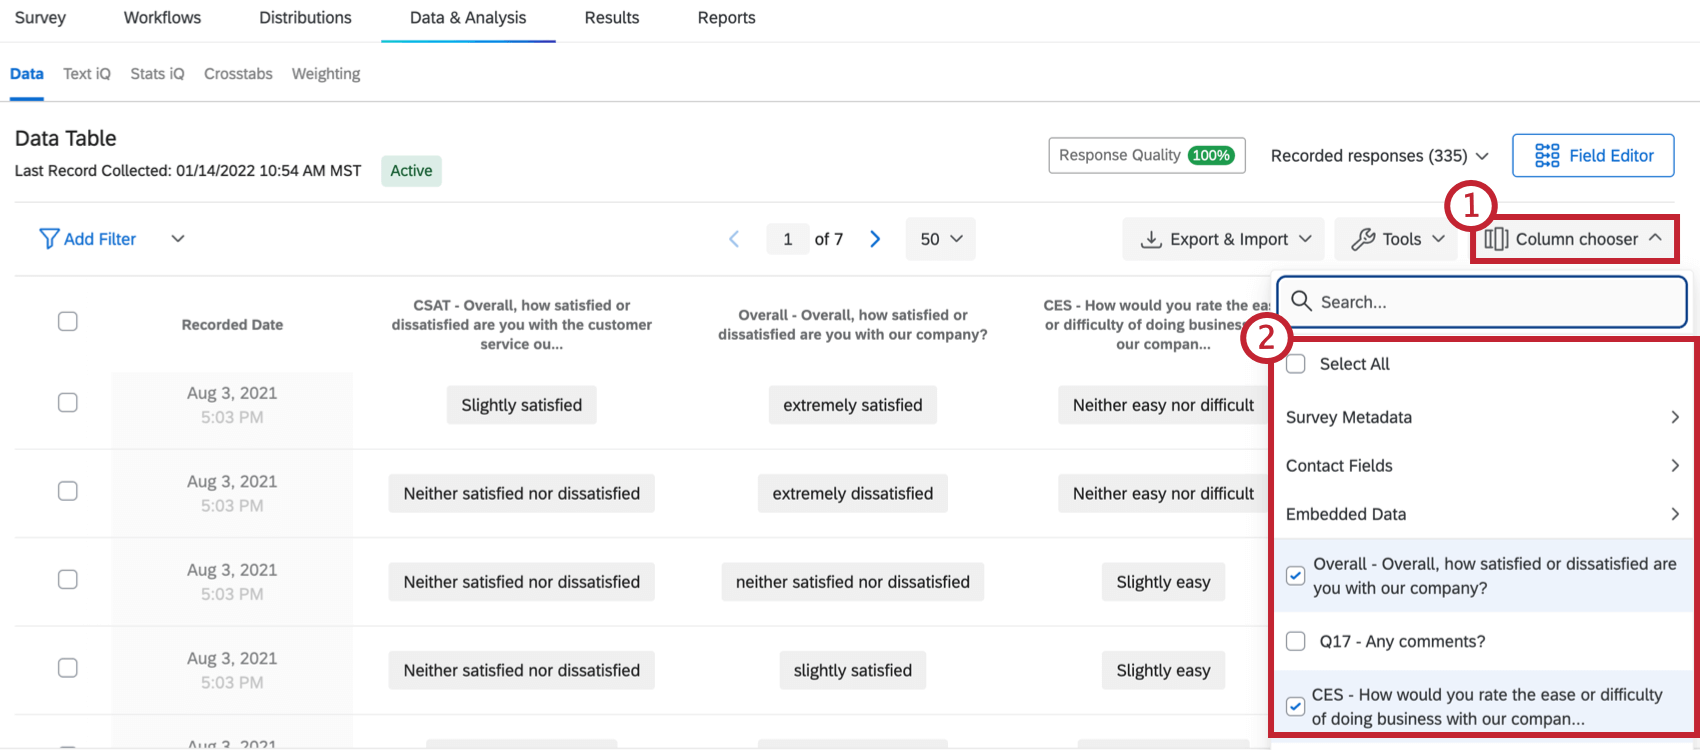
- Select the response information you want to display as columns. Click Select All to select all the fields in your survey.
Note that you can also hover over a column header and click the blue plus sign (+) to add columns, or the red minus sign (–) to remove a column.
You can re-select a column to remove it. Columns currently displayed on the page will be noted with checkmarks.
Column Options
You can access additional options for a column by clicking on the column header.
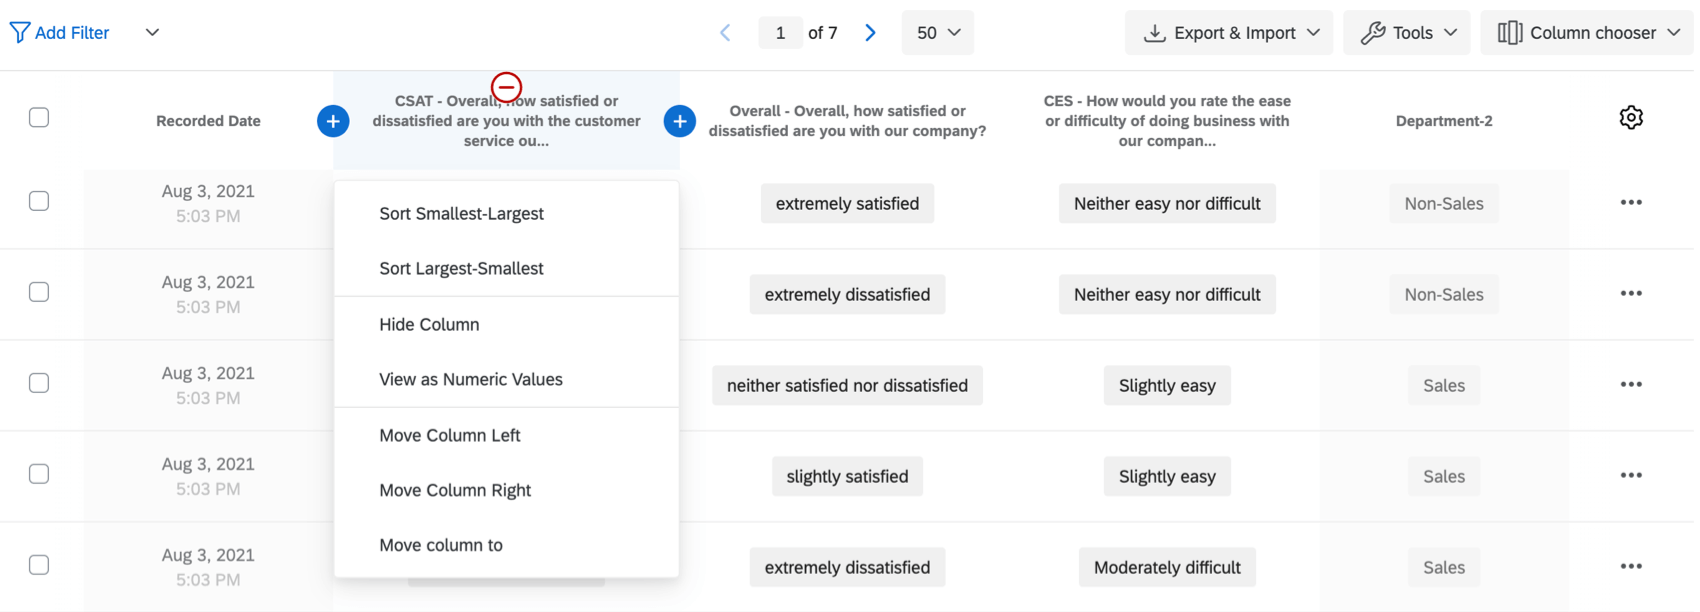
From here, you can perform the following actions:
- Sort: Sort the responses in your response viewer by the values in the column (A-Z, Smallest-Largest, etc.).
- Hide Column: Hide the column from the response viewer.
- View as Numeric Values: View the recode values for each answer rather than the choice text.
- Move Column Left/Right: Shift the column over one column left or one column right.
- Move Column To: Move the column to a specific spot in the data table.
Save Layouts
After choosing which columns to display, you may find that there are several combinations of columns you want to be able to reuse later. For example, because you can export just your chosen columns (by deselecting Download all fields), you might have arrangements you rely on when you export your data.
Luckily, you can save different arrangements of columns using the Save Layouts feature.
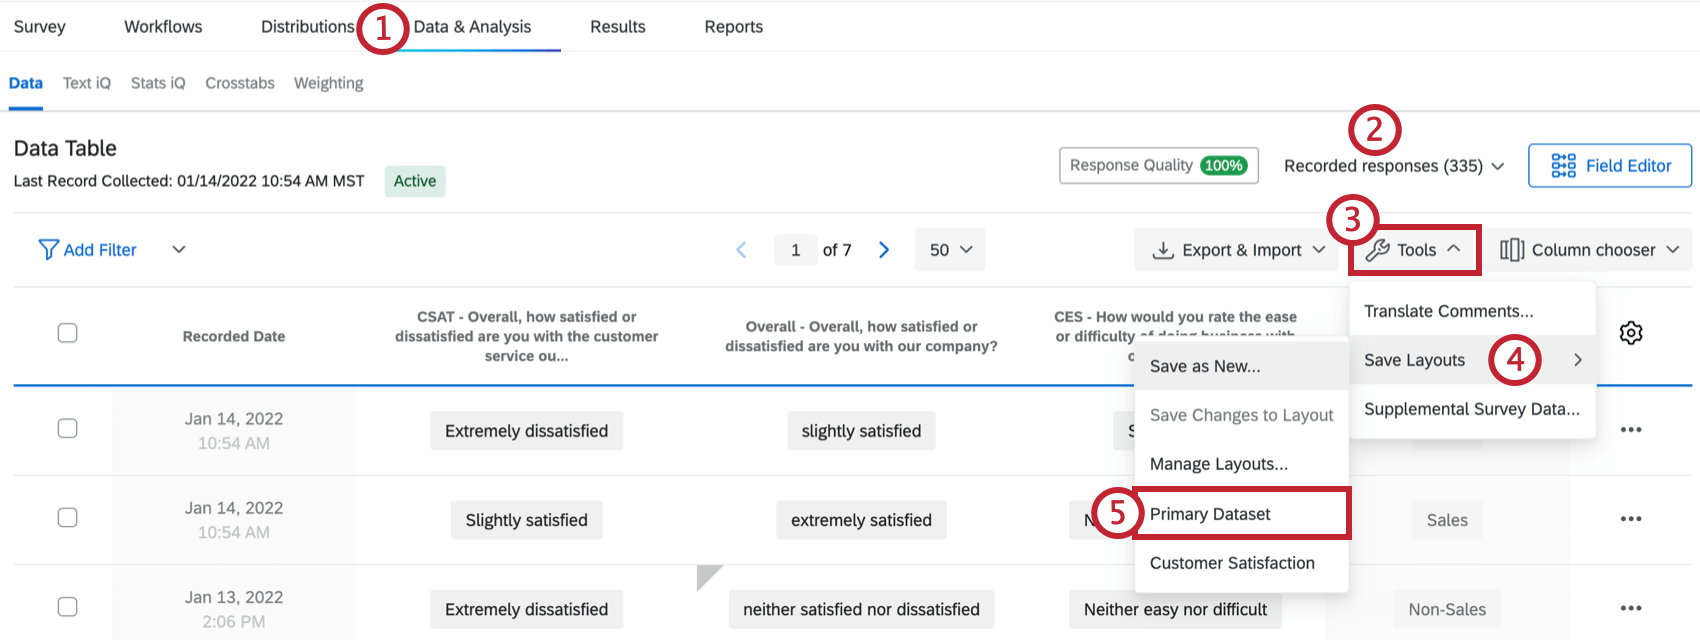
Saving a New Layout
- Navigate to the Data & Analysis tab.
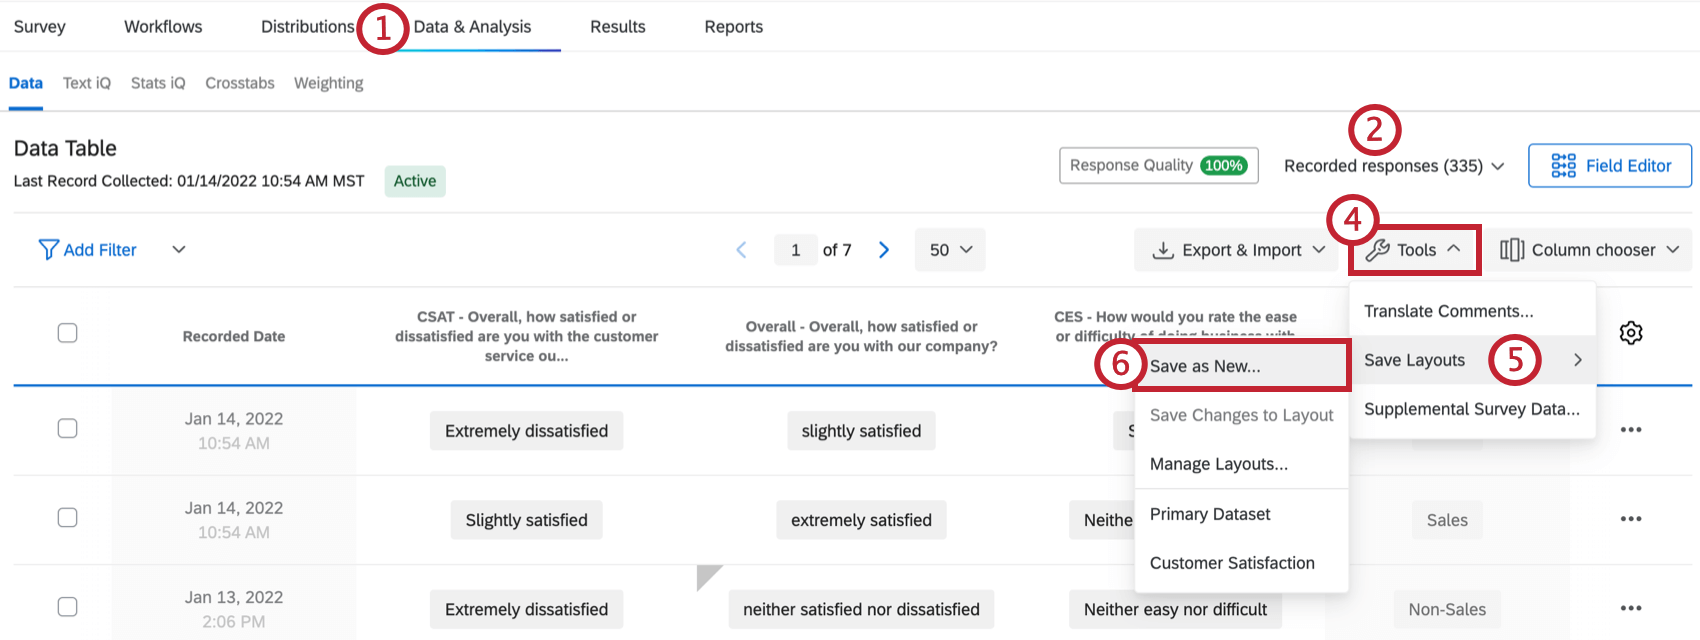
- Under the Data section, navigate to Recorded Responses.
- Arrange columns of your data according to the directions on the Choosing Columns support page.
- Click Actions.
- Select Save Layouts.
- Select Save as New.
- Type a Layout Name in the text box.
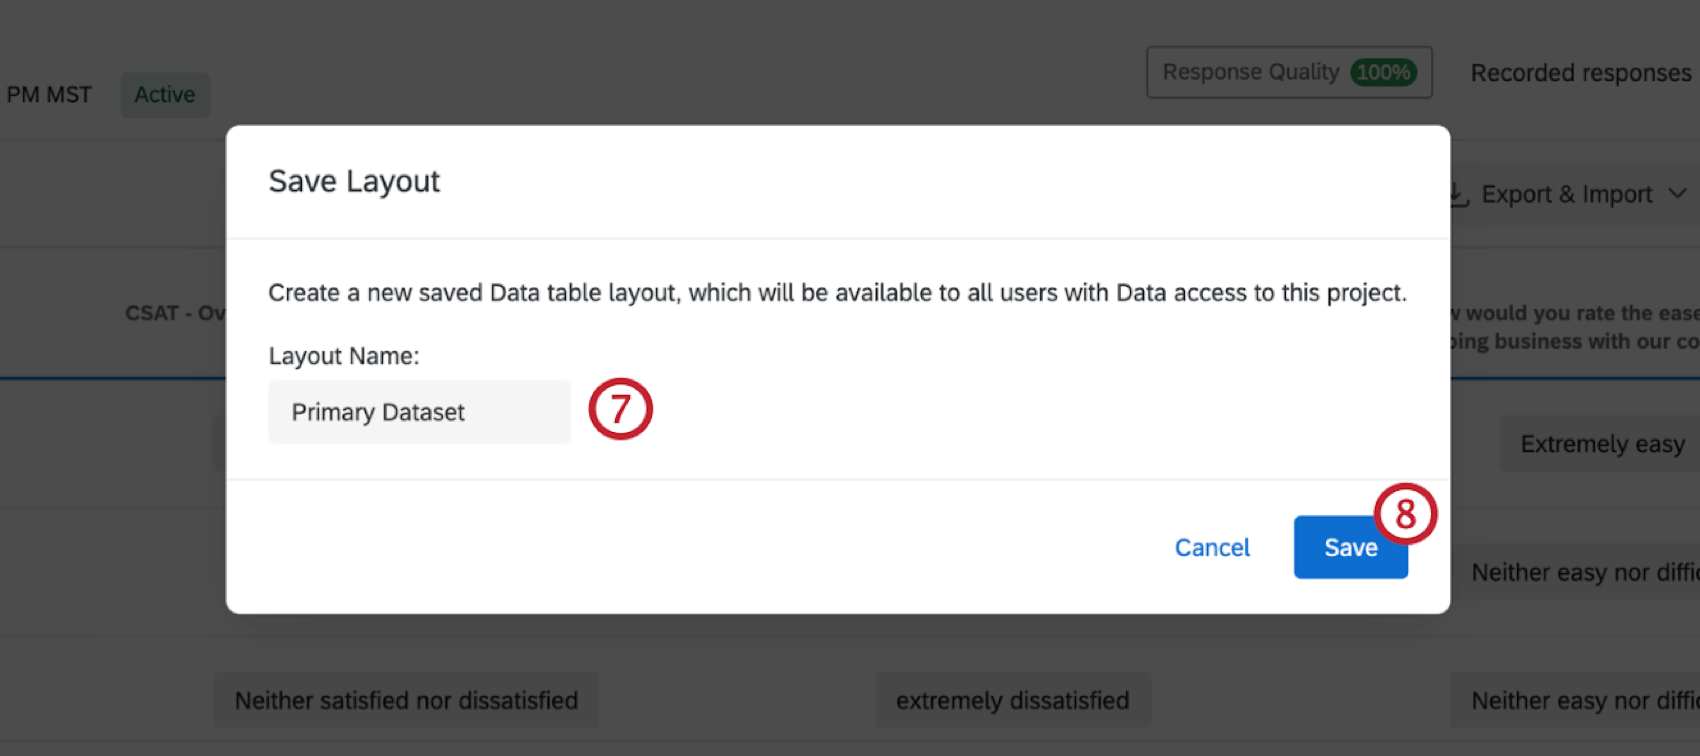
- Click Save.
Loading and Editing a Layout
- Navigate to the Data & Analysis tab.
- Under the Data section, navigate to Recorded Responses.
- Click Tools.
- Select Save Layouts.
- Select the layout you want to load.
- Make changes to your columns according to the directions on the Choosing Columns support page.
- Click Tools.
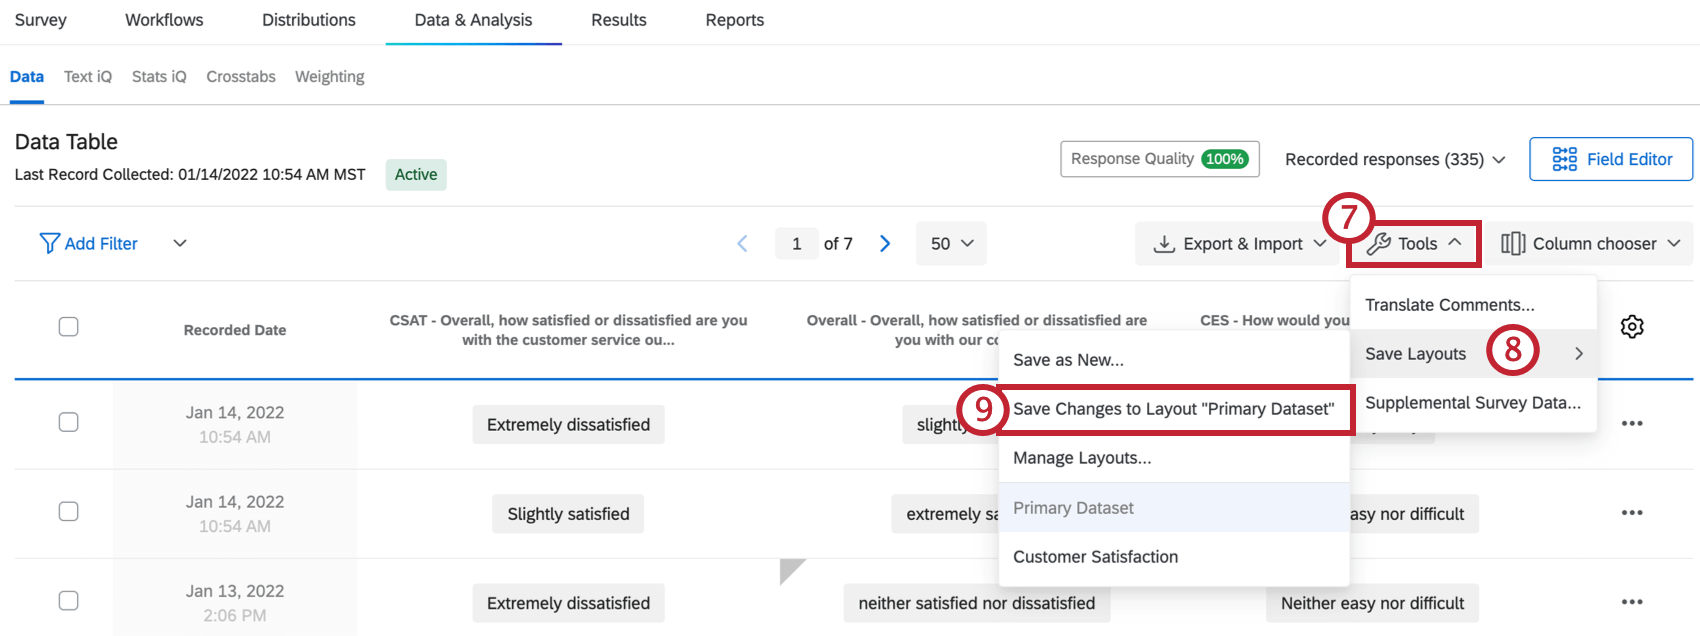
- Select Save Layouts.
- Select Save Changes to Layout “[Name]” to save your changes.
Manage Layouts
After your layouts are created, you have the option of renaming or deleting them.
- Navigate to the Data & Analysis tab.
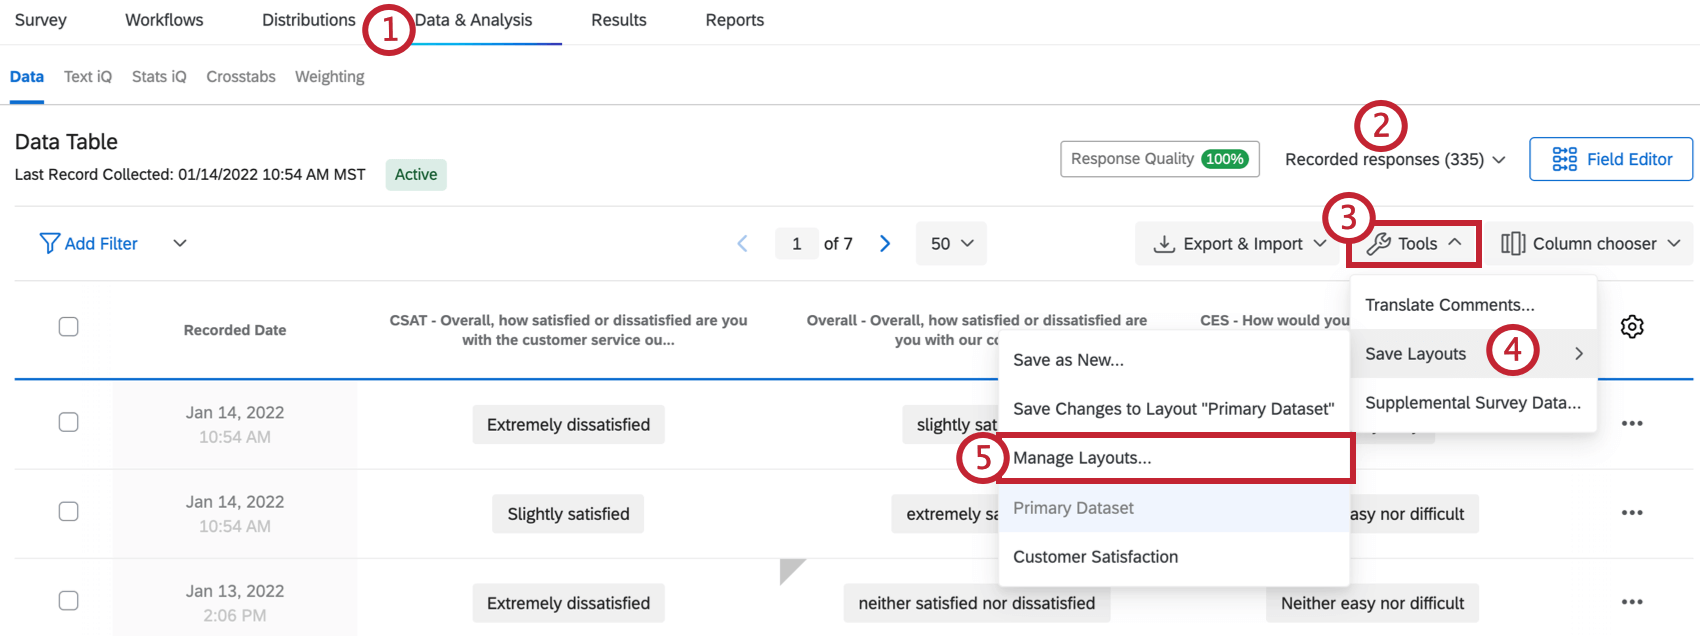
- Under the Data section, navigate to Recorded Responses.
- Click Tools.
- Select Save Layouts.
- Select Manage Layouts.
- Select Rename to change the name of a layout.
- Type the new name in the field.
- Select Done to save the new name.
- If you want to permanently delete a layout, click Delete.
- When finished making changes, click Close.
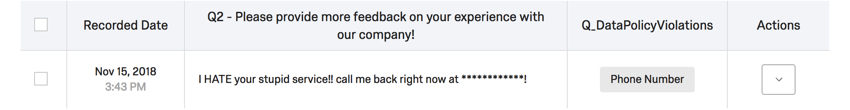
Redacted Responses
Sometimes, you may notice asterisks concealing part of a response. This means that your Brand Administrator has set up a Sensitive Data Policy, which will flag and redact sensitive information in a survey to protect the respondent. Please see the Collecting Sensitive Data section of the Sensitive Data Requests support page for more information.
Recorded Responses in Different Project Types
The Recorded Responses page is available in many different types of projects. The steps and options described on this page apply to the following project types:
There are a few other types of projects with a page called Recorded Responses. However, there are important differences to keep in mind: