


New data from more than 27,000 consumers reveals a persistent gap between the customer experience organizations think they're delivering and what customers actually say they're getting. Look closer at the research, and that gap turns out to be three separate gaps, each with a different cause and a different fix.
Drawn from two Qualtrics studies fielded within months of each other*, the research shows practitioners misjudging channel performance, tracking the wrong measure of success, and over-anticipating value from AI they haven't yet deployed correctly.
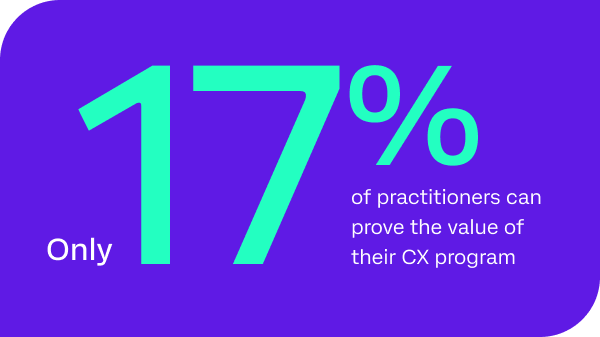
The result: only 17% of practitioners can currently prove the value of their customer experience program, at the exact moment the C-suite is demanding that proof.
1. Practitioners think their channels are performing better than customers say they are
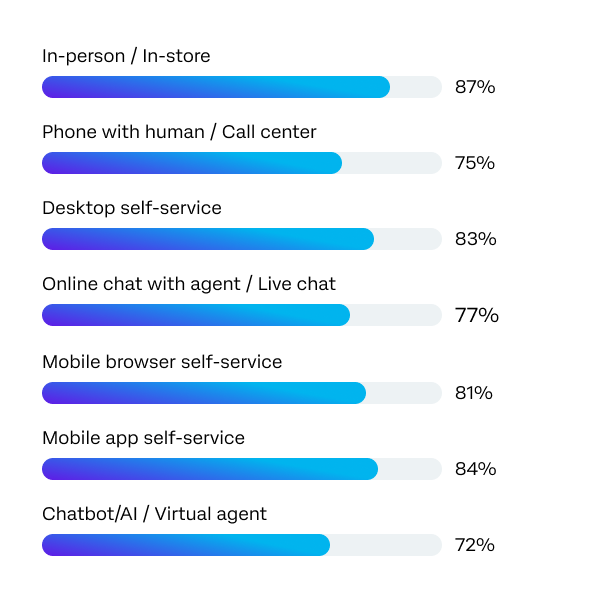
Phone support is the sharpest example. Just 3% of customer experience practitioners call their phone/call center experience poor. Customers rate it at 75% satisfaction — behind every digital channel except virtual agents, and near the bottom of the list overall. In-person experiences top the rankings at 87% satisfaction for both groups, but everywhere else, the two sides diverge.
The cause is a visibility problem, not a data error. Internal teams see cost, staffing levels, and containment rate. They don't see the customer's side of the interaction unless they go looking for it, which means a channel can look fine internally for months while it quietly loses customers.
2. Issues get closed, but not always fixed
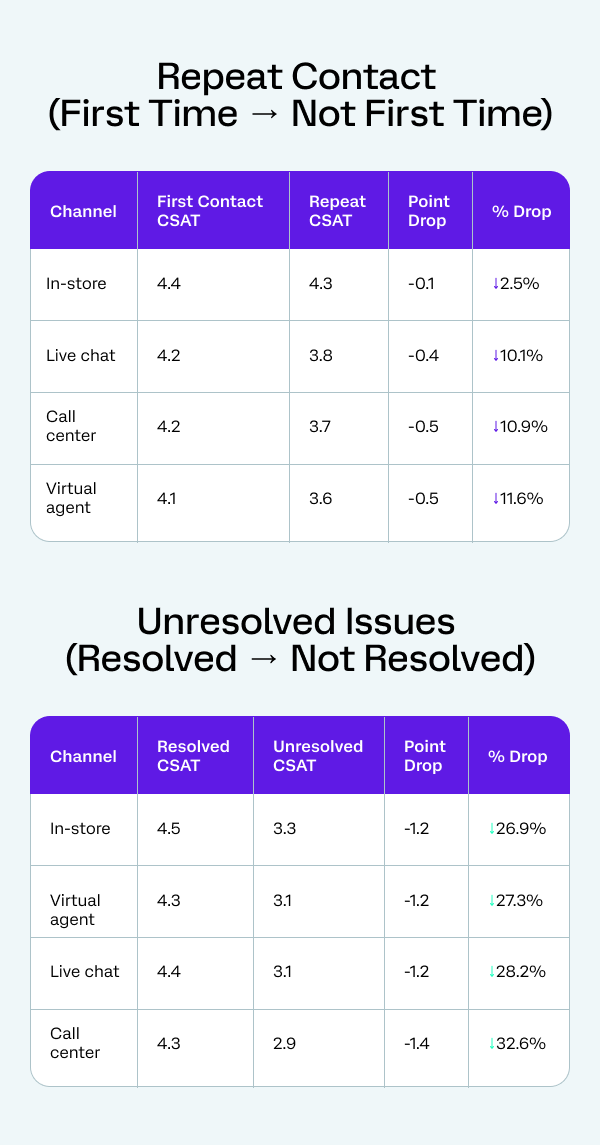
The second gap shows up once you look past the channel and at what happens after the first contact. Satisfaction holds up reasonably well the first time a customer reaches out. It drops sharply on repeat contact, and drops further still when the issue goes unresolved.
|
1 in 2 bad experiences resulting in customers cutting their spend (source: 2026 consumer trends report) |
That alone would be expected. What's more revealing: customers who are unsure whether their issue got resolved score nearly as badly as customers who know for certain it wasn't. Most customer experience programs measure "did we fix it" on a yes/no basis. The data suggests the real driver of the score is "does the customer know it's fixed" — a distinction most measurement frameworks don't capture.
Contained is not the same as resolved. Containment measures whether the system absorbed the interaction. It says nothing about whether the customer walked away satisfied. If containment rate is a headline metric, it's worth asking what it's failing to show you.
Start by auditing how you close out interactions, particularly in virtual agent and call center channels where customers can't see the work being done on their behalf. Resolution isn't just an operational question — it's a communication one. The question isn't only "did we fix it?" but "does the customer know it's fixed?"
If your containment rate is a headline metric, pressure-test what it's actually capturing. Contained is not the same as resolved, and the gap between the two is where loyalty quietly erodes. Juliana Holterhaus
The financial exposure here is direct, with half of customers who have a bad experience cutting how much they spend.
3. Leaders expect AI to make programs more effective, but know there’s a way to go
The third gap is different in kind from the first two. Practitioners know AI isn't yet delivering. While 76% expect AI to make their customer experience program more effective, in the same breath practitioners rate chatbot/AI as their own single worst-performing channel. Customer data agrees: AI-driven channels post the lowest satisfaction scores of anything measured.
The gap traces to where AI is currently pointed, not a shortfall in the technology itself. Only 16% of programs use AI to automate closed-loop response — the use case with the clearest line to reducing unresolved issues. Only 23% use it to support human agents in real time. Meanwhile, half of consumers already worry that more AI means losing access to a human when they need one.
Unlike the first two gaps, this one needs redeployment, not just better visibility or better metrics: AI that carries context forward so agents aren't starting from zero, that gets measured on resolution rather than containment, and that keeps getting evaluated after launch instead of treated as finished once it ships.
Three gaps, three different fixes
Each gap needs a different response.
The perception gap closes with visibility, pressure-testing internal assumptions against customer-reported data by channel.
The resolution gap closes by changing what gets tracked, moving past containment and first-contact resolution toward whether customers actually know their issue is fixed.
The AI gap closes by redirecting AI investment toward resolution and agent support rather than pure deflection.
Read more on how to improve AI effectiveness from our Customer Experience expert, Leonie Brown.
*Comparisons drawn from two Qualtrics studies, conducted within months of each other. The Qualtrics XM Institute Q1 2026 CX practitioner study surveyed 105 CX practitioners at organizations with 1,000+ employees. The Qualtrics Omnichannel CX benchmark study surveyed 27,146 US consumers about their recent experiences with 127 companies across 13 industries.
Because the two studies measure performance differently, the figures are best read as directional signals rather than a like-for-like comparison. Customer Satisfaction (CSAT) measures how satisfied a customer is with a specific interaction, product, or service — typically captured immediately after an experience, such as a support ticket or purchase. Overall Satisfaction (OSAT) reflects a broader, more holistic view of a customer's satisfaction with a brand over time, informed by multiple interactions and touchpoints. CSAT is tactical and moment-specific; OSAT is strategic and cumulative. Together, they help teams understand both individual experience quality and the overall relationship with customers.