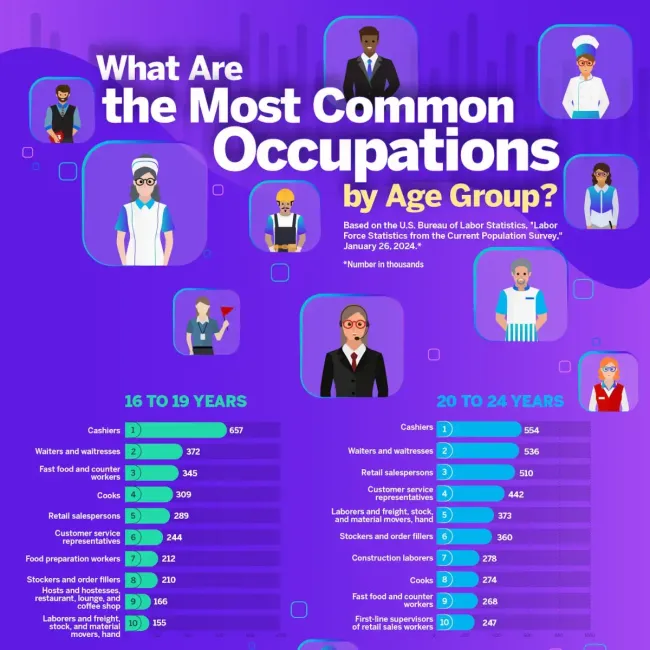
Gone are the days of staying in one job from career beginning to retirement. These days, people change jobs multiple times throughout their working lives. In some cases, a person’s job can be influenced by their age, whether it is because they haven’t graduated from college yet, they’ve grown up in the digital age, or they’re simply looking to supplement their income. To determine the most common jobs in America by age group, the research team at Qualtrics analyzed data from the Bureau of Labor Statistics, “Labor Force Statistics from the Current Population Survey,” January 26, 2024, which surveyed more than 161 million employed persons.
The most common job in America
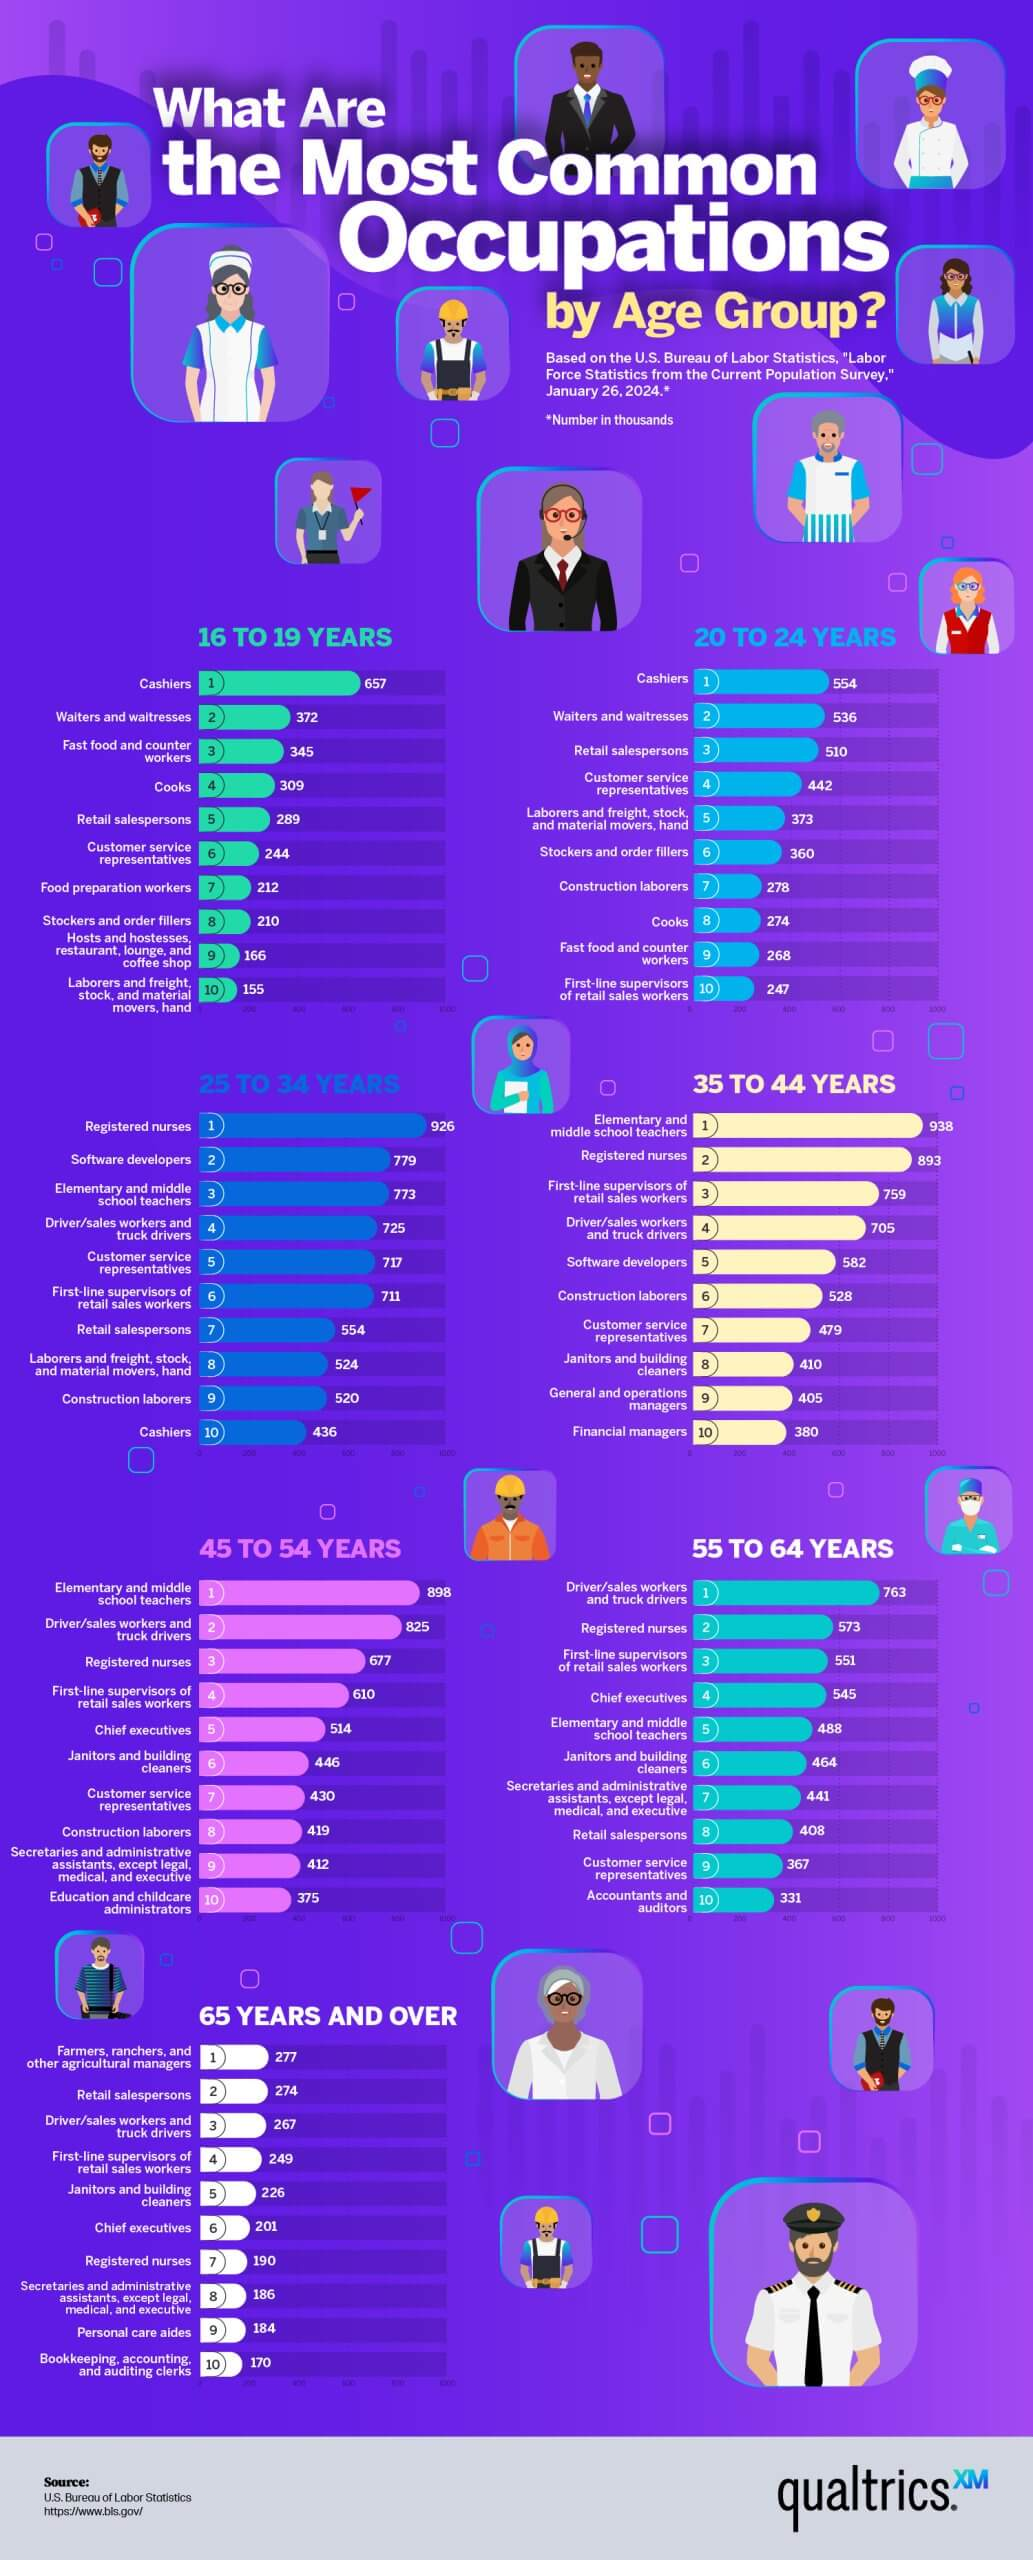
Spanning all seven age groups, 16 through 65+, the most common job in America is customer service representative (CSR). This stands to reason as nearly every company in existence—whether business-to-business (B2B) or business-to-consumer (B2C)—must offer some level of support to its customers.
Another reason this may be such a popular job is that the barrier to entry is quite low. No degree is required, usually just a high school diploma. And even those with little experience can find employment as CSRs. In addition, it’s a job that can often be done remotely, which makes it a popular choice among job seekers, regardless of age.
Possibly one of the biggest contributing factors is the average salary of $60,658 per year, higher for those with more experience. This is just below the national average of $66,621 and roughly quadruple the annual amount earned by those making the national minimum wage of $7.25 per hour.
The fact that CSR is included in every age group surveyed may also mean people stay in that job for longer periods of time and are not job hopping as much as people in other fields do.
Working past retirement age
Depending on when they were born, older adults are considered to be of retirement age when they’re between 65 and 67. Yet, hundreds of thousands of people in this age group continue to work rather than retire. Why is that?
While for some, it may simply be a way to keep busy, for many others, it may be that they need to supplement their retirement income—if they have retirement income at all. More than 17 million adults (roughly one in three) in that age group are economically insecure, with incomes below 200% of the federal poverty level of $30,120 per year for a single person. Unable to fully retire, they hold onto their jobs or possibly take on new ones.
For example, 274,000 seniors were retail salespersons. That’s less likely to be a job someone has from their teen years all the way through their retirement years. Adults who cannot retire are likelier to take on that work as it’s easier to get and usually not physically demanding.
The largest group of seniors (277,000) are in farming, ranching, or other agricultural fields. As farms are often passed down from generation to generation, many of those people have farmed their entire lives and continue to do so into their later years.
In fact, many of the jobs held by those 65 and older are more likely to be held for longer periods—such as registered nurses and bookkeepers—as they require specialized education.
Older people are also less likely to job-hop than those from younger generations. The U.S. Bureau of Labor Statistics found that older workers stay in jobs approximately three times longer than younger workers. In later years, financial stability becomes even more critical, and changing jobs at that point can cause hardship.
Combatting job hopping
Every time an employee leaves a job, the company they worked for loses something—institutional knowledge. It’s a renewable resource, but it comes at a cost.
A new employee must be found, hired, and trained, all of which costs money and time. Even more time is required for the new employee to gain the amount of experience the departing employee had.
How could companies hold onto more employees for extended periods of time?
- Allow employees to work remotely. While many companies require their employees to return to the office, at least part-time, other companies continue to save on overhead expenses by keeping their employees remote. In addition, a study published by The Quarterly Journal of Economics showed remote employees were 13% more productive than their in-office counterparts, and those working from home reported higher work satisfaction.
- Improve the employee experience. In addition to working remotely, companies can improve employees’ lives in other ways. For example, it can facilitate work-life balance, offer unlimited paid time off (within reason), or offer paid parental and caregiver leave. Happy employees who feel respected and supported are less likely to job-hop.
- Pay a living wage. This is subjective depending on where an employee lives and other factors, but a living wage boils down to people being able to pay their bills and enjoy their lives without struggling or trying to hold down more than one job. The more energy employees spend on other money-making pursuits, the less energy they have to put into their primary job. And they are much more likely to leave if and when a better-paying option presents itself.
Optimize the employee journey
If you want to improve your business outcomes, improve the employee experience. Qualtrics can help capture that experience at every touchpoint with automated lifecycle feedback. By understanding your employees’ journey, you can gauge their intent to stay and other metrics, such as employee engagement.