
Synthetic data is earning its place alongside the human-led research paradigm1. With generative AI’s ability to produce synthetic data, we can rapidly iterate, test, and explore our research hypotheses to identify where we should spend the time and resources procuring high quality human participants2. Together, these two paths enable researchers to operate efficiently and with joyous exploration. This hybrid strategy combining human data with AI insights allows for research at the speed of business3.
The excitement around the potential of a synthetic data revolution in market research has been matched with concern around the quality of data produced by generative AI, which rely on general-use LLMs (large language models). Early work from Paxton and Yang (2024)4 demonstrated that data produced by ChatGPT and Gemini bore little resemblance to human data when asked to respond to basic Likert scales. Similar studies have found that synthetic data generated by general-use LLMs often produce less variability in responses5 and can be useful to identify relative differences in opinion, but not the unique perspectives of human respondents6. And yet the promise of synthetic research remains. The ongoing challenge lies in developing specialized models that can reliably bridge this quality gap, ensuring that synthetic insights genuinely reflect the complexity and diversity of human behavior and opinion.
At Qualtrics, we have spent over a year intensely experimenting, validating, and building our approach to synthetic data. Fine-tuned LLMs, built and trained for the purpose of generating survey data, are fundamentally different from general-use LLMs in their applicability to survey research.
We believe synthetic data, generated using fine-tuned LLMs purpose built for research, will provide another tool for researchers to utilize in their practice.
The value of fine-tuned models have already made an impact in patient care where a fine-tuned model was able to accurately predict individual scores on a standard clinical tool for depression assessment7. Jane Ostler8, EVP, Global Solutions Marketing and Thought Leadership at Kantar said it well: “The real excitement lies in fine-tuning these tools using high-quality, specific data sets that make predictions more accurate”. We have taken that excitement and put it to the test.
The Qualtrics Edge Audiences synthetic data model is a fine-tuned LLM trained on millions of human respondents answering hundreds of thousands of questions, leveraging Qualtrics’ owned data assets. Our latest model training jobs represent the largest fine-tuning efforts conducted to date at our company and can take upwards of two weeks to complete. Our model improvement has scaled (log-linearly) with the amount of data we have used in training. Providing the model with more question-answer pairs and capturing the conversational flow between the survey and the respondent has enabled it to learn the semantic relationship between the two. Training on large-scale human data has also allowed the model to represent a diverse range of responses, helping to reduce the issue of limited variability commonly found in data from general-use LLMs.
In October 2025, we constructed a survey in the Qualtrics survey builder reproducing the study design from Paxton and Yang (2024). This survey consisted of 11 questions: Age, Gender, Google search usage, and eight Likert study test questions related to attitudes and opinions of Google search (e.g., Comfort: How comfortable do you feel relying on Google Search? - Extremely comfortable, Very comfortable, Moderately comfortable, Slightly comfortable, Not at all comfortable). The full survey can be found here.
Synthetic data production was completed on October 15, 2025 when we created 584 synthetic responses following a US general population demographic distribution. We had initially requested 600 responses, but 16 synthetic respondents failed to complete the full survey and were eliminated for hallucinations prior to their responses being recorded in the final data set. We followed the synthetic data production with a human sample collected between October 21 and October 23 following the exact same US gen pop targeting criteria. Of that human sample, we collected 620 respondents, but removed 102 who did not meet the Qualtrics project management quality standards.
On first comparison of the two samples, we found that our Synthetic participants responded with a slightly lower frequency of Google search utilization when compared to the human sample (Table 1). This was considered a key variable in the original Paxton and Yang (2024) study for maintaining comparability between the synthetic outputs. Importantly, we did find that Product Use Frequency was positively correlated with at least six of our test variables. To account for the slight difference in sample compositions, we used a k-nearest neighbor matching procedure to identify optimal 1:1 matches9 based on Age, Gender, and Product Use Frequency. This procedure resulted in a final dataset of 518 matched human and synthetic respondents.
Comparison of Human and Synthetic data and the relationships with Product Use Frequency
|
Product Use Frequency |
Pearson Correlations (r) with Test variables |
|||||||||
|---|---|---|---|---|---|---|---|---|---|---|
|
Mean |
SD |
comfort |
control |
helpful |
infotrust |
pi |
reliable |
trust |
rmp |
|
|
Human |
4.73 |
0.59 |
0.19 |
0.06 |
0.25 |
0.14 |
0.12 |
0.15 |
0.09 |
0.00 |
|
Qualtrics Edge Audiences |
4.58 |
0.77 |
0.20 |
0.09 |
0.21 |
0.13 |
0.16 |
0.14 |
0.12 |
0.04 |
|
GPT |
- |
- |
0.83 |
0.22 |
0.51 |
0.31 |
0.45 |
0.37 |
0.65 |
-0.01 |
|
Gemini |
- |
- |
0.78 |
0.21 |
0.47 |
0.29 |
0.38 |
0.22 |
0.46 |
0.06 |
Note: Means (SD) are not provided for GPT or Gemini as these values were identical across all sample sources after the KNN 1:1 matching procedures.
Using the matched responses for Age, Gender, and Product Use Frequency, we then created our prompts for data generation using API calls to GPT-5 and Gemini. The general structure again followed the procedures outlined by Paxton and Yang (2024) where Age, Gender, and Product Use Frequency were used as seed variables prior to asking the model to respond to our test questions. A snippet from the prompting procedure is below:
The resulting dataset combining Qualtrics Edge Audiences, human respondents, GPT, and Gemini all matched on Age, Gender, and Product Use Frequency is provided here.
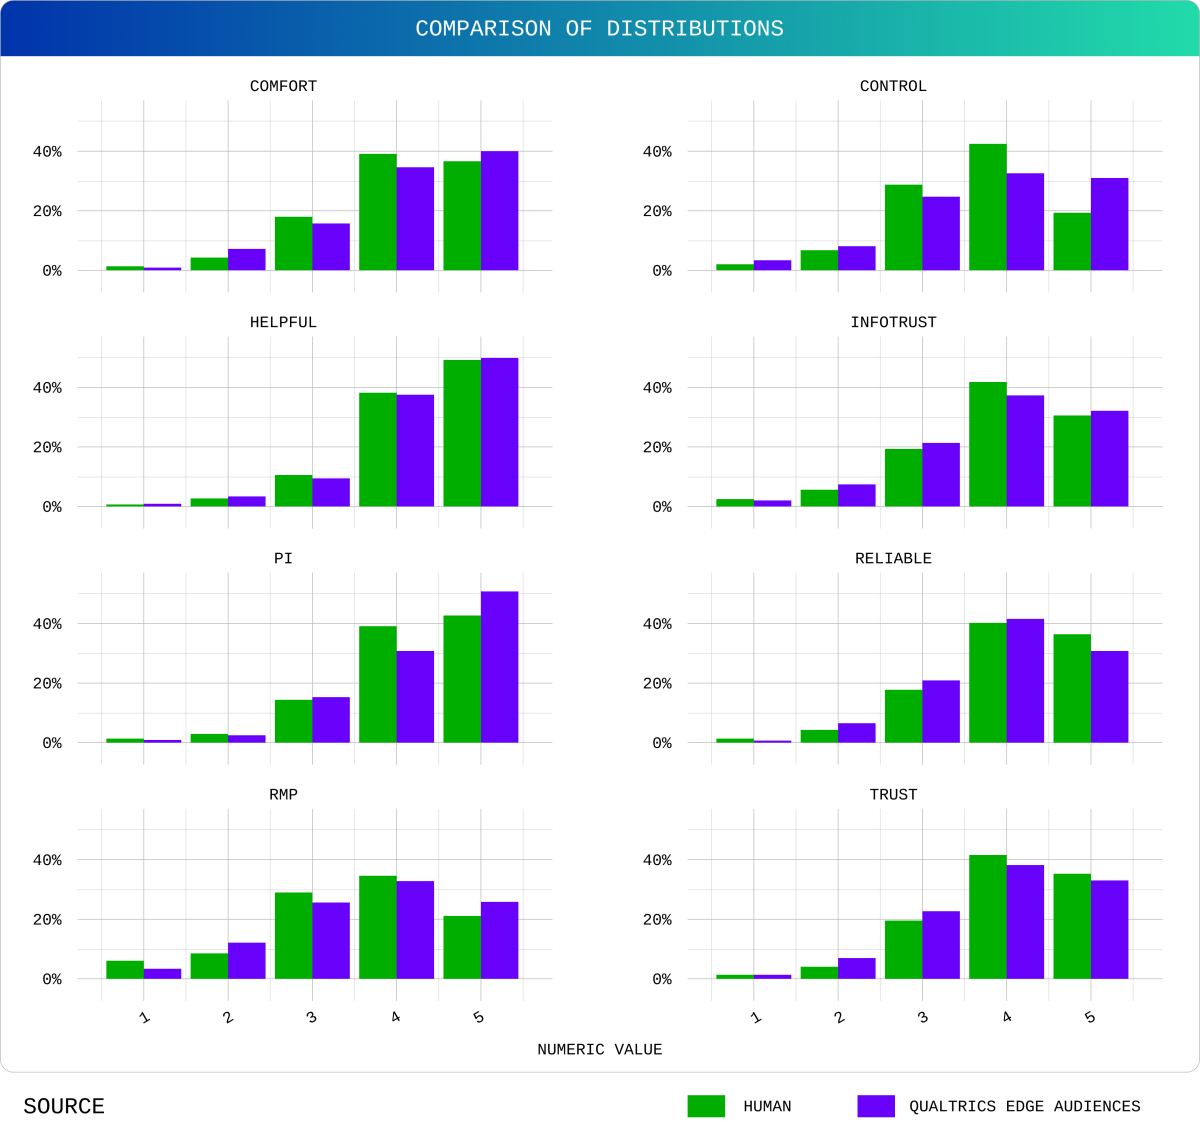
With the full dataset we compared the top-two box percentages for each modeled output to achieve the following comparisons in Figure 1. We can clearly see that the Qualtrics model was able to produce responses that mirror the human to a degree much higher than either GPT or Gemini when asked the same questions. Importantly, the margin of error bars are similar in size between human and Qualtrics Edge Audience properly reflecting the uniqueness in human response patterns. This is reflected in the full data distributions achieved by the Qualtrics model as well (Figure 2).
Figure 1.
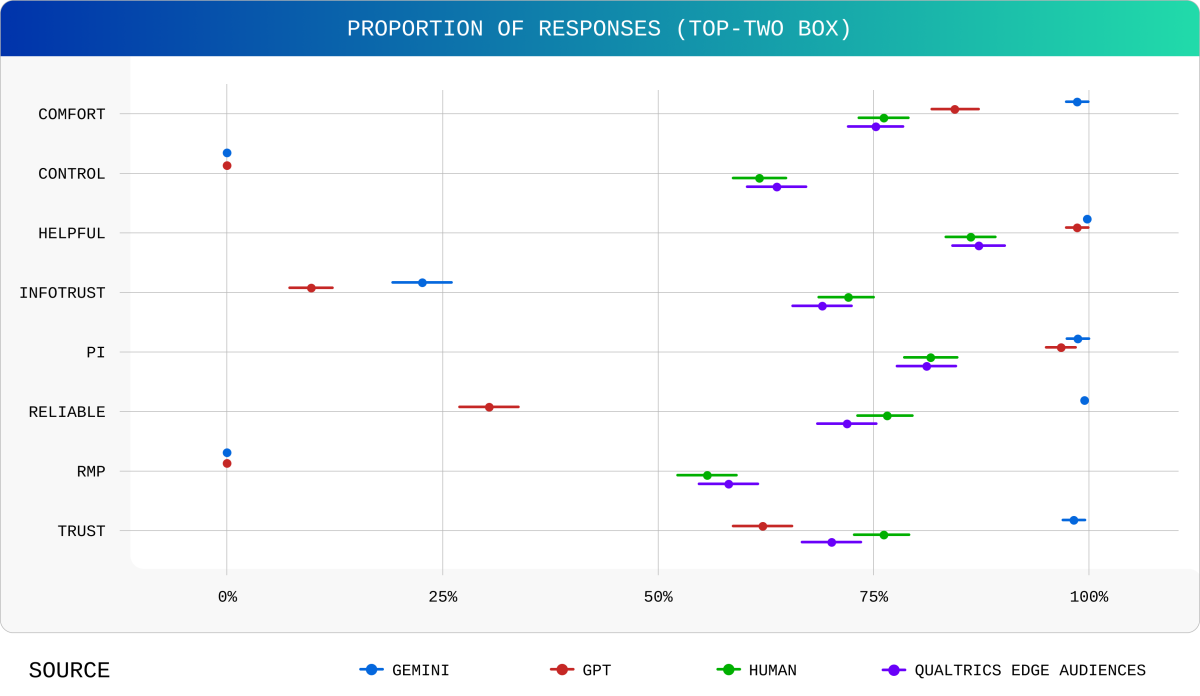
Figure 2.
The successful replication of both magnitude and distribution from the target human data can be summarized by a comparison of mean differences. Qualtrics Edge Audiences achieved an average deviation from human response means at just 0.07 of a standard deviation measured using Cohen’s D (raw mean difference = 0.07 scale points). This is compared to an average deviation of 0.87 standard deviations for GPT (raw mean difference = 0.63 scale points) and 0.88 standard deviations by Gemini (raw mean difference = 0.64 scale points). Based on these differences, we can conclude that our model is 12x more accurate than general-use LLMs across these questions based on Cohen’s D.
The natural question here is, “Why does our model work when so many others struggle to produce high-quality quantitative data?”. The honest answer is that the black box nature of large language models presents a challenge for definitive answers. As researchers, we need to investigate that black box with the same rigor and curiosity that has guided the study of human behavior for hundreds of years. Often, we cannot predict exactly what someone will say or do, but we can present a stimulus, let them process it, and observe their response. This approach to understanding complex systems through carefully designed experiments is well established and it’s exactly how we continue to explore and improve these models.
What we do know about the transformer model architecture is that fine-tuning with high quality data sets for context-specific applications has yielded great advancements in scientific research10, 11, 12. Our application at Qualtrics is based on fine-tuning a language model using a curated high-quality data set designed to train the model to understand human response patterns in the survey context at scale. The scale in which we can train our model is what appears to differentiate our work from others. You can’t take a trillion parameter model, trained on the open internet and capable of doing almost anything, to be hyper-proficient at doing just one thing: replicating the human response patterns in the survey context.
This study was particularly well suited to our Edge Audiences quantitative model. Through our testings, we have seen this model particularly adept at responding to Likert scale attitudinal, psychographical, and opinion based questions. All the questions from the original Paxton and Yang (2024) study were particularly well suited to our model strengths. We see slightly weaker performance when asking the model about context specific, past behaviors, and other use cases that generally fall into the bucket of consumer experiences. The model cannot know how your restaurant experience was last night. There are many research questions where human input is required. What synthetic data can do is give researchers an opportunity to explore a content area, refine their hypotheses and survey instruments, and identify key segments of consumers who might be better served by their products.
Free eBook: Synthetic data for business: 4 use cases to smarter research & growth
While we have shared how our model performs compared to human respondents and other general-use LLMs, it is important to note that this is not our only validation. As a company, we have been refining our synthetic models for over a year with multidisciplinary teams of researchers, engineers, data scientists, and practitioners involved along the way. Synthetic data has the potential to empower researchers to conduct more research, to ask more questions, and to serve our customers better. This study represents a small part of our ongoing validation and we are excited to continue our partnership with the research community to continue this work.
References
1. https://www.marketingweek.com/synthetic-data-real-insight-people/
3. https://www.adnews.com.au/opinion/synthetic-data-at-scale-the-next-frontier-of-market-research
4. Paxton, J. and Y. Yang (2024) “Do LLMs simulate human attitudes about technology products?” Paper presented at Quant UX Con 2024, June.
https://drive.google.com/file/d/16F_JZv4eHNiDMJT6BT7F6m97C2rBX8-7/view
5. Bisbee, J., Clinton, J. D., Dorff, C., Kenkel, B., & Larson, J. M. (2024). Synthetic Replacements for Human Survey Data? The Perils of Large Language Models. Political Analysis, 32(4), 401–416. doi:10.1017/pan.2024.5
6. Peng, Tiany & Gui, George & Merlau, Daniel & Fan, Grace & Sliman, Malek & Brucks, Melanie & Johnson, Eric & Morwitz, Vicki & Althenayyan, Abdullah & Bellezza, Silvia & Donati, Dante & Fong, Hortense & Friedman, Elizabeth & Guevara, Ariana & Jerath, Kinshuk & Kogut, Bruce & Lane, Kristen & Li, Hannah & Toubia, Olivier. (2025). A Mega-Study of Digital Twins Reveals Strengths, Weaknesses and Opportunities for Further Improvement. doi: 10.48550/arXiv.2509.19088. arXiv:2509.19088
7. Weber, S., Deperrois, N., Heun, R. et al. Using a fine-tuned large language model for symptom-based depression evaluation. npj Digit. Med. 8, 598 (2025). https://doi.org/10.1038/s41746-025-01982-8
https://www.nature.com/articles/s41746-025-01982-8
8. https://www.thedrum.com/news/what-s-the-big-deal-with-synthetic-data
9. Ho, D., Imai, K., King, G., & Stuart, E. A. (2011). MatchIt: Nonparametric Preprocessing for Parametric Causal Inference. Journal of Statistical Software, 42(8), 1–28. https://doi.org/10.18637/jss.v042.i08
https://cran.r-project.org/web/packages/MatchIt/MatchIt.pdf
10. Barrit S, Torcida N, Mazeraud A, Boulogne S, Benoit J, Carette T, Carron T, Delsaut B, Diab E, Kermorvant H, Maarouf A, Maldonado Slootjes S, Redon S, Robin A, Hadidane S, Harlay V, Tota V, Madec T, Niset A, Al Barajraji M, Madsen JR, El Hadwe S, Massager N, Lagarde S, Carron R. Specialized Large Language Model Outperforms Neurologists at Complex Diagnosis in Blinded Case-Based Evaluation. Brain Sci. 2025 Mar 27;15(4):347. doi: 10.3390/brainsci15040347. PMID: 40309809; PMCID: PMC12025783.
https://pubmed.ncbi.nlm.nih.gov/40309809/
11. Bai, Z., Zhang, Y. Z., Pang, Y., & Imoto, S. (2025). PharaCon: a new framework for identifying bacteriophages via conditional representation learning. Bioinformatics (Oxford, England), 41(3), btaf085. https://doi.org/10.1093/bioinformatics/btaf085
https://pmc.ncbi.nlm.nih.gov/articles/PMC11928753/
12. Jumper, J., Evans, R., Pritzel, A. et al. Highly accurate protein structure prediction with AlphaFold. Nature 596, 583–589 (2021). https://doi.org/10.1038/s41586-021-03819-2