
Working with Driver Results (Studio)
What's on this page
About Working With Driver Results
After you create a driver and run it to find the drivers in your data, you can access and view driver results, view statistical measures to evaluate the quality of your predictive model, set a minimum volume for drivers, and hide and unhide drivers.
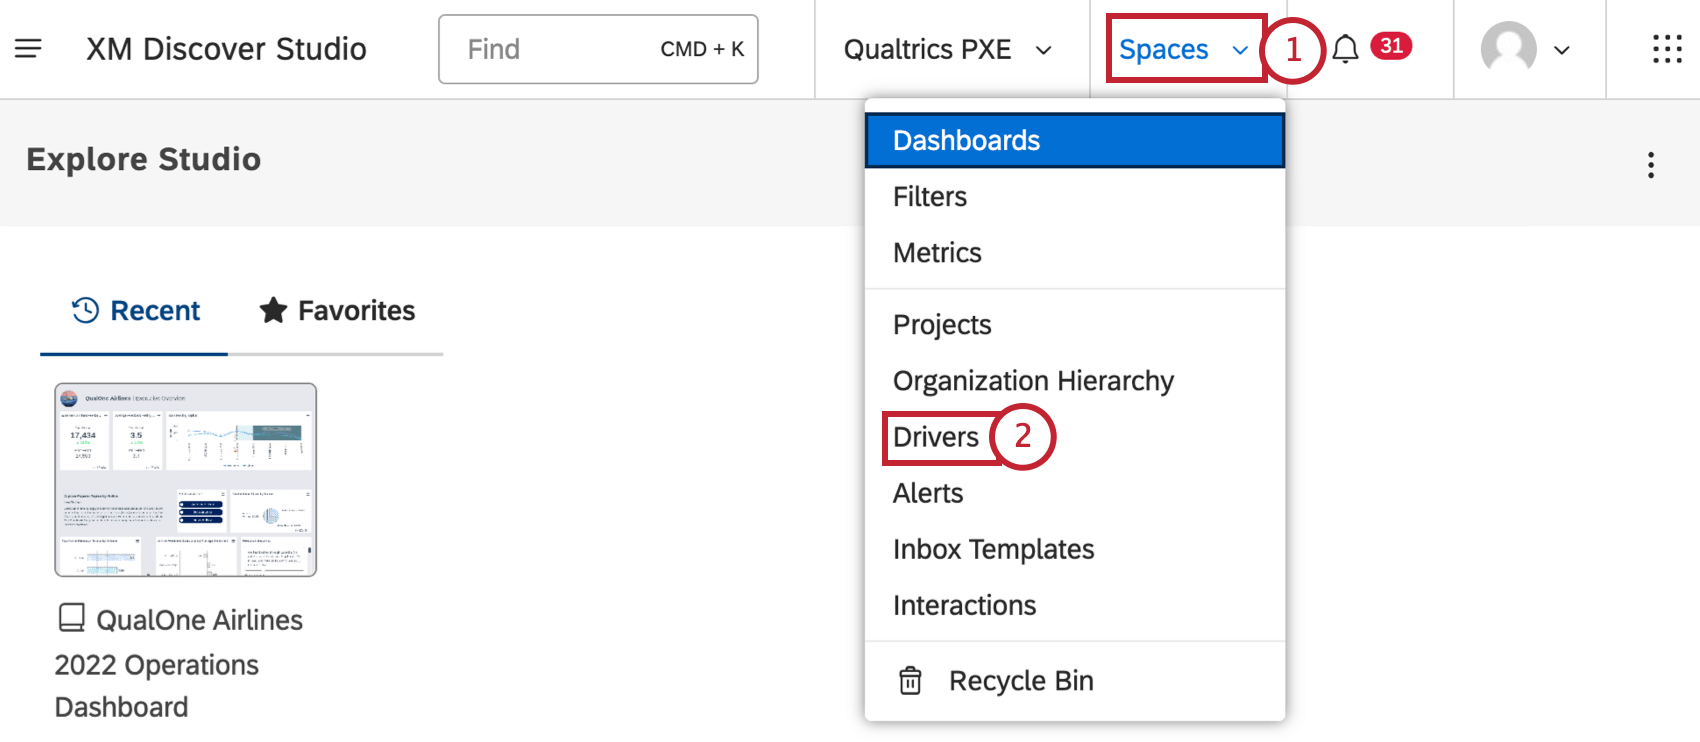
Accessing Driver Results
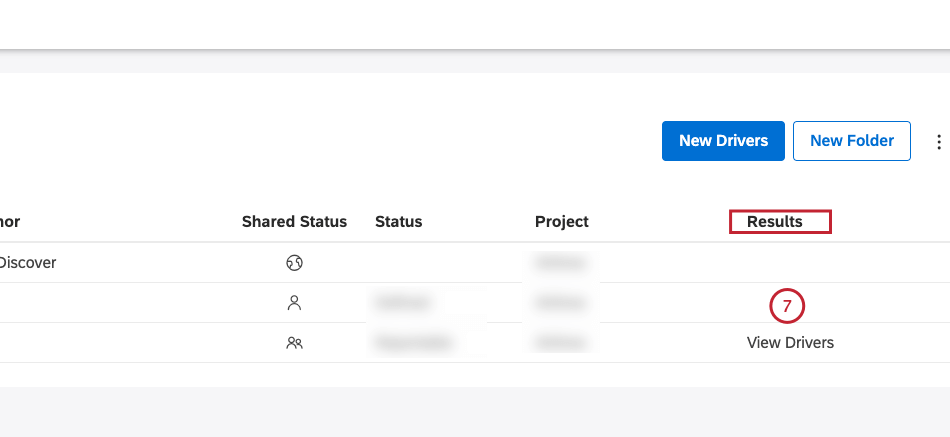
After you create a driver and find the drivers in your data, you can access driver results for your data in the Driver Results window.
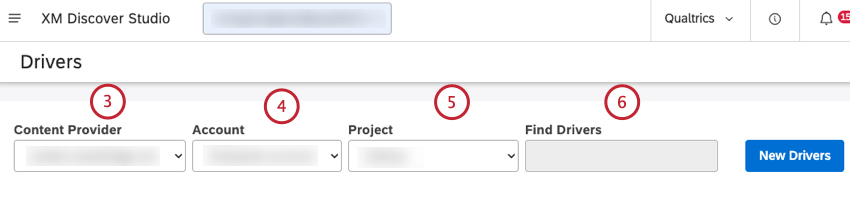
Qtip: You can enter the name of the driver in the Find Drivers box to find it.
Viewing Driver Results
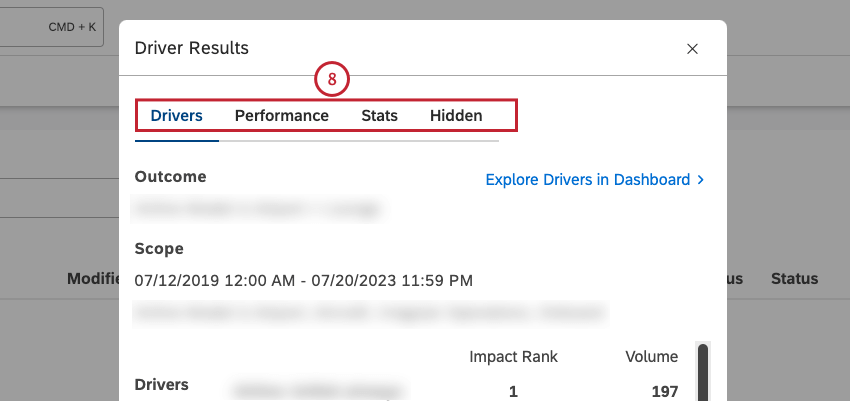
After you access driver results, you can view driver results in the Drivers tab in the Driver Results window. You can also drill to related feedback in document explorer, view inverse drivers, explore drivers in a dashboard, and hide and unhide drivers.
You can view the following information in the Drivers tab:
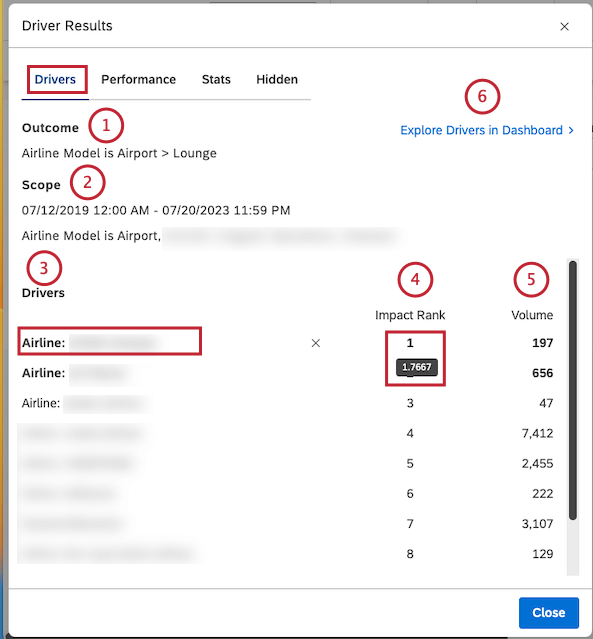
Qtip: Click the name of the driver to view the feedback behind it in document explorer.
Qtip: Hover your mouse over the number in the Impact Rank column to view the impact score.
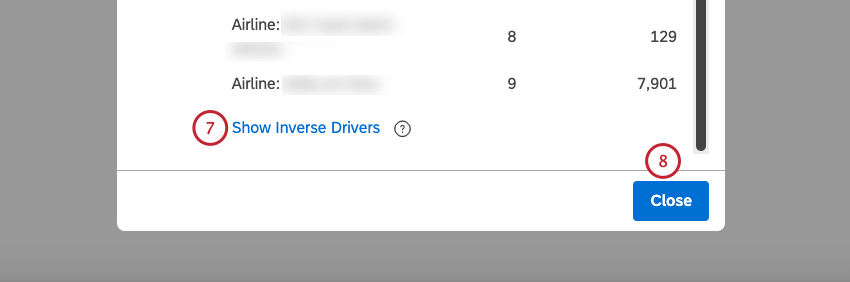
Qtip: Inverse drivers predict the binary opposite of your defined outcome. When inverse drivers occur, your original outcome is less likely to happen. When you are exploring a negative outcome, the drivers are things you should avoid, while the inverse drivers are things that you should seek out.
Impact Rank
Impact rank is the rank number of all drivers sorted by impact score. Impact rank prioritizes drivers by their ability to predict the defined outcome. A driver with a rank of 1 has more indicative power than a driver with a rank of 2 or more.
Impact rank derives from impact score, a metric that measures the power of a driver in predicting the chosen outcome. Impact score is a product of a unique machine learning model generated for the drivers.
Impact score is normalized, which means it’s relative to other drivers in the same find drivers run. The impact score’s values most commonly fall between –1 and 1.
Impact Score Tips
When analyzing drivers by the impact score, follow these tips:
- Do not fixate on the Impact score’s decimal values: The primary intent of the impact score’s decimal values is to rank and differentiate stronger drivers from weaker ones. Decimal values do not provide statistical significance on their own.
- Pay attention to Drivers with Impact score close to or above 1: Drivers with an impact rank value close to or above 1 are stronger predictors of your outcome.
- Equally important, pay attention to Drivers with an impact score close to or below –1 (inverse Drivers): Drivers with impact score’s value close to or below –1 are stronger predictors of the binary opposite of your outcome. These are called inverse drivers. For example, if you were hunting for drivers of detractor ratings, a strong negative value would be a driver for not-detractor, or passives and promoters.
- Treat the Impact score as a non-linear metric: For example, an impact score of 0.4 is more than twice as strong as an impact score of 0.2.
- Keep in mind the impact score is normalized: The impact of normalization is that removing results from subsequent re-calculations of drivers will likely result in an increase or decrease in other drivers’ impact score values. For example, removing one very strong driver means predictions have to be made with the remaining data, which may result in other drivers becoming more or less important.
- Differentiate Drivers by a second metric like % Total, Sentiment, or Effort: For example, if two different drivers have the same impact score but very different % Total rates, you likely want to focus exploration on the more prevalent driver.
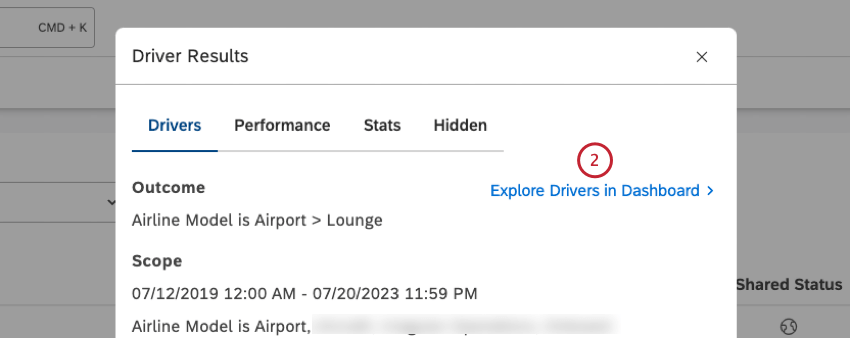
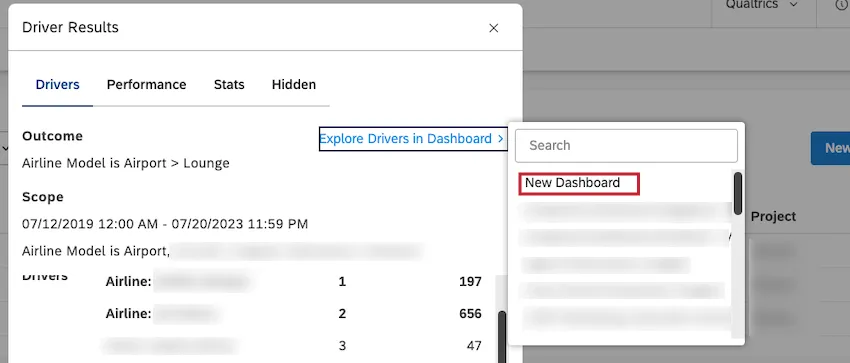
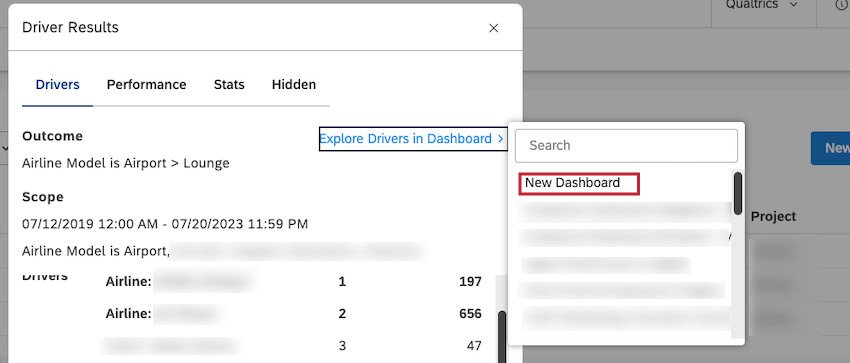
Exploring Drivers in a Dashboard
You can add a scatter widget grouped by drivers to any of your dashboards or to a new dashboard.
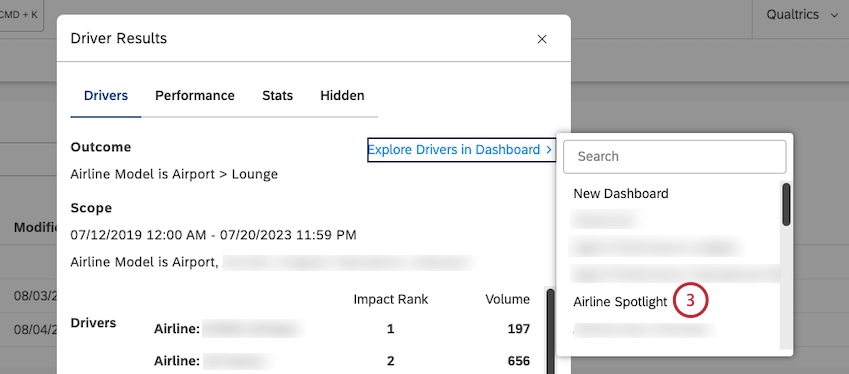
Qtip: To add a scatter widget to a new dashboard, click New Dashboard at the top of the list.
- Date range: Same as in the scope of investigation
- Filters: Synced to the Driver
- Vertical axis calculation: Impact Score
- Horizontal axis calculation: Volume
- Group by: Drivers
Hiding and Unhiding Drivers in Drivers Results
After you access driver results, you can view driver results, and hide drivers that are not useful for your analysis.
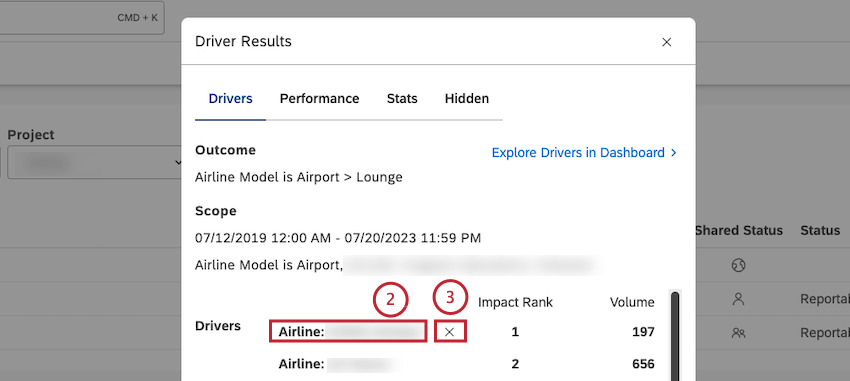
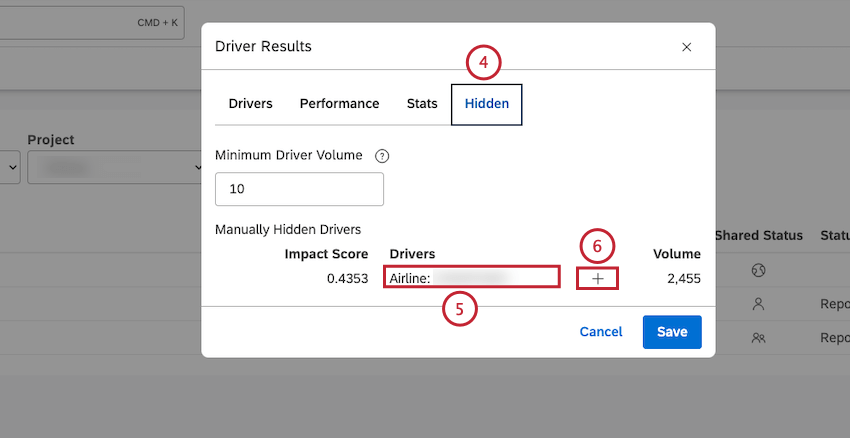
Qtip: Hidden drivers do not appear in the Drivers tab and in widgets where you use these hidden drivers. You can view a list of drivers that were manually hidden in the Hidden tab.
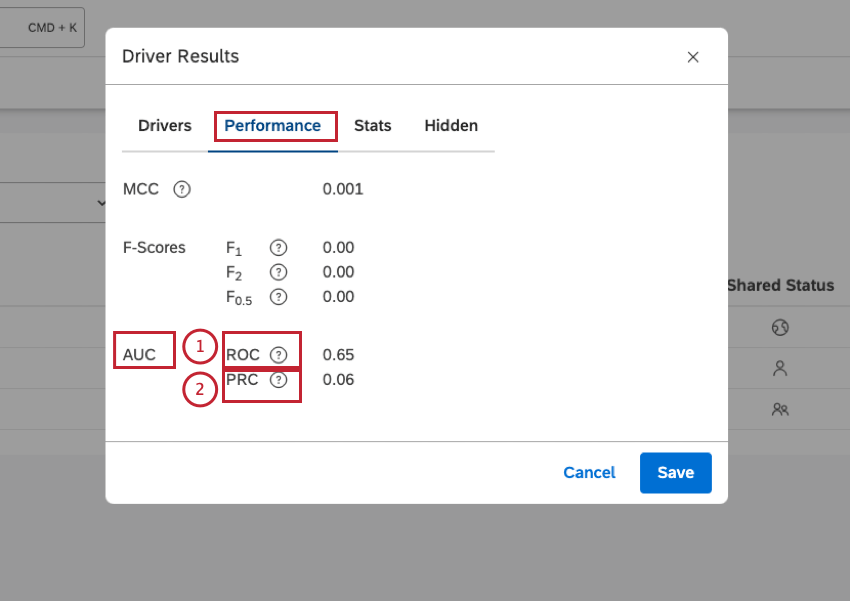
Evaluating Model Performance
After you access driver results, you can view statistical measures to evaluate the quality of your predictive model in the Performance tab in the Driver Results window:
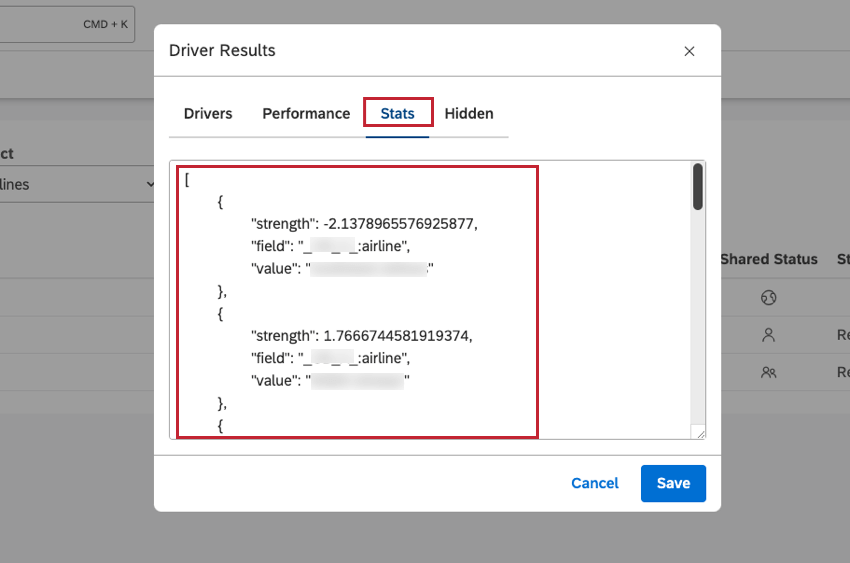
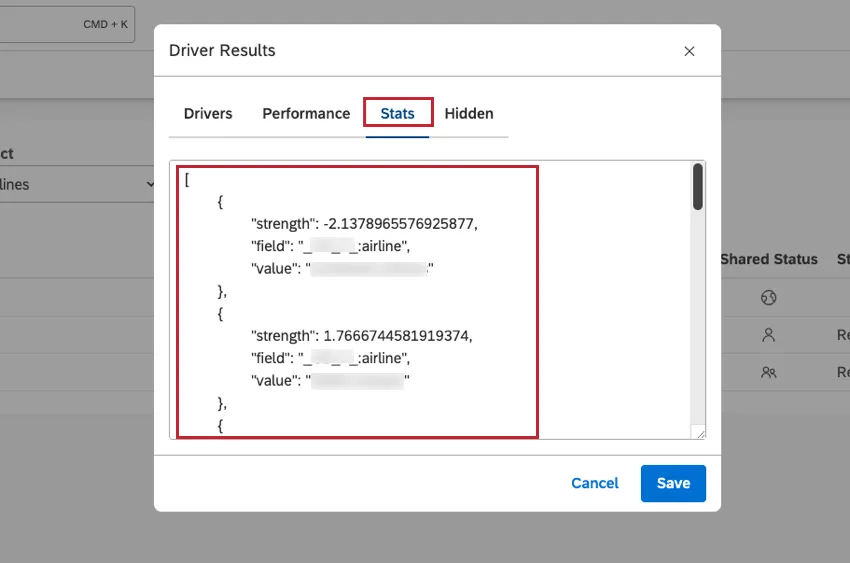
Viewing Driver Results in JSON Format
After you access driver results, you can view driver results in JSON format in the Stats tab in the Driver Results window. This is useful for troubleshooting purposes.
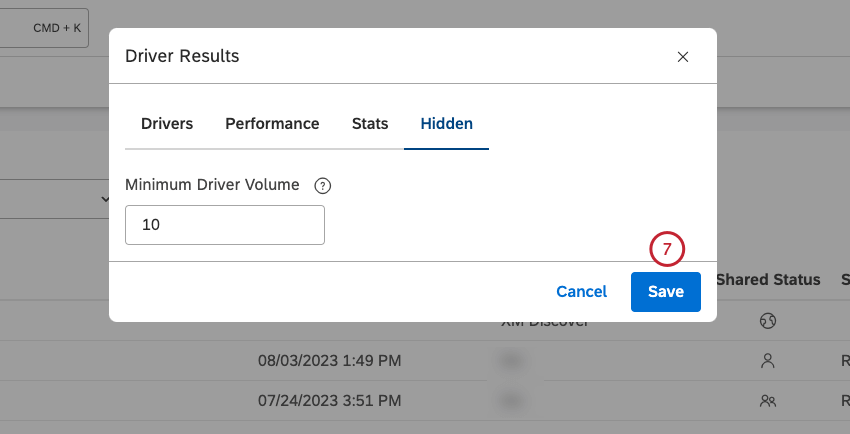
Setting Minimum Volume for Drivers
After you access driver results, you can define the minimum number of documents that would qualify each potential driver for evaluation.
The drivers analysis will sample the million documents down to 50,000 random documents, then use that sample to find drivers. If your scope contains less than 50,000 documents, no sampling occurs. This means that if the scope is larger than 50,000 documents, you may get slightly different drivers the second time you run it (all else being equal) due to that sampling. However, this typically impacts the lowest-volume items the most, which are arguably the least valuable.
Potential drivers with very low volumes may be under-represented or over-represented in the sampled datasets. We recommend filtering these drivers out from graphs using a minimum volume threshold. Keep in mind, however, that these small-volume drivers can be useful to identify small groups of customers that need tactical responses.
You may also see minor variations in impact scores due to natural sampling variations. One other potential cause of this is loading or removing data from the project within the specified
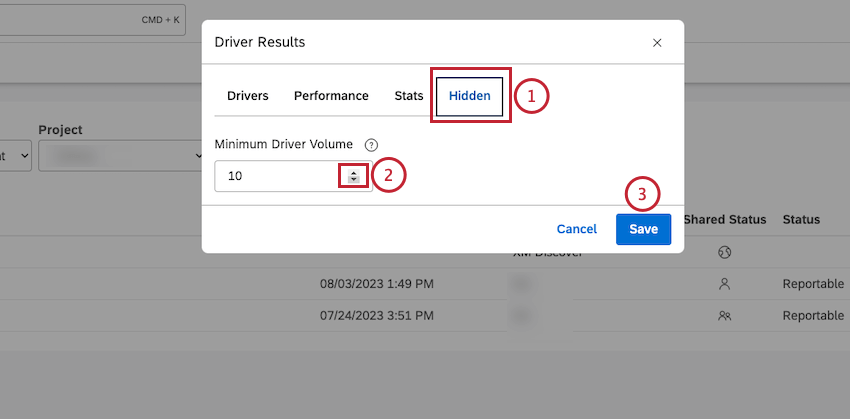
Qtip: Alternatively, you can enter a number into the box.
That's great! Thank you for your feedback!
Thank you for your feedback!