

Customer loyalty is the foundation of sustainable business growth, dictating everything from repeat purchases to brand advocacy. To measure this consumer sentiment, organizations rely on the Net Promoter Score (NPS), a standardized metric that subtracts the percentage of unhappy customers (detractors) from the percentage of enthusiastic advocates (promoters).
However, earning a promoter is not equally challenging across all sectors. Consumer expectations are heavily influenced by the nature of the product, the frequency of interaction, and the level of available competition. Evaluating an NPS in a vacuum often paints an incomplete picture; a "low" score in a volatile industry might actually represent market leadership.
In our latest Q3 2025 analysis, over 10,000 U.S. consumers evaluated their recent experiences with major brands, revealing stark contrasts in how different sectors build trust. The findings highlight not only which industries excel at creating advocates but also how internal consistency and generational preferences shape the current consumer landscape.

<center>
<textarea readonly>
<a href="/articles/customer-experience/2025-nps-rankings-infographic/">
<img src="/sites/default/files/2026-10/qualtrics-net-promoter-score-infographic-v1-2026-10-01---approved-for-publication.png" alt=" 2025 Net Promoter Score Rankings by Industry— Infographic" title="2025 Net Promoter Score Rankings by Industry — Qualtrics— Infographic"></a><br><a href="https://www.qualtrics.com/" title="Qualtrics Home">By Qualtrics</a>
</textarea>
</center>
Key takeaways
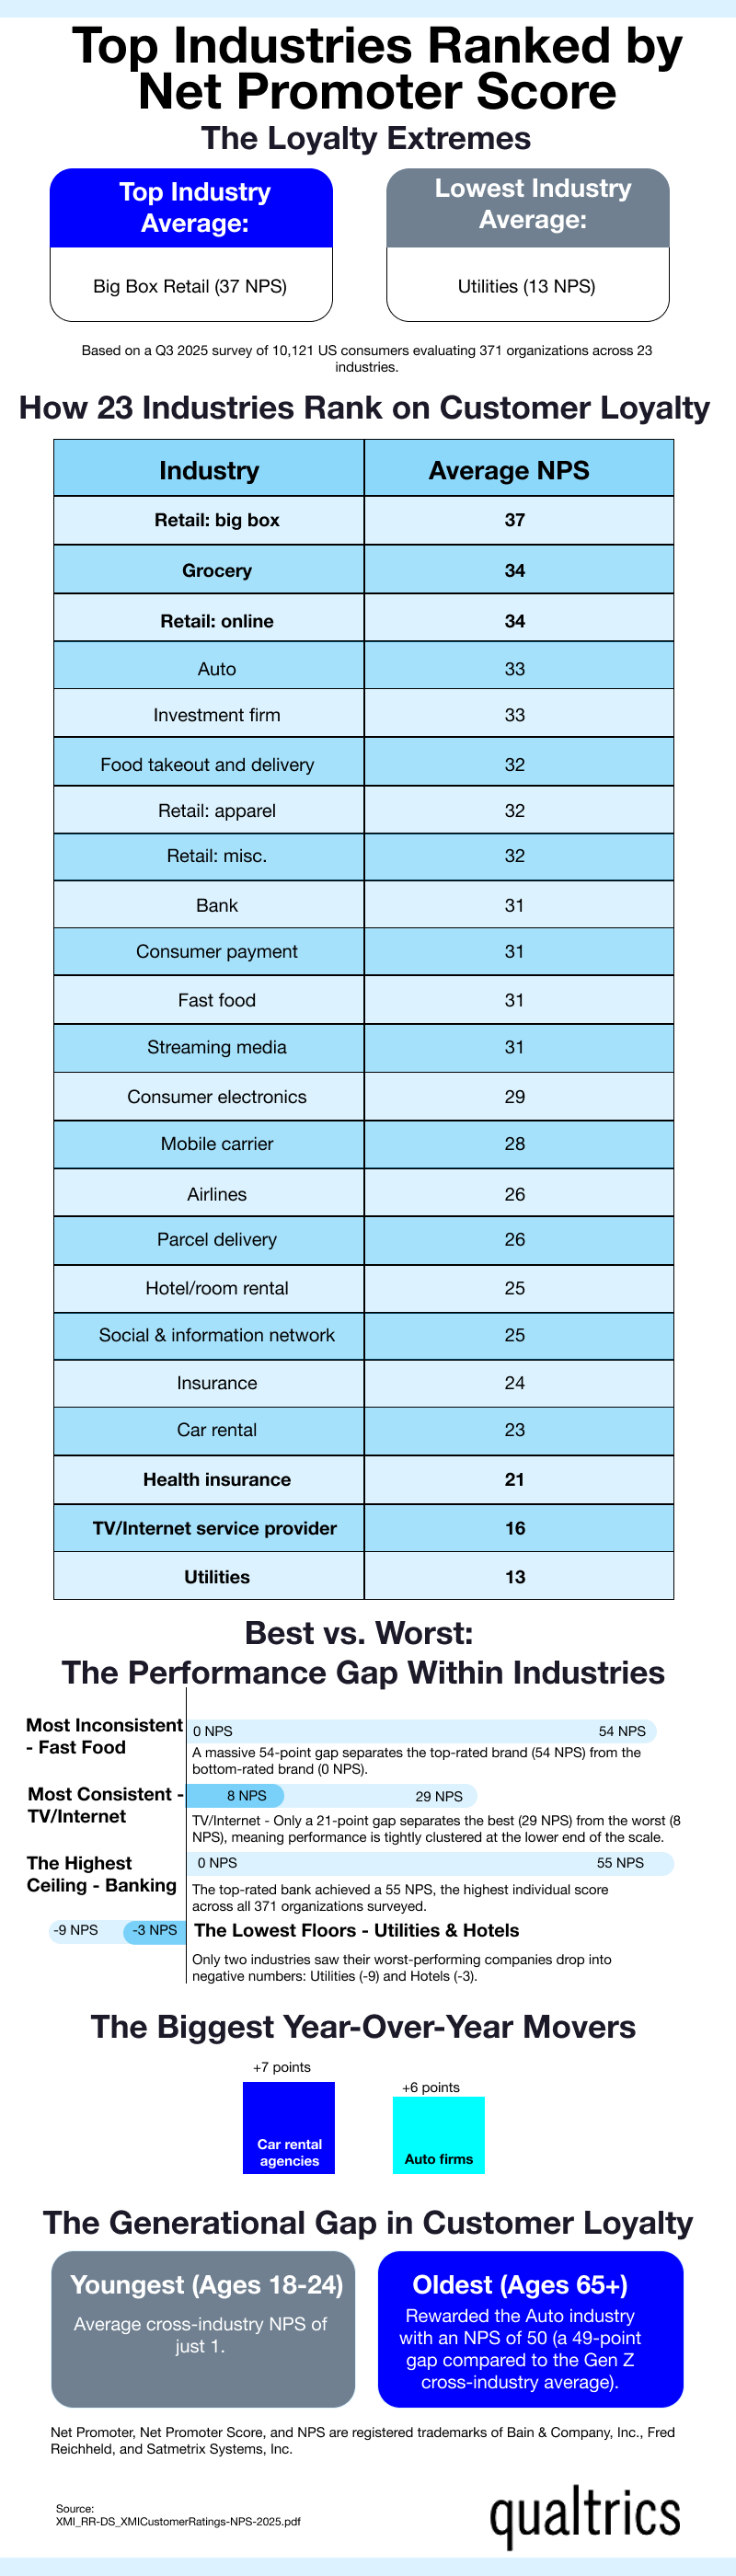
- Big box retail earns the highest average industry NPS at 37, while utilities have the lowest at 13.
- The fast food industry experiences the widest internal performance gap, with a 54-point spread between its highest- and lowest-rated brands.
- Banking claims the highest-rated individual organization in the study, achieving a peak brand NPS of 55.
- Car rental agencies and auto firms showed the strongest year-over-year momentum, gaining 7 and 6 points, respectively.
- Generation Z (ages 18–24) averages a cross-industry NPS of just 1, demonstrating significantly lower baseline brand loyalty than older consumer cohorts.
Consistency vs. volatility in customer experience
A high industry average does not guarantee that every brand within that sector is succeeding. The 2025 data demonstrates massive internal performance gaps within certain categories, meaning a consumer's experience is highly dependent on the specific brand they choose. The fast food industry is the most volatile, featuring a 54-point gap between the highest-scoring brand (54 NPS) and the lowest (0 NPS).
Conversely, the TV and internet service provider sector is the most internally consistent, though that performance clusters tightly at the lower end of the scale. The gap between the best brand (29 NPS) and the worst brand (8 NPS) in this sector is only 21 points.
High ceilings and negative floors
While retail categories generally perform well across the board, the banking sector holds the highest individual ceiling for customer advocacy. The top-rated bank in the survey achieved a 55 NPS, the highest single score among the 371 organizations evaluated
On the opposite end of the spectrum, negative Net Promoter Scores indicate that a brand has more active detractors than promoters. This represents a critical risk for customer churn. Only two industries had brands that dipped into negative territory this year: utilities dropped to -9, and hotels reached -3.
The generational divide in brand loyalty
Age plays a significant role in how consumers rate organizations, with younger buyers showing much more skepticism and restraint when recommending brands. Respondents aged 18 to 24 yielded an average cross-industry NPS of just 1.
Older consumers demonstrate a much higher baseline for brand advocacy, particularly in established sectors. Respondents aged 65 and older rewarded the auto industry with an NPS of 50, creating a 49-point generational loyalty gap when compared to the Gen Z cross-industry baseline.
Methodology
Data is based on a Q3 2025 survey of 10,121 consumers in the United States. Respondents evaluated 371 organizations across 23 different industries. Net Promoter, Net Promoter Score, and NPS are registered trademarks of Bain & Company, Inc., Fred Reichheld, and Satmetrix Systems, Inc.
About Qualtrics
Qualtrics provides actionable insights and data-driven research to help organizations understand consumer sentiment, optimize customer experiences, and drive long-term brand loyalty.
Frequently asked questions
What is considered a good Net Promoter Score?
NPS can range from -100 to 100. What constitutes a "good" score varies heavily by industry context. For example, a score of 30 might be exceptionally high for a mobile carrier, but below average for a grocery chain. Benchmarking against direct industry competitors is the most accurate way to evaluate performance.
Why do utilities and internet providers have the lowest NPS?
Industries with limited consumer choice, regional monopolies, or those associated with mandatory monthly bills—like utilities (13 NPS) and TV/Internet providers (16 NPS)—traditionally experience more friction and consistently score lower on consumer loyalty metrics than retail or hospitality sectors.