
Benchmarks are incredibly seductive, but often misleading tools in the world of Experience Management (XM). External benchmarks offer quick comparisons, but they can be profoundly misleading without thorough internal context, an understanding of data nuances, or localization factors. For both Customer Experience (CX) and Employee Experience (EX) programs, the foundational objective must remain focused on driving concrete action and quantifiable XM and business improvement. Over-reliance on external scores can easily result in complacency or a distracting focus on "score chasing", rather than sustainable organizational success. The solution isn't abandoning benchmarks. It's using them correctly within a disciplined approach that combines external context with internal trends and driver analysis.
In this guide, you will learn:
- Four common types of benchmarks and when to use each (industry, internal, competitive, journey)
- Three common benchmarking mistakes and how to avoid them
- How to use the 4-step triangulation process to set realistic, actionable targets
Understanding types of benchmarks
Four types of benchmarks are commonly used in the context of running CX and EX programs. Knowing which benchmark to use and when, prevents the most common mistake made by CX and EX practitioners: chasing your competitor's NPS without understanding why your scores differ.
Industry Benchmarks
Industry benchmarks compare your industry’s performance at an aggregated level against other industries. These benchmarks use established cross-industry standards, such as Qualtrics’ XMI Customer Ratings – Overall, which utilizes a composite metric based on dimensions like success, effort, and emotion. Reputable providers often offer specific industry or country benchmarks for sectors like Airline, Banking, Health Insurance, or Retail.
Use Industry Benchmarks when:
- Securing executive buy-in for XM program/improvement initiative investment
- Measuring your performance against industry averages or against other industries, to see where you stand
Internal Benchmarks
Internal benchmarks form the foundation for trend analysis and establishing a trustworthy baseline. They compare your current performance against your own historical data, allowing you to measure genuine progress.
Use Internal Benchmarks when:
- Tracking your XM program effectiveness over time
- Setting realistic CX and EX metric targets that are rooted in historical trends and capabilities
- Measuring statistically significant improvement in your CX and EX metrics
Competitive Benchmarks
These benchmarks involve direct comparison against your main competitors to understand your precise relative market position. Tools like Qualtrics’ benchmark editor can be used to compare your data against others, providing guidance on your position rather than just providing an absolute score.
Use Competitive Benchmarks when:
- Making strategic positioning decisions on where to invest in improving experiences
- Responding to competitive threats in the marketplace
- Better understanding your relative market position against competitors for metrics such as CSAT or NPS scores
Journey Benchmarks
Journey-based benchmarks focus on measuring specific interactions or critical touchpoints within the customer journey (CX). Or in the case of EX programs, this could mean focusing on key employee lifecycle interactions, such as the onboarding process, training, or exit experience.
Use Journey Benchmarks when:
- Prioritizing which specific touchpoints or interactions to improve
- Allocating resources efficiently to maximize impact on the overall experience
Proven use cases that work
Benchmarking can provide the context that leadership needs and helps to identify and prioritize specific areas for improvement. When executed correctly, investing in closing experience gaps shows a proven Return on Investment (ROI).
A primary use case is providing executives with the context for changes in performance. Benchmarking also helps articulate the business value of experience improvements. For instance, Qualtrics XM Institute’s cross-industry research demonstrates that 81% of respondents who considered their experience easy intend to purchase more, compared to just 17% of those who found it difficult. These metrics confirm that if benchmarking reveals that your organization is lagging, there is clear financial ROI in addressing that gap.
Another critical use case is internal progress tracking. Benchmarking your current performance against your own past performance is essential for validating strategic initiatives and tracking continuous improvement over time. This process involves regularly reviewing progress towards targets and identifying the specific drivers of change. When tracking internal trends, the focus should be on achieving statistically significant improvement rooted in historical data, which helps distinguish real change from mere noise in the data.
When setting targets, it is unfair to apply one blanket baseline score across all business lines. Rather it is critical to set targets at a more granular, segmented level e.g. by region/location, product or Business Unit. This level of detailed tracking ensures that resources are invested in improvements that truly shift the needle.
Common mistakes and how to fix them
To ensure your CX or EX measurement program effectively drives action, it is vital to avoid common pitfalls associated with benchmarking.
Common Mistake #1: Using external benchmarks as the only input
Why it's problematic:
Using external benchmarks as the sole input for setting goals or assessing performance can lead to serious errors. Differences in survey methodology, metric scaling, or customer incentives often render absolute external scores an "apple to oranges" comparison.
This can also be highly disengaging for frontline employees if they are given a high-level target (like a top-line NPS goal) over which they feel they lack agency.
What to do instead:
External bBenchmarks must be treated as one input, not the only input. The most effective strategy is the triangulation approach, combining external comparisons with robust internal data.
Common Mistake #2: Designing XM programs for the benchmark instead of the business
Why it's problematic:
Setting targets strictly to match an external benchmark can incentivize employees to "game" the system or engage in undesirable behaviors. This diverts organizational focus and resources away from achieving genuine customer or employee experience improvements. The pressure to achieve a score may outweigh the motivation to focus on the necessary actions.
What to do instead:
Targets must fundamentally align with the overall organizational strategy and business goals, ensuring they contribute to organizational success. Alignment is key and so its critical to ,ask: "If we focus on this CX Metric, what behavior is this going to drive in our people?".
Common Mistake #3: Ignoring contextual nuance
Why it's problematic:
Critical contextual factors are often overlooked. These include the reliability of the data source (less reliable benchmarks can be found through simple internet searching), availability (some industries, particularly B2B, lack public CX benchmarks), and localization (global companies must consider regional context and cultural norms when comparing scores). Furthermore, large internal business decisions (CapEx/OpEx investment/divestment) or macroeconomic changes can invalidate the continued use of old benchmarks for performance measurement.
What to do instead:
When external benchmarks are available, rely on a reputable source. When external data is scarce (e.g., in niche B2B markets), rely heavily on your internal data and focus purely on measuring significant internal improvement. Benchmarks should be used only to understand your relative position, not as an absolute score to chase.
Four steps for using benchmarks to set realistic targets
Experience Management requires realistic goals rooted in historical trends, industry performance, and organizational capabilities. The best practice for successful CX and EX target setting is to use a triangulation approach. This framework integrates multiple data points to create achievable, meaningful targets and is conducted as follows:
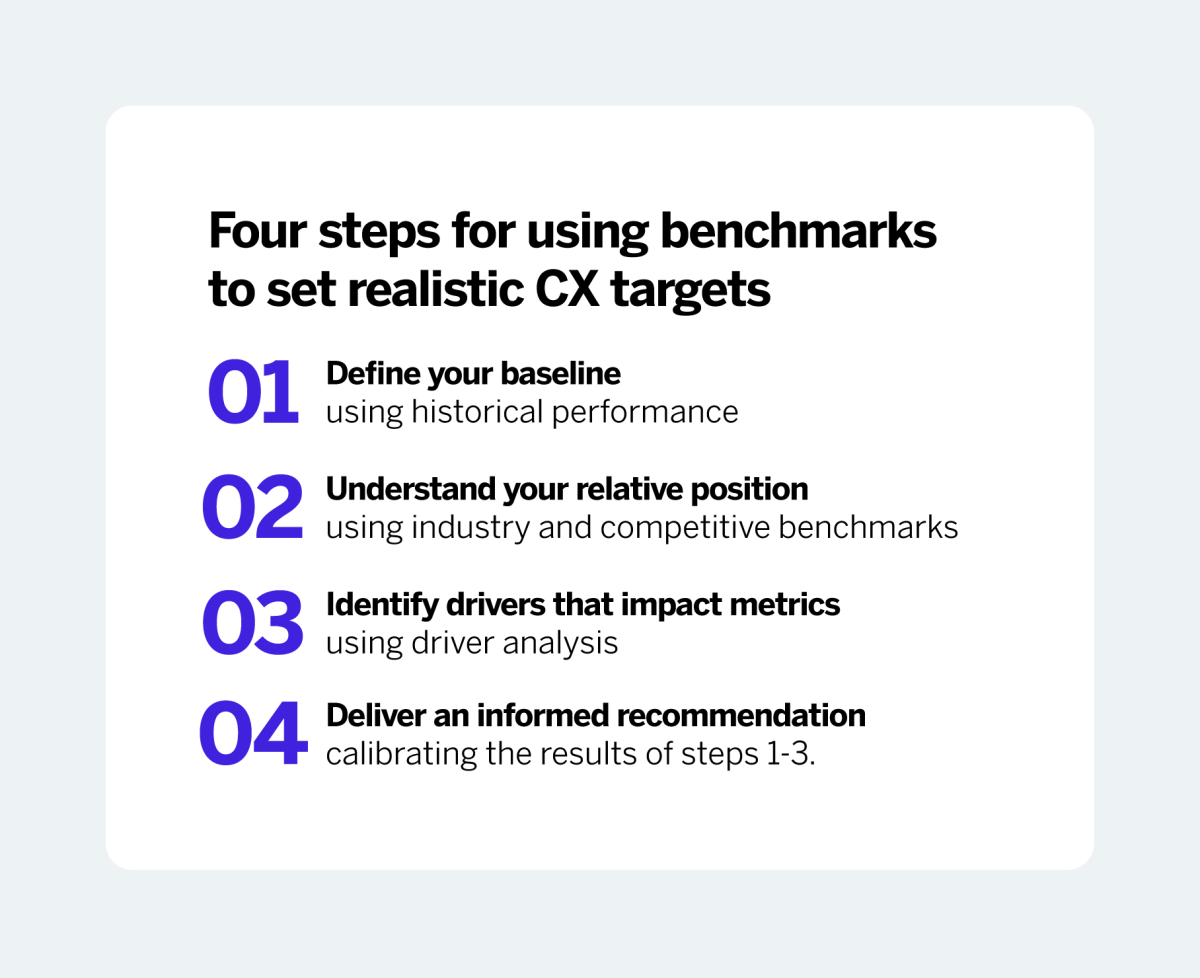
Step 1: Start with internal historical performance as your baseline
The process begins internally by reviewing historical trends and setting a trustworthy baseline. This step involves analyzing segmented data (such as historical key metric and driver scores based on different regions/products or BUs) to calculate the historical rate of change and account for anomalies (like major geopolitical events or sampling changes). Establishing a realistic baseline helps ensure that targets represent a statistically significant change, rather than just data fluctuation.
Step 2: Layer in industry and competitive benchmarks to understand relative position
Once internal capability is understood, industry benchmarks are incorporated to evaluate your organization’s position relative to competitors and how that position has evolved over time. This information helps inform the application of performance bands (low, medium, and stretch targets). Industry data should be used to understand relative position, never as an absolute target score.
Step 3: Deep dive into drivers
When driver insights are available, look beyond the topline metric to analyze key drivers. Understanding the drivers allows you to assess your CX and EX strengths and weaknesses relative to rivals, which is critical for making strategic decisions about where to invest resources.
Step 4: Use journey benchmarks to prioritize specific improvements
The final step is to align improvements with specific, high-impact interactions. Identify the key drivers of your core CX or EX metric and know their relative importance. By using journey-based benchmarks, you can prioritize improvement initiatives that target root causes and allocate resources where they will have the biggest effect. This is critical for connecting high-level metrics (e.g., Relational NPS) down to specific transactional targets (e.g., CSAT for install process).
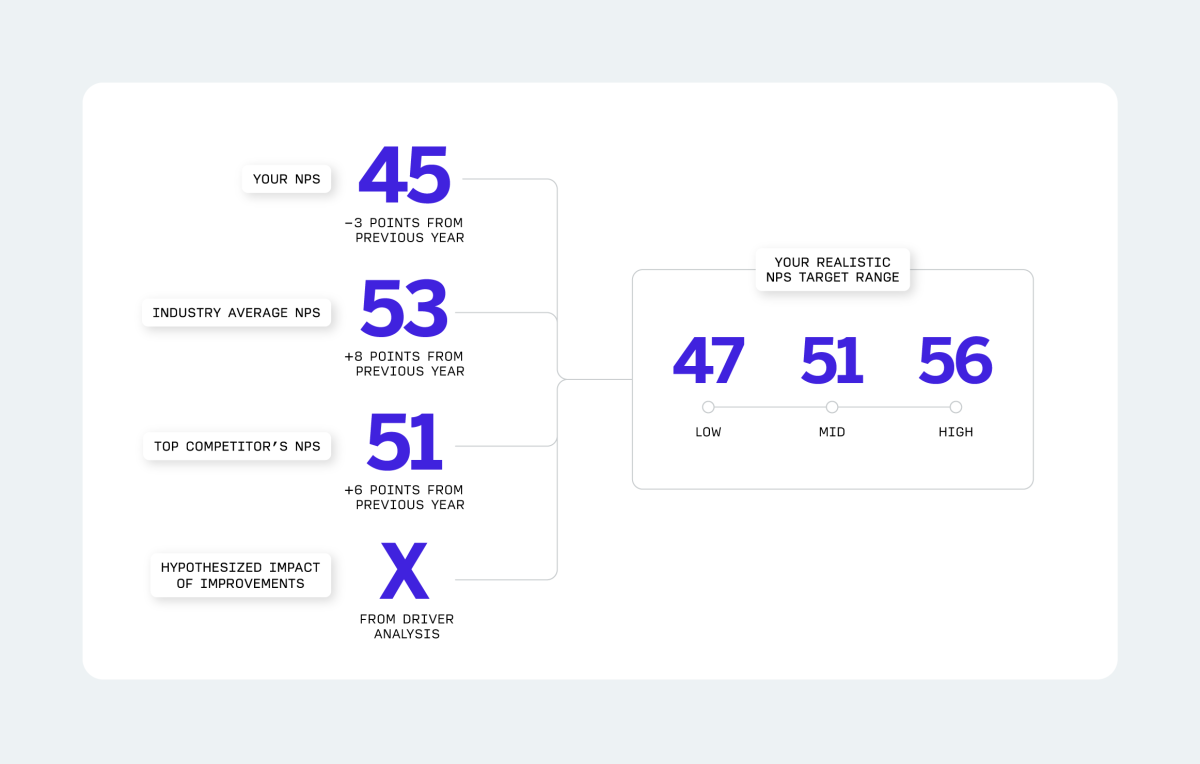
Triangulation analysis example
Let’s say your relationship NPS is 45, down from 48 last year. The industry benchmark is 53 and your main competitive rival is scoring 51.
Running the Analysis:
- Internal Baseline: The negative internal trend (48 → 45) indicates that, regardless of external scores, your current strategy or resource allocation is failing to maintain the baseline. This 3-point decline needs immediate driver analysis to determine the root cause of the drop.
- Relative Position: You are significantly lagging both the industry average (53) and your main rival (51). While the industry benchmark shows a gap of 8 points (53-45), the primary strategic concern should be the competitor gap (51-45), as well as your internal decline. This gap confirms the need for accelerated improvement.
- Driver Analysis: Understand which drivers have most closely correlated to your key metric scores historically. Identify which investments and strategic decisions have historically impacted changes in performance for these drivers, and use this to determine the potential impact of known business changes coming in the next year.
- Actionable Insight: Since external benchmarks are high, setting an unrealistic goal of 53 may lead to gaming. Instead, set a realistic range (e.g., 47+) based on your historical rate of improvement (or lack thereof) and the hypothesized changes based on your driver analysis completed in the prior stage.
Specific red flags to avoid
Even when meticulously performing triangulation, several data red flags must be avoided:
- Self-selected samples: Relying on data where participants are not representative.
- Inconsistent methodology: Comparing data sources where survey design, metric calculation, or sampling techniques vary significantly.
- Cherry-picked timeframes: Using specific periods that artificially inflate or skew results.
- One Blanket Target: Avoid setting a single target across all segments, lines of business, or geographical regions, as performance levels and cultural norms vary greatly. Targets must be set at a sufficiently granular level.
Benchmarking is an indispensable component of successful CX and EX programs, serving primarily to provide strategic context, justify investment, and track progress. However, chasing an absolute external score leads to misaligned priorities and potential organizational failure. Success hinges on the discipline of triangulation. By combining internal trends (to set realistic, statistically grounded baselines) with external data (to understand relative position and key drivers), organizations can prioritize initiatives that truly deliver impactful and sustainable experience improvements.
Getting started
To get started apply the approach discussed in this article, follow this 5-point plan:
- Identify which benchmark type makes the most sense given your industry and reason for needing benchmarks.
- Determine granularity of benchmarks required (e.g. are benchmarks required at a company wide level or at a property/location/team level) and collect historical data to establish a statistically valid baseline.
- Determine known changes in the coming year (e.g. known strategic priorities, areas of increased/decreased CapEx/OpEx investment, expected macro economic facts).
- Determine what experience and operational drivers could be impacted by these changes, focusing improvement efforts on controllable drivers.
- Determine extent to which external benchmarks are required to augment internal data and seek out these benchmarks accordingly.