
During the previous two years, we’ve seen organizations use their Experience Management (XM) capabilities to navigate the changing COVID environment. So we decided to examine the impact that XM has had on financial performance over that period.
To do the analysis, we examined the top 20 and bottom 20 publicly traded U.S. companies in our XMI Customer Ratings – Overall from 2019 (the year before the pandemic) and then tracked their stock performance through the end of 2021. We normalized the XM leaders’ and XM laggards’ stock price against that of their respective industries to ensure we’ve captured the performance of the companies themselves instead of the larger changes in industry-wide performances due to market circumstances, like travel restrictions’ effect on the airline and hotel industries’ performance (for more detail, see Methodology section below).
Here’s what we found…
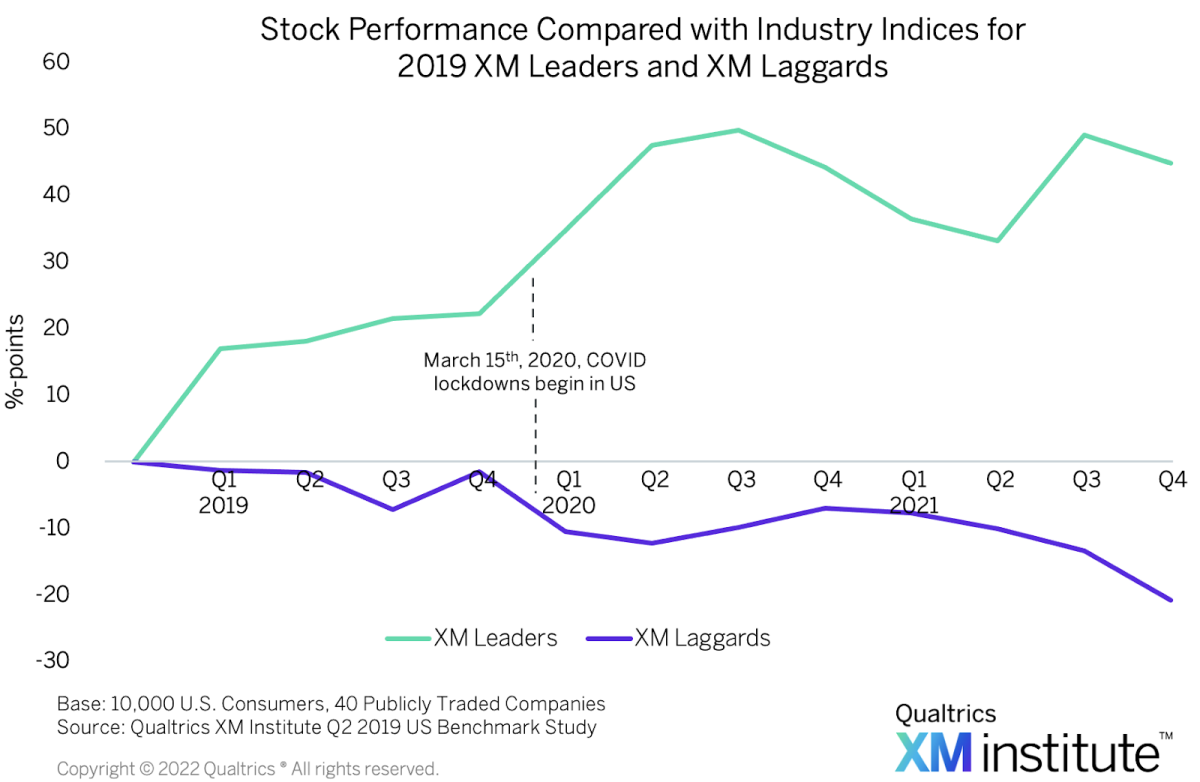
Companies that were XM leaders prior to COVID experienced significantly better stock performance throughout the COVID disruption period. The chart shows that the XM leaders outperformed the laggards prior to COVID (in 2019), but that gap expanded considerably during the COVID period (2020 and 2021). We also see that:
- At the end of 2019, the normalized gap in the stock prices between XM leaders and XM laggards was 24 %-points, but it grew to 66 %-points as companies responded to COVID over the next two years.
- At the end of 2019, the gap between the stock price of XM leaders and their industry index portfolio was 22 %-points, but it grew to 45 %-points by the end of 2021.
- At the end of 2019, the gap between the stock price of XM laggards and their industry index portfolio was -1 %-points, but it grew to -21 %-points by the end of 2021.
- The largest single-quarter growth in the gap between XM leaders’ and XM laggards’ normalized change was 21 points, from a 24 point difference at the end of Q4 2019 to a 45 point difference at the end of Q1 of 2020, when COVID started to impact the U.S.
XM During Times Of Change
How does XM help organizations outperform their peers during times of disruption like COVID? XM provides the foundation for much higher levels of agility, enabling organizations to more effectively sense and respond to changes. When correctly implemented, XM provides the capabilities to:
- Continuously learn. XM enables organizations to discover and interpret signals about how all of the people throughout their ecosystem are thinking and feeling in an ongoing fashion.
- Propagate insights. XM enables organizations to share relevant, actionable insights with people across an organization.
- Rapidly adapt. As the flow of actionable insights increases, XM efforts empower organizations to quickly and meaningfully act on that information.
The Methodology
We identified the 20 publicly traded companies with the highest and the 20 with the lowest XMI Customer Ratings – Overall scores in 2019. The XMI Customer Ratings – Overall is a cross-industry, open-standard benchmark of customer experience across three dimensions: success, effort, and emotion. We calculated these scores from the data gathered in the Qualtrics XM Institute Q2 2019 Consumer Benchmark Survey, an online study of 10,000 U.S. consumers representative of age, income, ethnicity, and geographic region according to the most recent US Census.
We evaluated the normalized business performance for all 40 companies we examined by comparing their stock prices against a representative industry index for each company using the most appropriate S&P 500 or S&P 1500 industry index. We followed the quarter-over-quarter percent growth for the four portfolios: the leaders, the leaders’ industry index, the laggards, and the laggards’ industry index.
To find the normalized change for each quarter, we subtracted the percent change of the industry index portfolios from the percentage change of the company portfolios. For example, if the leader’s portfolio experienced growth of 5% between Q4 of 2019 and Q1 of 2020, while the leader’s Industries index portfolio grew by 1%, then the leaders outperformed their industries by 4 %-points for this quarter.
The bottom line: Experience management builds agility for dealing with times of disruption.