
Getting Started with Surveys
What's on this page
About Survey Projects
Surveys are a key foundation of research. Using a simple survey, we can reach out to others for feedback and gain insights we’d never otherwise come up with ourselves. While Qualtrics has many types of projects expertly tailored to different research disciplines, if you’re ever in doubt of which project to try, you can always start with a survey.
Using a survey project, you can pick from a wide array of question types, customize what the respondents see as they answer questions, and screen respondents who may not fit your research needs. You can distribute your survey, automate it, analyze the data you’ve collected, and create reports, all from right inside one project.
Creating a Survey
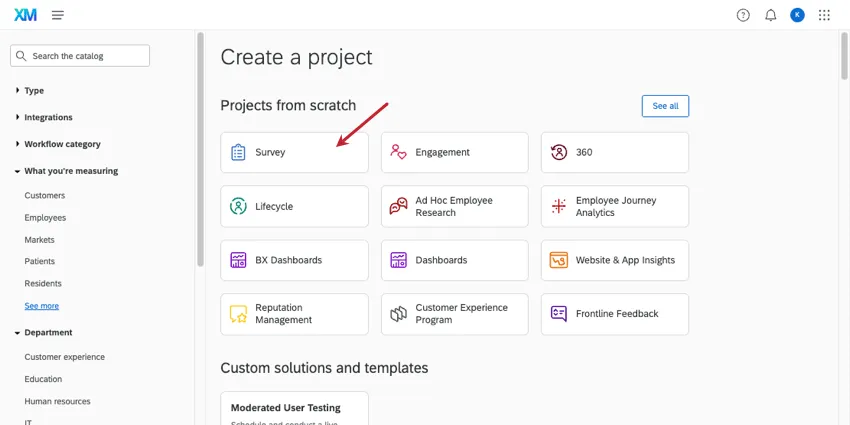
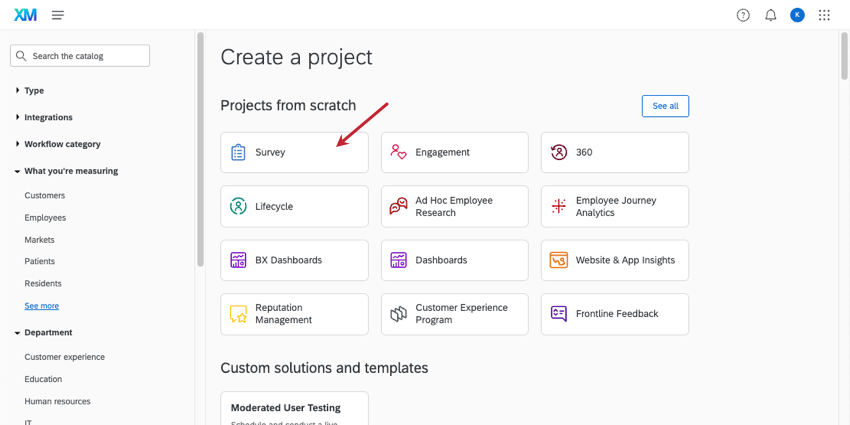
Like any Qualtrics project, surveys can be created in the catalog. You can create a brand new survey, or you can copy your survey from other surveys, a file, or the library.
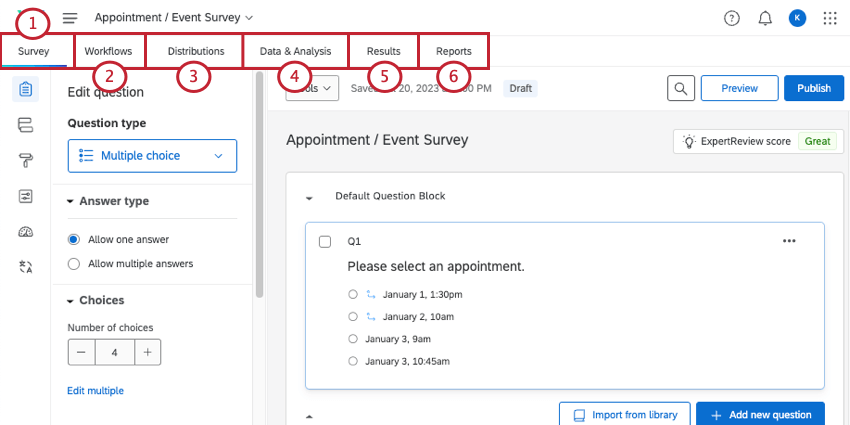
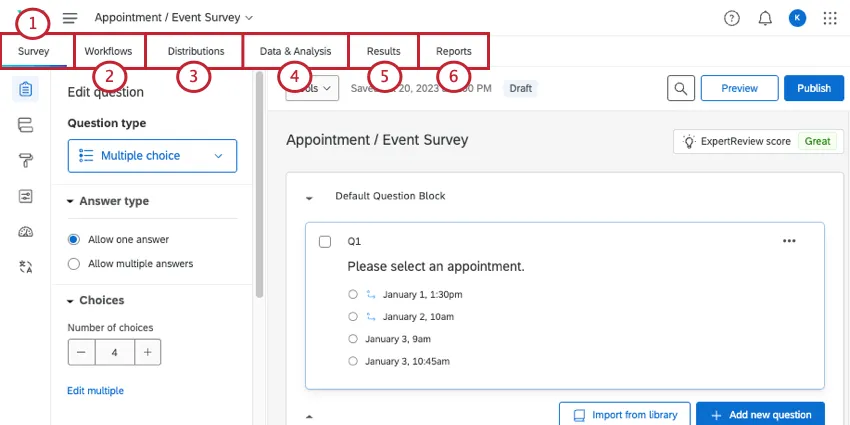
However, making the project is only the first step. Below, we’ll link support pages that take you through the process of creating, distributing, and reporting on your survey.
Qtip: After you’ve previewed your survey edits, don’t forget to publish changes.
Qtip: Depending on the distribution method, you may want to create a contact list first.
FAQs
I don't have the tab described on this page! What do I do?
I don't have the tab described on this page! What do I do?
How can I stay up to date on new Qualtrics features?
How can I stay up to date on new Qualtrics features?
To access these release notes, you need an XM Community account. These accounts are free for any users with a Qualtrics account. This support page contains information for how to register an XM Community account.
Once you're logged into the XM Community, head over to the Weekly Product Updates Introduction Post. This post contains all the information you need to get started with subscribing to product updates!
That's great! Thank you for your feedback!
Thank you for your feedback!