Job searching can be stressful and overwhelming at the best of times, and with hiring rates lagging and unemployment rates slowly inching up, those who are eager to find a job are really feeling the pressure. According to the U.S. Bureau of Labor Statistics (BLS), job searchers spend an average of 23.2 weeks looking for a job, a sizable chunk of time that can significantly impact stability and mental health. Is the job market improving? Fortunately, there are signs that hope may be on the horizon for job seekers. The World Economic Forum describes the job market as becoming more dynamic, with new opportunities emerging through shifts in demographics, priorities, and technologies. While this is on a global scale, there is no doubt that the United States’ job market will also transform, both nationally and on a more local level. So, where in America do people typically search for jobs most often? The team at Qualtrics took a deep dive into the BLS American Time Use Survey (ATUS) to find out:
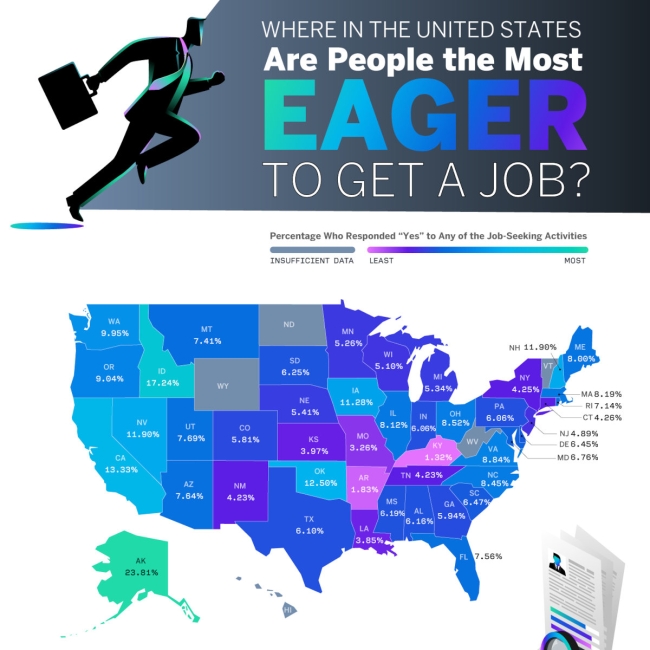
Which state has the most job seekers?
Here are the top 10 states where the most people are seeking a job based on the percentage who responded “yes” to any job-seeking activity questions on the ATUS:
- Alaska job seekers — 23.81%
- Idaho job seekers — 17.24%
- California job seekers — 13.33%
- Oklahoma job seekers — 12.5%
- Nevada job seekers — 11.9%
- New Hampshire job seekers — 11.9%
- Iowa job seekers — 11.28%
- Washington job seekers — 9.95%
- Oregon job seekers — 9.04%
- Virginia job seekers — 8.84%
Is there a job shortage in Alaska? On the contrary, there is actually a workforce shortage in Alaska. The uptick in job searches may be partly due to the growing economy in the Last Frontier. In 2024, 5,400 new jobs were created, and another 5,000 are projected for 2025. Additionally, $20 billion in new infrastructure and resource development projects is expected to generate an extra 20,000 jobs by 2030.
If you live in Alaska and are wondering where to find a new job, here are some specific job-seeking resources to help:
- Finding Work in Alaska — Department of Labor and Workforce Development
- Job Seekers — Department of Labor and Workforce Development
- Explore Careers — Alaska Workforce Alliance
How to find a new job
Applying for jobs is no walk in the park, especially when the average job search stretches for months. Spend your time wisely by choosing the best job search websites. The best job sites depend on the type of employment you seek, so here are some articles to help you find what is best:
- 5 Best Job Search Sites of 2025 — Money
- Best Job Search Sites — US News Money
- 12 Remote Work Websites for Finding Your Dream Job in 2025 — Forbes
- Best Executive Recruiting Firms — Forbes
- Search and Apply for Federal Jobs — USAJOBS
- 10 Job Search Websites and Apps for Retirees in 2025 — US News Money
Job training programs
With so many Americans seeking employment, job training programs and job qualification programs can help give you a competitive edge. Here are some excellent job training programs to consider:
- How to Find Free Job Training — USA.gov — This fantastic resource provides specific guidance for diverse circumstances. It features training programs tailored to individuals with disabilities, veterans, older workers, young adults, and other groups.
- Adult Training Programs — U.S. Department of Labor
- Workforce Innovation and Opportunity Act Programs — U.S. Department of Labor Employment and Training Administration
- 11 of the Best Job Training Programs and Tips for Finding the Right One — Indeed
- Job Corps — Job Corps is a free government program that provides employment and housing opportunities for young, low-income individuals.
The job interview process
Smart hiring starts the engine of success; employee engagement keeps the fuel flowing. Our findings indicate that only 42% of employees feel engaged, which in turn impacts both their well-being and the overall success of the company. Approximately 62% state that their leaders do not listen to feedback, which leads to feelings of exclusion. We spend about one-third of our lives working, so it is important that our professional environments are conducive to a holistic human experience. Securing top talent through the job interview process is only the first step towards building a happy, healthy, and productive workforce. Qualtrics is proud to provide dynamic employee engagement software solutions that are trusted by iconic brands such as Volkswagen, Zillow, Southwest, Kroger, and Goldman Sachs. The consistently high employee satisfaction, customer trust, and innovation rates of these companies speak volumes!
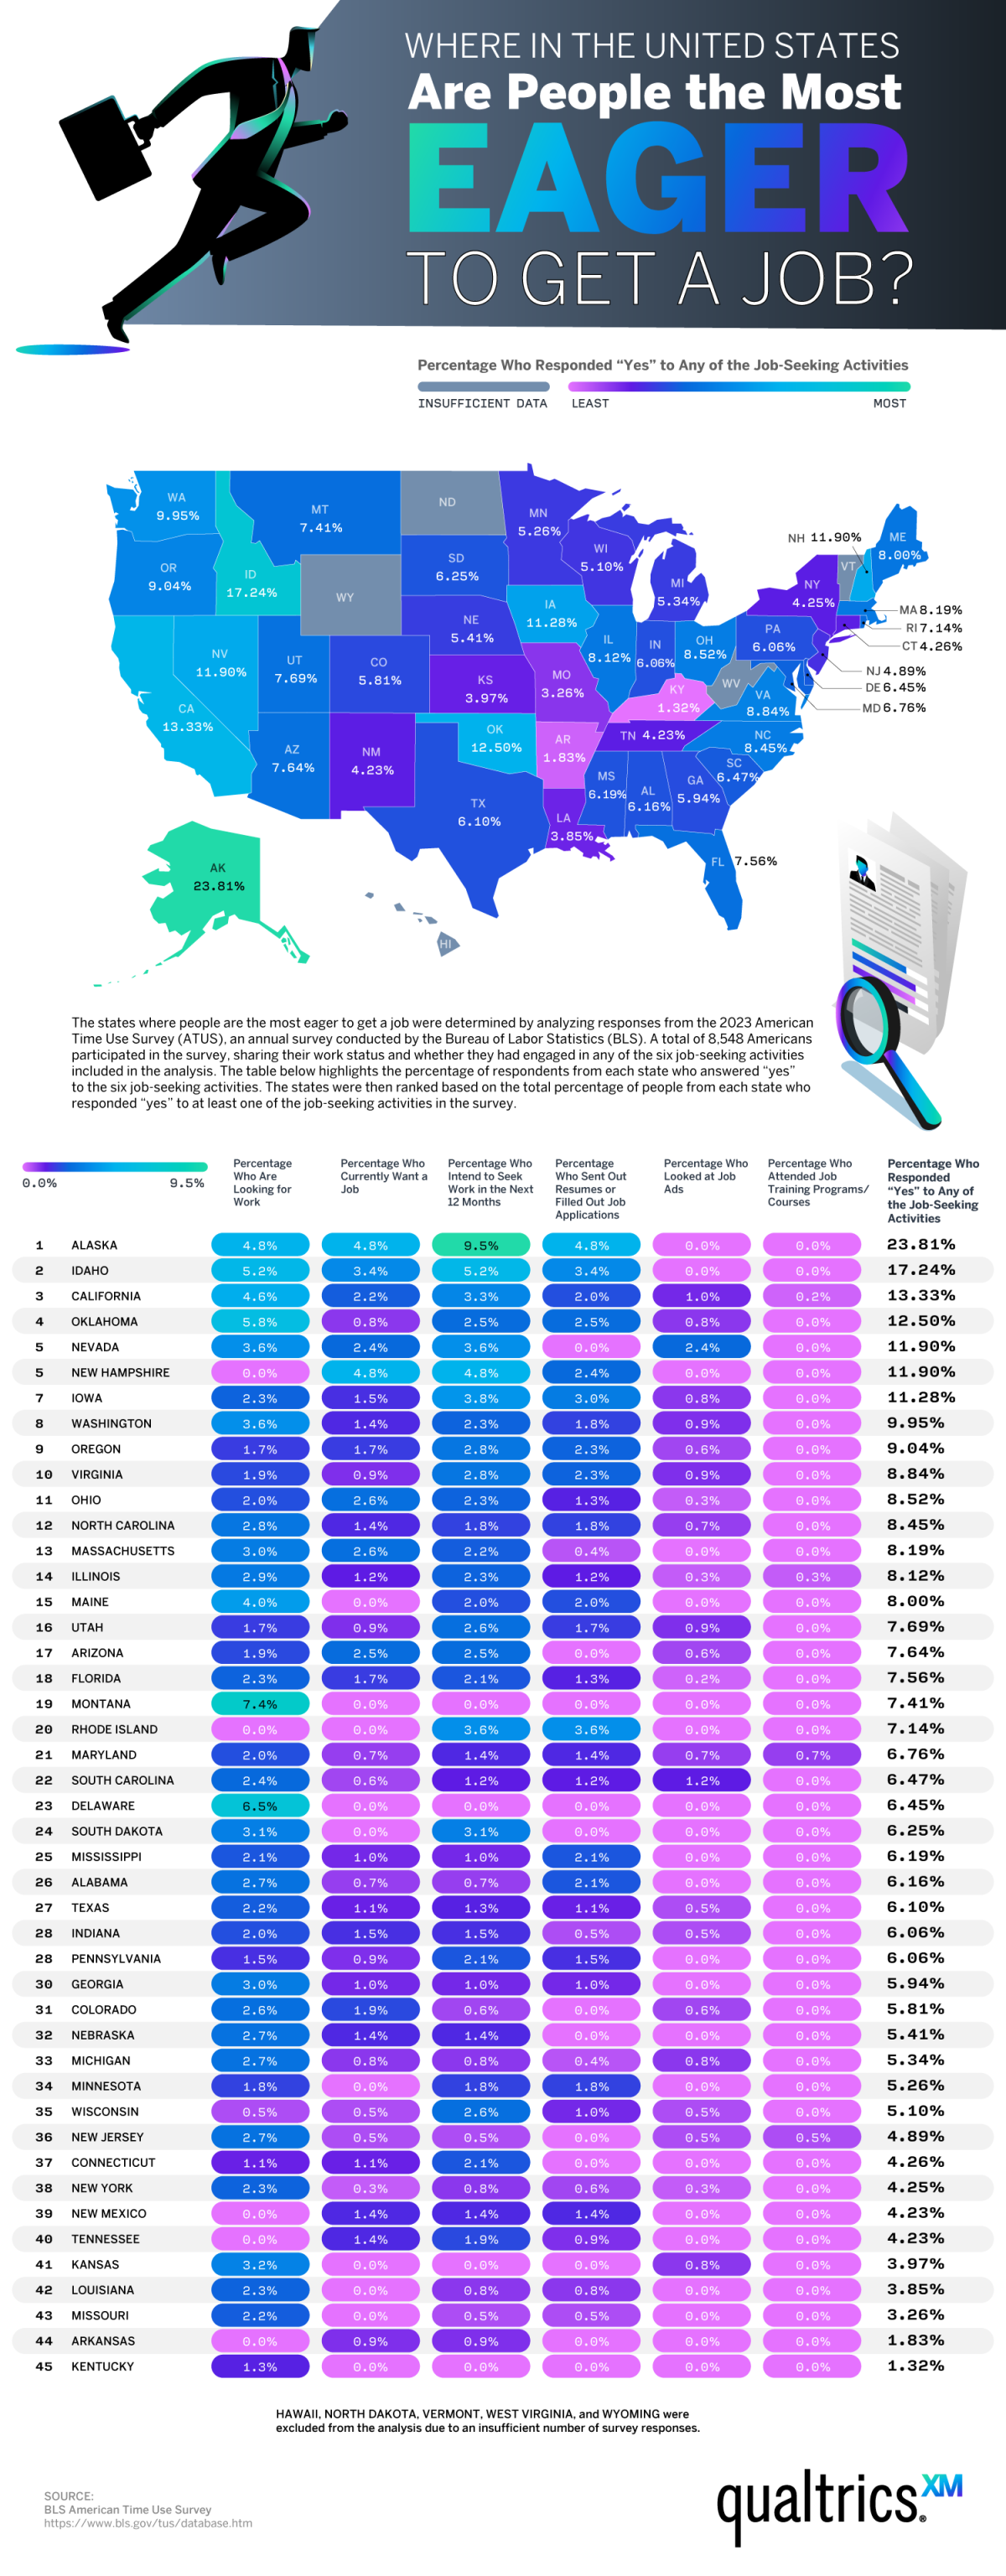
Where in the U.S. Are people the most Eager to find a job?
The states where people are the most eager to get a job were determined by analyzing responses from the 2023 ATUS, an annual survey conducted by the BLS. A total of 8,548 Americans participated in the survey, sharing their work status and whether they had engaged in any of the six job-seeking activities included in the analysis. The table below highlights the percentage of respondents from each state who answered “yes” to the six job-seeking activities. The states were then ranked based on the total percentage of people from each state who responded “yes” to at least one of the job-seeking activities in the survey.
| State | % Who Are Looking for Work | % Who Currently Want a Job | % Who Intend to Seek Work in the Next 12 Months | % Who Sent Out Resumes or Filled Out Job Applications | % Who Looked at Job Ads | % Who Attended Job Training Programs/Courses | % Who Responded “Yes” to Any of the Job-Seeking Activities | |
| 1 | Alaska | 4.8% | 4.8% | 9.5% | 4.8% | 0.0% | 0.0% | 23.81% |
| 2 | Idaho | 5.2% | 3.4% | 5.2% | 3.4% | 0.0% | 0.0% | 17.24% |
| 3 | California | 4.6% | 2.2% | 3.3% | 2.0% | 1.0% | 0.2% | 13.33% |
| 4 | Oklahoma | 5.8% | 0.8% | 2.5% | 2.5% | 0.8% | 0.0% | 12.50% |
| 5 | Nevada | 3.6% | 2.4% | 3.6% | 0.0% | 2.4% | 0.0% | 11.90% |
| 5 | New Hampshire | 0.0% | 4.8% | 4.8% | 2.4% | 0.0% | 0.0% | 11.90% |
| 7 | Iowa | 2.3% | 1.5% | 3.8% | 3.0% | 0.8% | 0.0% | 11.28% |
| 8 | Washington | 3.6% | 1.4% | 2.3% | 1.8% | 0.9% | 0.0% | 9.95% |
| 9 | Oregon | 1.7% | 1.7% | 2.8% | 2.3% | 0.6% | 0.0% | 9.04% |
| 10 | Virginia | 1.9% | 0.9% | 2.8% | 2.3% | 0.9% | 0.0% | 8.84% |
| 11 | Ohio | 2.0% | 2.6% | 2.3% | 1.3% | 0.3% | 0.0% | 8.52% |
| 12 | North Carolina | 2.8% | 1.4% | 1.8% | 1.8% | 0.7% | 0.0% | 8.45% |
| 13 | Massachusetts | 3.0% | 2.6% | 2.2% | 0.4% | 0.0% | 0.0% | 8.19% |
| 14 | Illinois | 2.9% | 1.2% | 2.3% | 1.2% | 0.3% | 0.3% | 8.12% |
| 15 | Maine | 4.0% | 0.0% | 2.0% | 2.0% | 0.0% | 0.0% | 8.00% |
| 16 | Utah | 1.7% | 0.9% | 2.6% | 1.7% | 0.9% | 0.0% | 7.69% |
| 17 | Arizona | 1.9% | 2.5% | 2.5% | 0.0% | 0.6% | 0.0% | 7.64% |
| 18 | Florida | 2.3% | 1.7% | 2.1% | 1.3% | 0.2% | 0.0% | 7.56% |
| 19 | Montana | 7.4% | 0.0% | 0.0% | 0.0% | 0.0% | 0.0% | 7.41% |
| 20 | Rhode Island | 0.0% | 0.0% | 3.6% | 3.6% | 0.0% | 0.0% | 7.14% |
| 21 | Maryland | 2.0% | 0.7% | 1.4% | 1.4% | 0.7% | 0.7% | 6.76% |
| 22 | South Carolina | 2.4% | 0.6% | 1.2% | 1.2% | 1.2% | 0.0% | 6.47% |
| 23 | Delaware | 6.5% | 0.0% | 0.0% | 0.0% | 0.0% | 0.0% | 6.45% |
| 24 | South Dakota | 3.1% | 0.0% | 3.1% | 0.0% | 0.0% | 0.0% | 6.25% |
| 25 | Mississippi | 2.1% | 1.0% | 1.0% | 2.1% | 0.0% | 0.0% | 6.19% |
| 26 | Alabama | 2.7% | 0.7% | 0.7% | 2.1% | 0.0% | 0.0% | 6.16% |
| 27 | Texas | 2.2% | 1.1% | 1.3% | 1.1% | 0.5% | 0.0% | 6.10% |
| 28 | Indiana | 2.0% | 1.5% | 1.5% | 0.5% | 0.5% | 0.0% | 6.06% |
| 28 | Pennsylvania | 1.5% | 0.9% | 2.1% | 1.5% | 0.0% | 0.0% | 6.06% |
| 30 | Georgia | 3.0% | 1.0% | 1.0% | 1.0% | 0.0% | 0.0% | 5.94% |
| 31 | Colorado | 2.6% | 1.9% | 0.6% | 0.0% | 0.6% | 0.0% | 5.81% |
| 32 | Nebraska | 2.7% | 1.4% | 1.4% | 0.0% | 0.0% | 0.0% | 5.41% |
| 33 | Michigan | 2.7% | 0.8% | 0.8% | 0.4% | 0.8% | 0.0% | 5.34% |
| 34 | Minnesota | 1.8% | 0.0% | 1.8% | 1.8% | 0.0% | 0.0% | 5.26% |
| 35 | Wisconsin | 0.5% | 0.5% | 2.6% | 1.0% | 0.5% | 0.0% | 5.10% |
| 36 | New Jersey | 2.7% | 0.5% | 0.5% | 0.0% | 0.5% | 0.5% | 4.89% |
| 37 | Connecticut | 1.1% | 1.1% | 2.1% | 0.0% | 0.0% | 0.0% | 4.26% |
| 38 | New York | 2.3% | 0.3% | 0.8% | 0.6% | 0.3% | 0.0% | 4.25% |
| 39 | New Mexico | 0.0% | 1.4% | 1.4% | 1.4% | 0.0% | 0.0% | 4.23% |
| 40 | Tennessee | 0.0% | 1.4% | 1.9% | 0.9% | 0.0% | 0.0% | 4.23% |
| 41 | Kansas | 3.2% | 0.0% | 0.0% | 0.0% | 0.8% | 0.0% | 3.97% |
| 42 | Louisiana | 2.3% | 0.0% | 0.8% | 0.8% | 0.0% | 0.0% | 3.85% |
| 43 | Missouri | 2.2% | 0.0% | 0.5% | 0.5% | 0.0% | 0.0% | 3.26% |
| 44 | Arkansas | 0.0% | 0.9% | 0.9% | 0.0% | 0.0% | 0.0% | 1.83% |
| 45 | Kentucky | 1.3% | 0.0% | 0.0% | 0.0% | 0.0% | 0.0% | 1.32% |
Hawaii, North Dakota, Vermont, West Virginia, and Wyoming were excluded from the analysis due to an insufficient number of survey responses.
Source