There are many factors that can help us understand how a country’s economy and labor market are performing, such as gross domestic product (GDP), inflation, and consumer spending. However, the unemployment rate is one of the most important.
This economic indicator gives insight into how many people who want to work aren’t. The rate tends to increase during and after a recession and decrease when the economy expands. So, it’s no surprise that the unemployment rate varies widely by country.
Using data from the CIA’s World Factbook and elsewhere, our team at Qualtrics tracked down the unemployment rates around the world.
What is the unemployment rate?
Let’s start with the definition of unemployment rate: the number of unemployed people as a percentage of the labor force, according to the U.S. Bureau of Labor Statistics (BLS), which reports the unemployment rate every month. In this case, the labor force is the sum of the employed and unemployed.
The rate is calculated as: (Unemployed ÷ Labor Force) x 100.
The BLS surveys roughly 60,000 eligible households — 110,000 individuals — each month to determine the unemployment rate. It’s important to note that “unemployed people” doesn’t just include people who don’t have a job. To be considered unemployed for the purpose of calculating the rate, you must have been unemployed during the survey but available for work (except for a temporary illness), and either be temporarily laid off or have made an active effort during the four weeks before the survey to find a job.
In short, people with jobs are “employed,” and people who are jobless but available and looking for work are “unemployed.” The distinction is that people who can’t or choose not to work (like retirees) aren’t included in the calculation.
Which country has the highest unemployment rate in the world?
Eswatini has the highest unemployment rate in the world at 37.64%. This South African landlocked country was known as Swaziland until 2018 when it was renamed, and is one of the world’s last remaining absolute monarchies.
Other countries with high unemployment rates include South Africa, Botswana, and the Republic of the Congo.
Which country has the lowest unemployment rate in the world?
Qatar (officially called the State of Qatar) has the lowest unemployment rate in the world at 0.13%. Petroleum and natural gas are major industries and employers in this Middle Eastern country.
Other countries with low unemployment rates include Cambodia, Niger, and Thailand.
What is the unemployment rate in the United States?
As of March 2025, the unemployment rate in the U.S. is 4.2%.
Why does the unemployment rate change?
According to the Economic Policy Institute, several factors can impact the unemployment rate, but the most evident one is a change in the size of the actual labor force, which includes how many people are looking for jobs. If the economy is performing poorly and people are having trouble finding work, they may throw in the towel, decreasing the workforce.
The unemployment rate tends to increase during times of economic hardship. For example, the International Monetary Fund reports that global unemployment reached the highest level on record during the peak of the 2009 global financial crisis: 7% of the global workforce — more than 200 million people — were on the hunt for a job.
On the other hand, the unemployment rate often decreases when the economy is recovering or growing even more.
Businesses can increase employee retention and employee satisfaction with help from Qualtrics using our advanced HR surveys and other solutions to improve employee experience at every level.
Unemployment rate chart
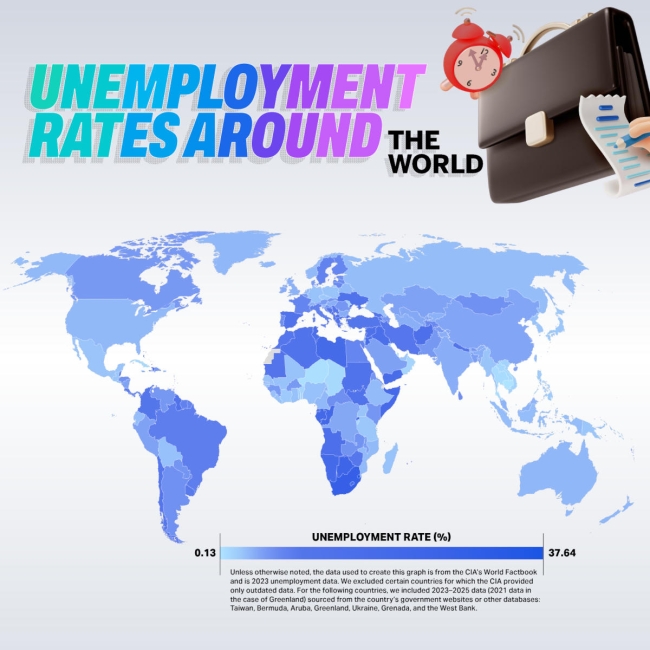
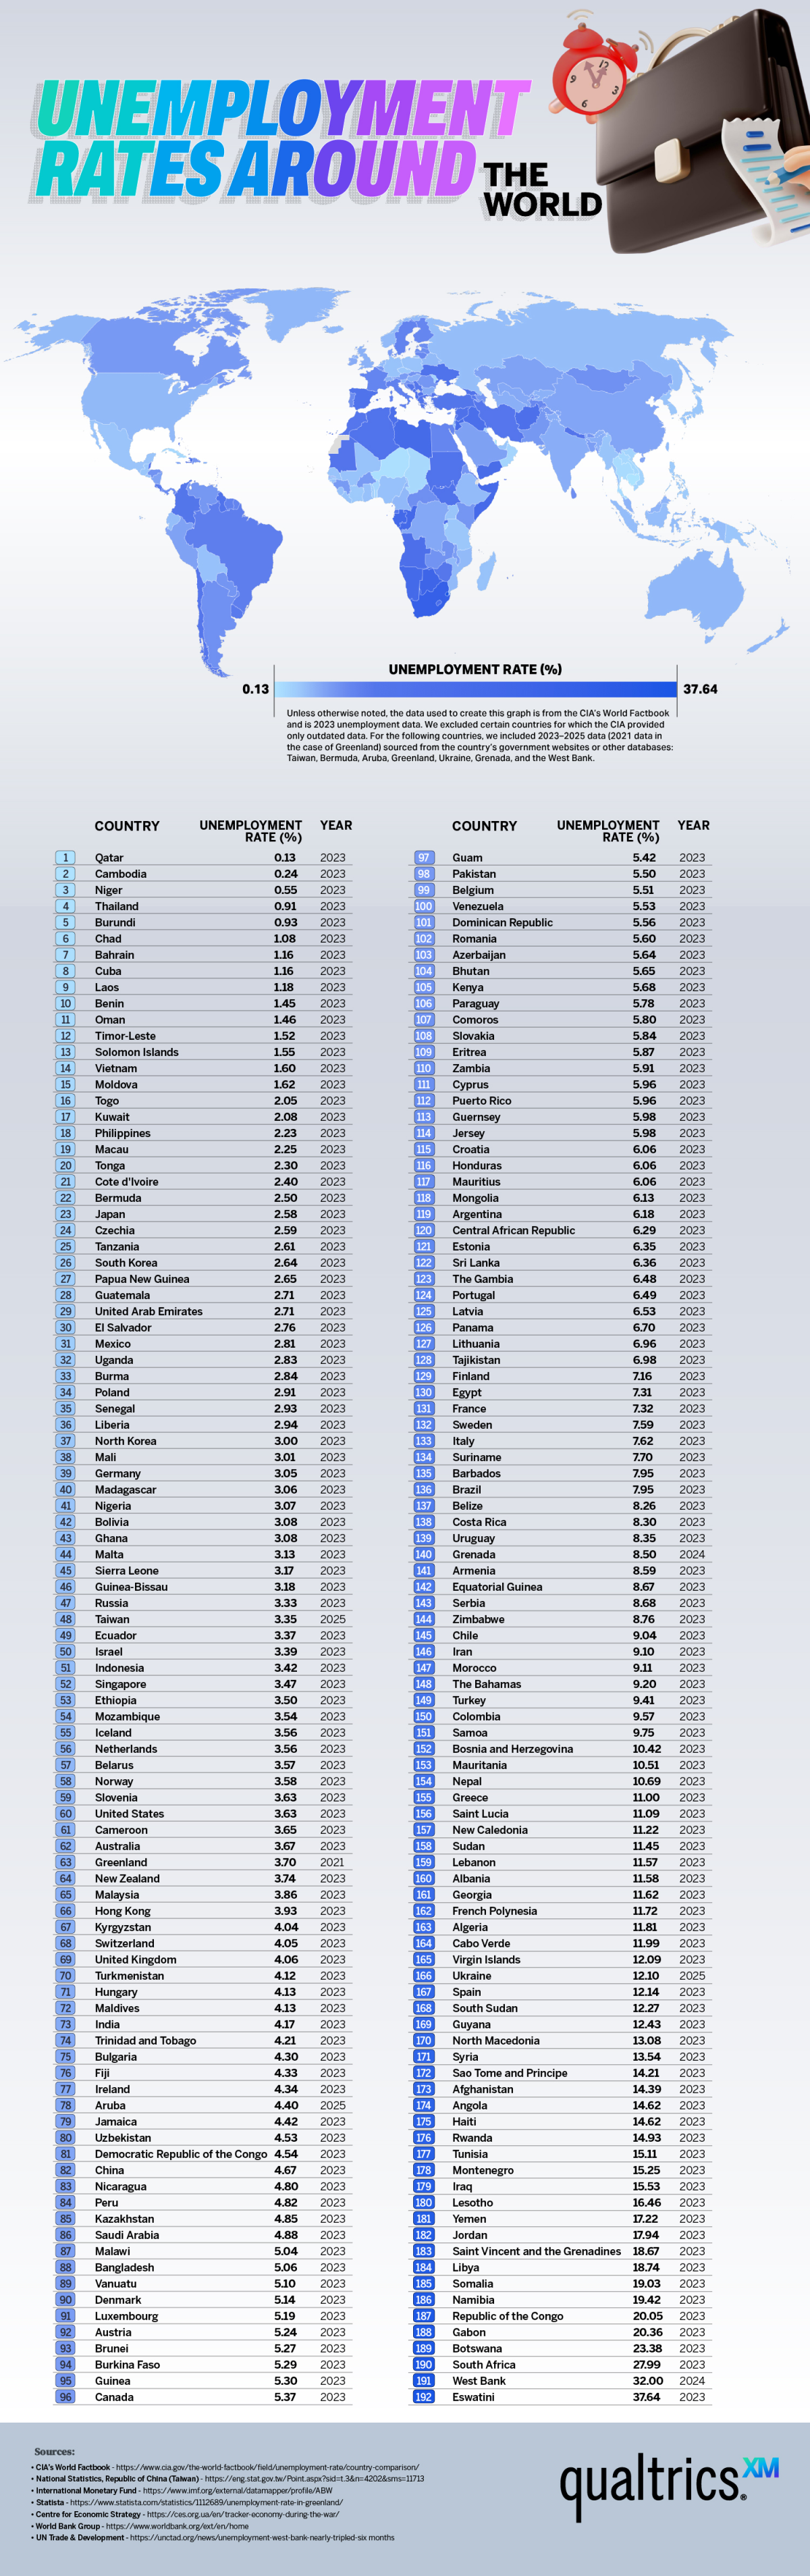
Below is a chart of unemployment rates by country, covering locations from Cambodia to Morocco to Belgium. Unless otherwise noted, the data used to create this graph is from the CIA’s World Factbook and is 2023 unemployment data. We excluded certain countries for which the CIA provided only outdated data. For the following countries, we included 2023–2025 data (2021 data in the case of Greenland) sourced from the country’s government websites or other databases: Taiwan, Bermuda, Aruba, Greenland, Ukraine, Grenada, and the West Bank. Those sources included National Statistics, Republic of China (Taiwan), Government of Bermuda’s May 2023 Labour Force Survey Report, International Monetary Fund, Statista, Centre for Economic Strategy, World Bank Group, and UN Trade & Development.
| Country | Unemployment Rate (%) | Year |
| Qatar | 0.13 | 2023 |
| Cambodia | 0.24 | 2023 |
| Niger | 0.55 | 2023 |
| Thailand | 0.91 | 2023 |
| Burundi | 0.93 | 2023 |
| Chad | 1.08 | 2023 |
| Bahrain | 1.16 | 2023 |
| Cuba | 1.16 | 2023 |
| Laos | 1.18 | 2023 |
| Benin | 1.45 | 2023 |
| Oman | 1.46 | 2023 |
| Timor-Leste | 1.52 | 2023 |
| Solomon Islands | 1.55 | 2023 |
| Vietnam | 1.60 | 2023 |
| Moldova | 1.62 | 2023 |
| Togo | 2.05 | 2023 |
| Kuwait | 2.08 | 2023 |
| Philippines | 2.23 | 2023 |
| Macau | 2.25 | 2023 |
| Tonga | 2.30 | 2023 |
| Cote d'Ivoire | 2.40 | 2023 |
| Bermuda | 2.50 | 2023 |
| Japan | 2.58 | 2023 |
| Czechia | 2.59 | 2023 |
| Tanzania | 2.61 | 2023 |
| South Korea | 2.64 | 2023 |
| Papua New Guinea | 2.65 | 2023 |
| Guatemala | 2.71 | 2023 |
| United Arab Emirates | 2.71 | 2023 |
| El Salvador | 2.76 | 2023 |
| Mexico | 2.81 | 2023 |
| Uganda | 2.83 | 2023 |
| Burma | 2.84 | 2023 |
| Poland | 2.91 | 2023 |
| Senegal | 2.93 | 2023 |
| Liberia | 2.94 | 2023 |
| North Korea | 3.00 | 2023 |
| Mali | 3.01 | 2023 |
| Germany | 3.05 | 2023 |
| Madagascar | 3.06 | 2023 |
| Nigeria | 3.07 | 2023 |
| Bolivia | 3.08 | 2023 |
| Ghana | 3.08 | 2023 |
| Malta | 3.13 | 2023 |
| Sierra Leone | 3.17 | 2023 |
| Guinea-Bissau | 3.18 | 2023 |
| Russia | 3.33 | 2023 |
| Taiwan | 3.35 | 2025 |
| Ecuador | 3.37 | 2023 |
| Israel | 3.39 | 2023 |
| Indonesia | 3.42 | 2023 |
| Singapore | 3.47 | 2023 |
| Ethiopia | 3.50 | 2023 |
| Mozambique | 3.54 | 2023 |
| Iceland | 3.56 | 2023 |
| Netherlands | 3.56 | 2023 |
| Belarus | 3.57 | 2023 |
| Norway | 3.58 | 2023 |
| Slovenia | 3.63 | 2023 |
| United States | 3.63 | 2023 |
| Cameroon | 3.65 | 2023 |
| Australia | 3.67 | 2023 |
| Greenland | 3.70 | 2021 |
| New Zealand | 3.74 | 2023 |
| Malaysia | 3.86 | 2023 |
| Hong Kong | 3.93 | 2023 |
| Kyrgyzstan | 4.04 | 2023 |
| Switzerland | 4.05 | 2023 |
| United Kingdom | 4.06 | 2023 |
| Turkmenistan | 4.12 | 2023 |
| Hungary | 4.13 | 2023 |
| Maldives | 4.13 | 2023 |
| India | 4.17 | 2023 |
| Trinidad and Tobago | 4.21 | 2023 |
| Bulgaria | 4.30 | 2023 |
| Fiji | 4.33 | 2023 |
| Ireland | 4.34 | 2023 |
| Aruba | 4.40 | 2025 |
| Jamaica | 4.42 | 2023 |
| Uzbekistan | 4.53 | 2023 |
| Democratic Republic of the Congo | 4.54 | 2023 |
| China | 4.67 | 2023 |
| Nicaragua | 4.80 | 2023 |
| Peru | 4.82 | 2023 |
| Kazakhstan | 4.85 | 2023 |
| Saudi Arabia | 4.88 | 2023 |
| Malawi | 5.04 | 2023 |
| Bangladesh | 5.06 | 2023 |
| Vanuatu | 5.10 | 2023 |
| Denmark | 5.14 | 2023 |
| Luxembourg | 5.19 | 2023 |
| Austria | 5.24 | 2023 |
| Brunei | 5.27 | 2023 |
| Burkina Faso | 5.29 | 2023 |
| Guinea | 5.30 | 2023 |
| Canada | 5.37 | 2023 |
| Guam | 5.42 | 2023 |
| Pakistan | 5.50 | 2023 |
| Belgium | 5.51 | 2023 |
| Venezuela | 5.53 | 2023 |
| Dominican Republic | 5.56 | 2023 |
| Romania | 5.60 | 2023 |
| Azerbaijan | 5.64 | 2023 |
| Bhutan | 5.65 | 2023 |
| Kenya | 5.68 | 2023 |
| Paraguay | 5.78 | 2023 |
| Comoros | 5.80 | 2023 |
| Slovakia | 5.84 | 2023 |
| Eritrea | 5.87 | 2023 |
| Zambia | 5.91 | 2023 |
| Cyprus | 5.96 | 2023 |
| Puerto Rico | 5.96 | 2023 |
| Guernsey | 5.98 | 2023 |
| Jersey | 5.98 | 2023 |
| Croatia | 6.06 | 2023 |
| Honduras | 6.06 | 2023 |
| Mauritius | 6.06 | 2023 |
| Mongolia | 6.13 | 2023 |
| Argentina | 6.18 | 2023 |
| Central African Republic | 6.29 | 2023 |
| Estonia | 6.35 | 2023 |
| Sri Lanka | 6.36 | 2023 |
| The Gambia | 6.48 | 2023 |
| Portugal | 6.49 | 2023 |
| Latvia | 6.53 | 2023 |
| Panama | 6.70 | 2023 |
| Lithuania | 6.96 | 2023 |
| Tajikistan | 6.98 | 2023 |
| Finland | 7.16 | 2023 |
| Egypt | 7.31 | 2023 |
| France | 7.32 | 2023 |
| Sweden | 7.59 | 2023 |
| Italy | 7.62 | 2023 |
| Suriname | 7.70 | 2023 |
| Brazil | 7.95 | 2023 |
| Barbados | 7.95 | 2023 |
| Belize | 8.26 | 2023 |
| Costa Rica | 8.30 | 2023 |
| Uruguay | 8.35 | 2023 |
| Grenada | 8.50 | 2024 |
| Armenia | 8.59 | 2023 |
| Equatorial Guinea | 8.67 | 2023 |
| Serbia | 8.68 | 2023 |
| Zimbabwe | 8.76 | 2023 |
| Chile | 9.04 | 2023 |
| Iran | 9.10 | 2023 |
| Morocco | 9.11 | 2023 |
| The Bahamas | 9.20 | 2023 |
| Turkey | 9.41 | 2023 |
| Colombia | 9.57 | 2023 |
| Samoa | 9.75 | 2023 |
| Bosnia and Herzegovina | 10.42 | 2023 |
| Mauritania | 10.51 | 2023 |
| Nepal | 10.69 | 2023 |
| Greece | 11.00 | 2023 |
| Saint Lucia | 11.09 | 2023 |
| New Caledonia | 11.22 | 2023 |
| Sudan | 11.45 | 2023 |
| Lebanon | 11.57 | 2023 |
| Albania | 11.58 | 2023 |
| Georgia | 11.62 | 2023 |
| French Polynesia | 11.72 | 2023 |
| Algeria | 11.81 | 2023 |
| Cabo Verde | 11.99 | 2023 |
| Virgin Islands | 12.09 | 2023 |
| Ukraine | 12.10 | 2025 |
| Spain | 12.14 | 2023 |
| South Sudan | 12.27 | 2023 |
| Guyana | 12.43 | 2023 |
| North Macedonia | 13.08 | 2023 |
| Syria | 13.54 | 2023 |
| Sao Tome and Principe | 14.21 | 2023 |
| Afghanistan | 14.39 | 2023 |
| Angola | 14.62 | 2023 |
| Haiti | 14.62 | 2023 |
| Rwanda | 14.93 | 2023 |
| Tunisia | 15.11 | 2023 |
| Montenegro | 15.25 | 2023 |
| Iraq | 15.53 | 2023 |
| Lesotho | 16.46 | 2023 |
| Yemen | 17.22 | 2023 |
| Jordan | 17.94 | 2023 |
| Saint Vincent and the Grenadines | 18.67 | 2023 |
| Libya | 18.74 | 2023 |
| Somalia | 19.03 | 2023 |
| Namibia | 19.42 | 2023 |
| Republic of the Congo | 20.05 | 2023 |
| Gabon | 20.36 | 2023 |
| Botswana | 23.38 | 2023 |
| South Africa | 27.99 | 2023 |
| West Bank | 32.00 | 2024 |
| Eswatini | 37.64 | 2023 |
Don’t miss our other content on the state of the workforce, including three biggest challenges in shaping the government sector and four trends shaping the healthcare industry in 2025.