Qualtrics Announces Second Quarter 2022 Financial Results
Last updated: July 20, 2022
- Q2 2022 total revenue of $356.4M, up 43% year over year
- Q2 2022 subscription revenue of $300.6M, up 47% year over year
- Total remaining performance obligations[1] of $1,798.0M, up 39% year over year
- Next 12 months remaining performance obligations of $1,038.3M, up 38% year over year
PROVO, Utah and SEATTLE July 20, 2022– Qualtrics (NASDAQ: XM), the leader and creator of the experience management (XM) category, today announced financial results for the second quarter ended June 30, 2022.
“Q2 was a strong quarter of revenue growth for Qualtrics, and we are proud to deliver another quarter of positive non-GAAP operating margin as we drive toward long-term, durable growth,” said Qualtrics CEO Zig Serafin. “We continue to see robust demand for our experience management platform as companies look to Qualtrics to help them navigate the uncertain macro-environment and win in their markets.”
Second Quarter 2022 Financial Highlights:
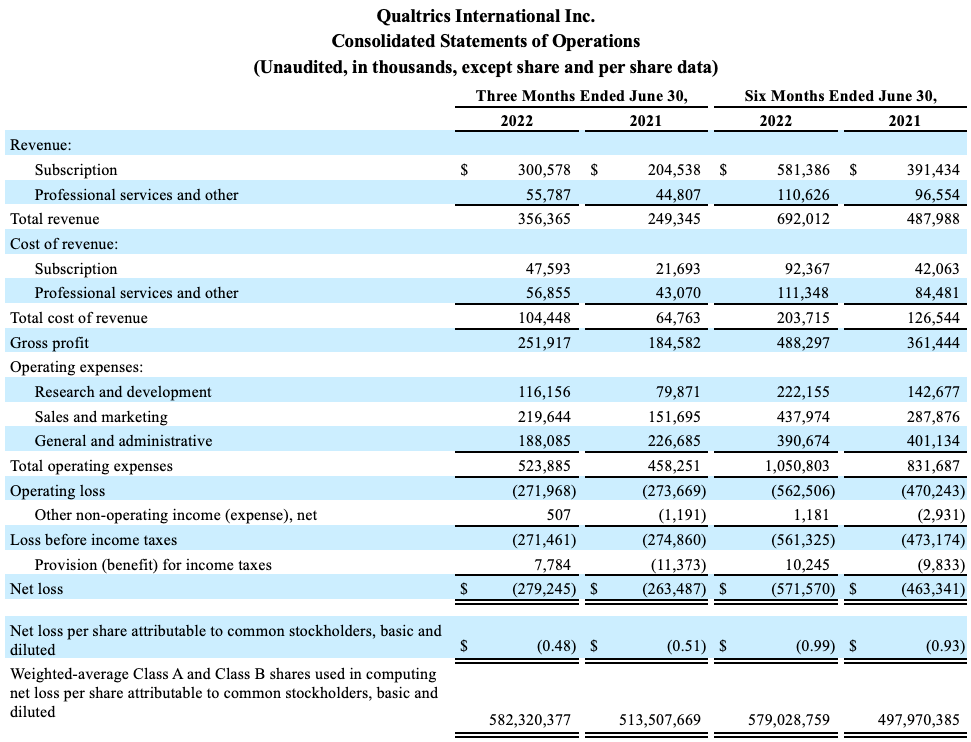
- Revenue: Total revenue for the second quarter was $356.4 million, up from $249.3 million one year ago, an increase of 43% year over year. Subscription revenue for the second quarter was $300.6 million, up from $204.5 million one year ago, an increase of 47% year over year.
- Operating Income (Loss) and Margin: Second quarter operating loss was $(272.0) million, compared to $(273.7) million one year ago. Non-GAAP operating income for the second quarter (see discussion of non-GAAP operating income and margin measures below) was $7.2 million, compared to non-GAAP operating income of $11.5 million one year ago. For the second quarter, GAAP operating margin was (76)% and non-GAAP operating margin was 2%, compared to GAAP operating margin of (110)% and non-GAAP operating margin of 5% one year ago.
- Net Income (Loss) and Net Income (Loss) Per Share: Second quarter net loss was $(279.2) million, or $(0.48) per share, compared to $(263.5) million, or $(0.51) per share in the second quarter of fiscal year 2021. Non-GAAP net loss (see discussion of the non-GAAP net income (loss) measure below) for the second quarter was $(20.9) million, or $(0.04) per share, compared to non-GAAP net income of $22.3 million, or $0.04 per share in the second quarter of fiscal year 2021.
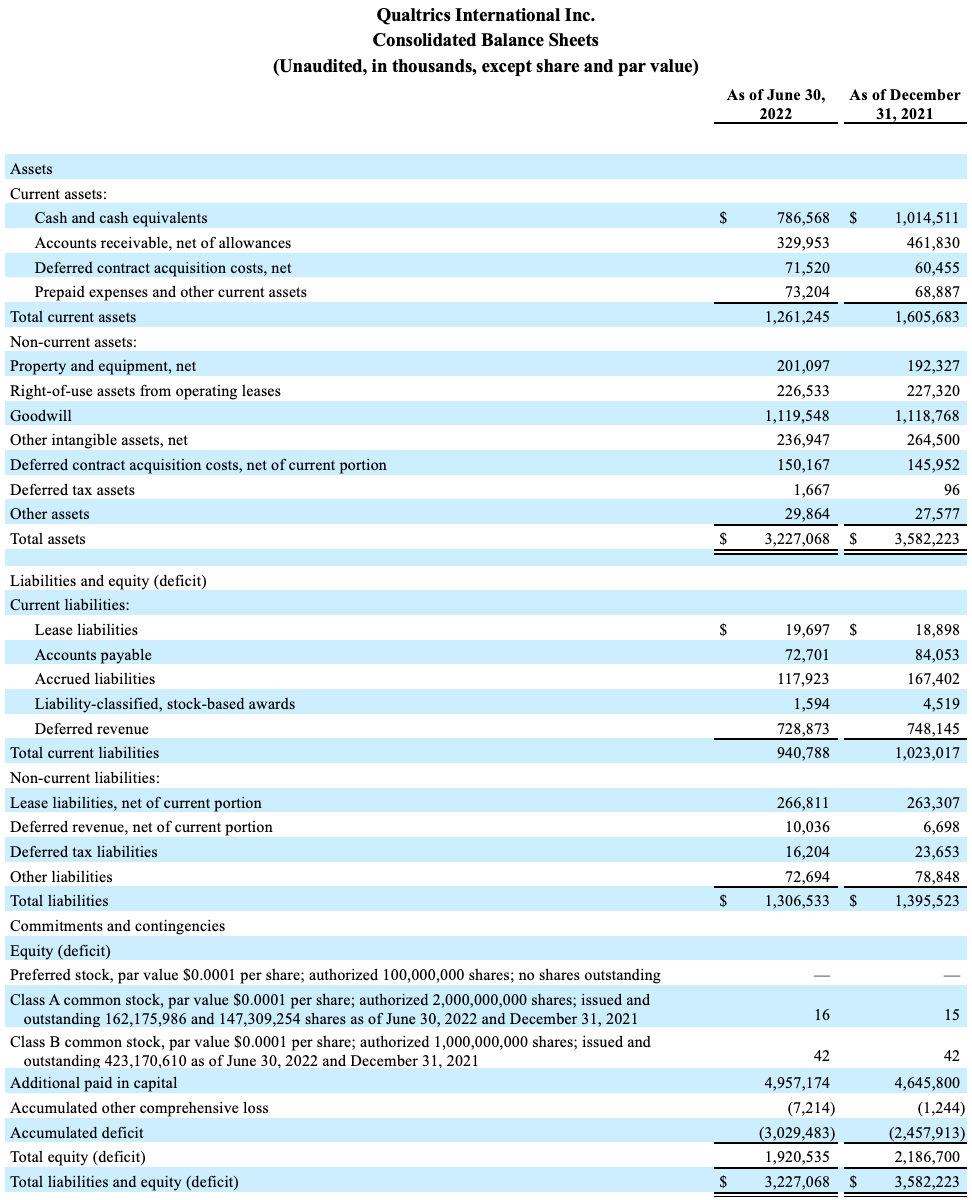
- Cash and Cash Equivalents: Total cash and cash equivalents as of June 30, 2022 was $786.6 million.
Financial Outlook:
Qualtrics is providing guidance for its third quarter ending September 30, 2022 as follows:
- Total revenue between $358 and $360 million.
- Subscription revenue between $303 and $305 million.
- Non-GAAP operating margin between 1.5% and 2.5%.
- Non-GAAP net loss per share between $(0.02) and $(0.04) assuming 595 million weighted shares outstanding.
Qualtrics is updating its guidance for its full year ending December 31, 2022 as follows:
- Total revenue between $1,422 and $1,426 million.
- Subscription revenue between $1,202 and $1,206 million.
- Non-GAAP operating margin between 1.5% and 3%.
- Non-GAAP net loss per share between $(0.07) and $(0.09) assuming 600 million weighted shares outstanding.
The guidance provided above constitutes forward-looking statements and actual results may differ materially. Refer to the “Forward-Looking Statements” safe harbor section below for information on the factors that could cause our actual results to differ materially from these forward-looking statements.
Non-GAAP operating income, non-GAAP operating margin, non-GAAP net income (loss), and non-GAAP net income (loss) per share are non-GAAP financial measures. Additional information on Qualtrics’ reported results, including a reconciliation of the non-GAAP financial measures to their most comparable GAAP measures, is included in the financial tables below. A reconciliation of non-GAAP guidance measures to corresponding GAAP measures is not available on a forward-looking basis without unreasonable effort due to the uncertainty of expenses that may be incurred in the future, although it is important to note that these factors could be material to Qualtrics’ results computed in accordance with GAAP.
A supplemental financial presentation and other information can be accessed through Qualtrics’ investor relations website at https://www.qualtrics.com/investors/.
Qualtrics Earnings Call
Qualtrics plans to host a conference call today to review its fiscal second quarter 2022 financial results and to discuss its financial outlook. The call is scheduled to begin at 3:00 p.m. MT/5:00 p.m. ET. Investors are invited to join the webcast by visiting: https://qualtrics.com/investors/events. The webcast will be available live, and a replay will be available following completion of the live broadcast for approximately 90 days.
About Qualtrics
Qualtrics, the leader and creator of the experience management (XM) category, is changing the way organizations manage and improve the four core experiences of business, customer, employee, product and brand. Over 16,750 organizations around the world use Qualtrics to listen, understand, and take action on experience data (X-data™)—the beliefs, emotions and intentions that tell you why things are happening, and what to do about it. The Qualtrics XM Platform™ is a system of action that helps businesses attract customers who stay longer and buy more, engage employees who build a positive culture, develop breakthrough products people love and build a brand people are passionate about.
Forward-Looking Statements
This press release contains express and implied “forward-looking statements” within the meaning of the Private Securities Litigation Reform Act of 1995, including statements regarding our financial outlook for the third quarter of 2022 and full year 2022. In some cases, you can identify forward-looking statements by terms such as “anticipate,” “believe,” “estimate,” “expect,” “intend,” “may,” “might,” “plan,” “project,” “will,” “would,” “should,” “could,” “can,” “predict,” “potential,” “target,” “explore,” “continue,” or the negative of these terms, and similar expressions intended to identify forward-looking statements. By their nature, these statements are subject to numerous uncertainties and risks, including factors beyond our control, that could cause actual results, performance, or achievement to differ materially and adversely from those anticipated or implied in the statements, including: our future financial performance, including our revenue, cost of revenue, gross profit, operating expenses, ability to generate positive cash flow, and ability to be profitable; our ability to grow at or near historical growth rates; anticipated technology trends, such as the use of and demand for experience management software; our ability to attract and retain customers to use our products; our ability to attract enterprises and international organizations as customers for our products; our ability to expand our network with content consulting partners, delivery partners, and technology partners; the evolution of technology affecting our products and markets; our ability to introduce new products and enhance existing products and to compete effectively with competitors; our ability to successfully enter into new markets and manage our international expansion; the attraction and retention of qualified employees and key personnel; our ability to effectively manage our growth and future expenses and maintain our corporate culture; our anticipated investments in sales and marketing and research and development; our ability to maintain, protect, and enhance our intellectual property rights; our ability to successfully defend litigation brought against us; our ability to maintain data privacy and data security; the sufficiency of our cash and cash equivalents to meet our liquidity needs; our ability to comply with modified or new laws and regulations applying to our business; the impact of geopolitical events, including the ongoing conflict between Russia and Ukraine; our ability to respond to and overcome challenges brought by the COVID-19 pandemic; our reduced ability to leverage resources at SAP as an independent company from SAP; and the increased expenses associated with being an independent public company. Additional risks and uncertainties that could cause actual outcomes and results to differ materially from those contemplated by the forward-looking statements are and/or will be included under the caption “Risk Factors” and elsewhere in Qualtrics’ Annual Report on Form 10-K and Quarterly Reports on Form 10-Q filed with the Securities and Exchange Commission and any subsequent public filings. Forward-looking statements speak only as of the date the statements are made and are based on information available to Qualtrics at the time those statements are made and/or management’s good faith belief as of that time with respect to future events. Qualtrics assumes no obligation to update forward-looking statements to reflect events or circumstances after the date they were made, except as required by law.
Non-GAAP Financial Measures
To supplement our financial results, which are prepared and presented in accordance with GAAP, we use certain non-GAAP financial measures, as described below, to understand and evaluate our core operating performance. These non-GAAP financial measures, which may be different than similarly-titled measures used by other companies, are presented to enhance investors’ overall understanding of our financial performance and should not be considered a substitute for, or superior to, the financial information prepared and presented in accordance with GAAP.
We believe that these non-GAAP financial measures provide useful information about our financial performance, enhance the overall understanding of our past performance and future prospects, and allow for greater transparency with respect to important metrics used by our management for financial and operational decision-making. We are presenting these non-GAAP measures to assist investors in seeing our financial performance using a management view, and because we believe that these measures provide an additional tool for investors to use in comparing our core financial performance over multiple periods with other companies in our industry. You should consider non-GAAP results alongside other financial performance measures and results presented in accordance with GAAP. In addition, in evaluating non-GAAP results, you should be aware that in the future we will incur expenses such as those that are the subject of adjustments in deriving non-GAAP results and you should not infer from our non-GAAP results that our future results will not be affected by these expenses or any unusual or non-recurring items.
Non-GAAP gross profit, non-GAAP gross margin, non-GAAP operating income, non-GAAP operating margin, non-GAAP net income (loss), non-GAAP net income (loss) per share, free cash flow, free cash flow margin: We define these non-GAAP financial measures as the respective GAAP measures, excluding equity and cash settled stock-based compensation expenses, including employer payroll tax on employee stock transactions, amortization of acquired intangible assets, acquisition related costs, changes in the fair value of our distribution liability for our tax sharing agreement with SAP, and the tax impact of the non-GAAP adjustments, as applicable.
We revised our non-GAAP definitions during 2022 to exclude employer payroll taxes on employee stock transactions. The amount of employer payroll tax on employee stock transactions is dependent on our stock price and other factors that are beyond our control and do not correlate with the core operation of our business. Going forward, we expect these expenses to increase relative to prior periods as a result of the vesting of restricted stock units (RSUs), and we believe it is useful to exclude these expenses in order to help investors better understand the long-term performance of our core business.The revisions to these definitions had no material impact on our reported non-GAAP financial measures for periods prior to 2022.
When evaluating the performance of our business and making operating plans, we do not consider the items excluded from our non-GAAP definitions (for example, when considering the impact of equity award grants, we place a greater emphasis on overall stockholder dilution rather than the accounting charges associated with such grants). We believe it is useful to exclude these items in order to better understand the long-term performance of our core business and to facilitate comparison of our results to those of peer companies and over multiple periods.
Investor Relations:
Steven Wu
Head of FP&A and Investor Relations
investors@qualtrics.com
Public Relations:
Gina Sheibley
Chief Communications Officer
press@qualtrics.com
[1] Remaining performance obligations represent all contracted future revenue that has not yet been recognized, including both deferred revenue and non-cancelable contracted amounts that will be invoiced and recognized as revenue in future periods.
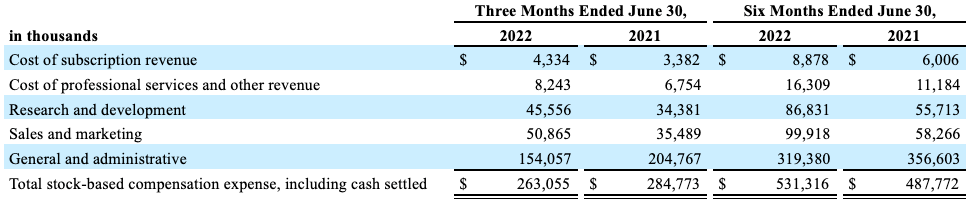
Cost of revenue and operating expenses includes:
Stock-based compensation expense(a) as follows:
________________
- (a) During the three months ended June 30, 2022, employer payroll tax on employee stock transactions reported in cost of revenue was $0.3 million and employer payroll tax reported in operating expenses was $2.5 million. During the six months ended June 30, 2022, employer payroll tax on employee stock transactions reported in cost of revenue was $1.0 million and employer payroll tax reported in operating expenses was $13.8 million. Employer payroll tax on employee stock transactions was not material during the three and six months ended June 30, 2021.
Amortization of acquired intangible assets as follows:
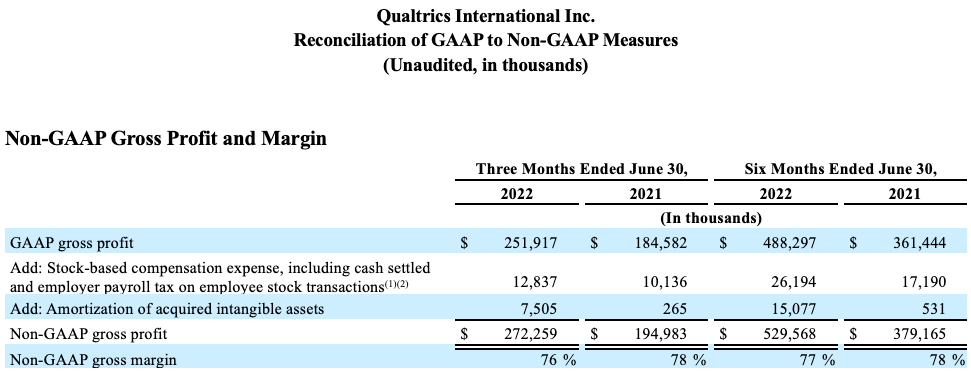
We calculate non-GAAP gross profit as GAAP gross profit excluding equity and cash settled stock-based compensation expense allocated to cost of revenue, including employer payroll tax on employee stock transactions and amortization of acquired intangible assets allocated to cost of revenue. Non-GAAP gross margin is calculated as non-GAAP gross profit divided by total revenue.
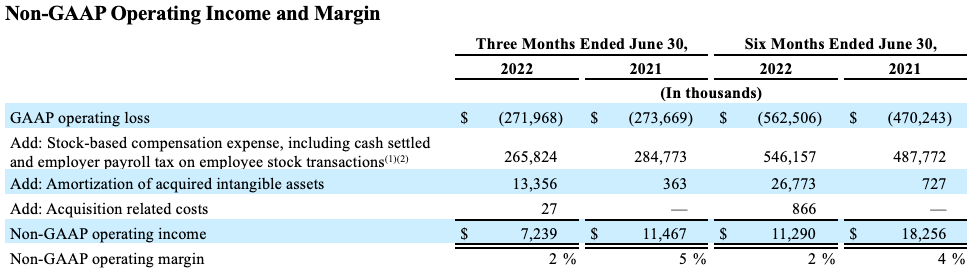
We calculate non-GAAP operating income as GAAP operating loss excluding equity and cash settled stock-based compensation expense, including employer payroll tax on employee stock transactions, amortization of acquired intangible assets, and acquisition related costs. Non-GAAP operating margin is calculated as non-GAAP operating loss divided by total revenue.
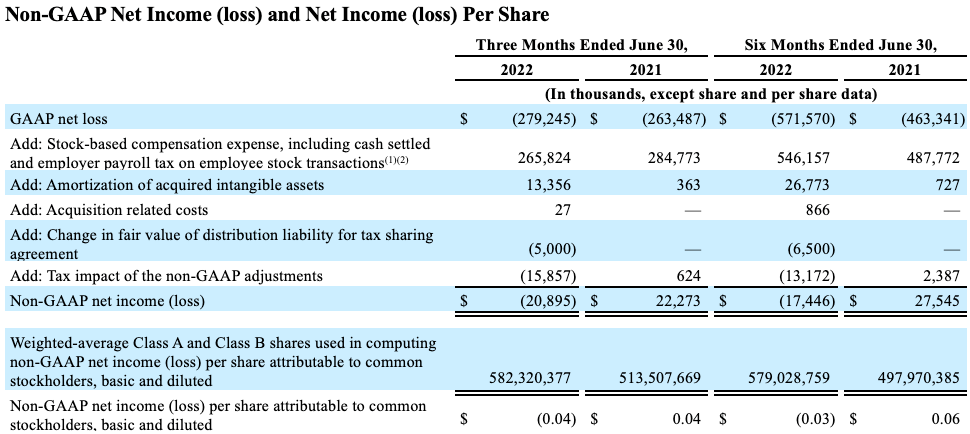
We calculate non-GAAP net income (loss) as GAAP net loss excluding equity and cash settled stock-based compensation expense, including employer payroll tax on employee stock transactions, amortization of acquired intangible assets, acquisition related costs, changes in the fair value of our distribution liability for our tax sharing agreement with SAP, and the tax impact of the non-GAAP adjustments, as applicable. Non-GAAP net income per share is calculated as non-GAAP net income divided by the weighted-average Class A and Class B shares attributable to common stockholders.
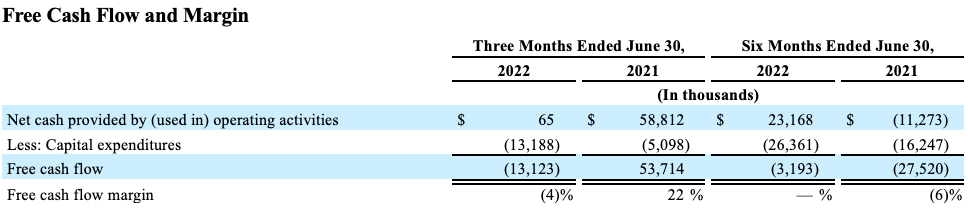
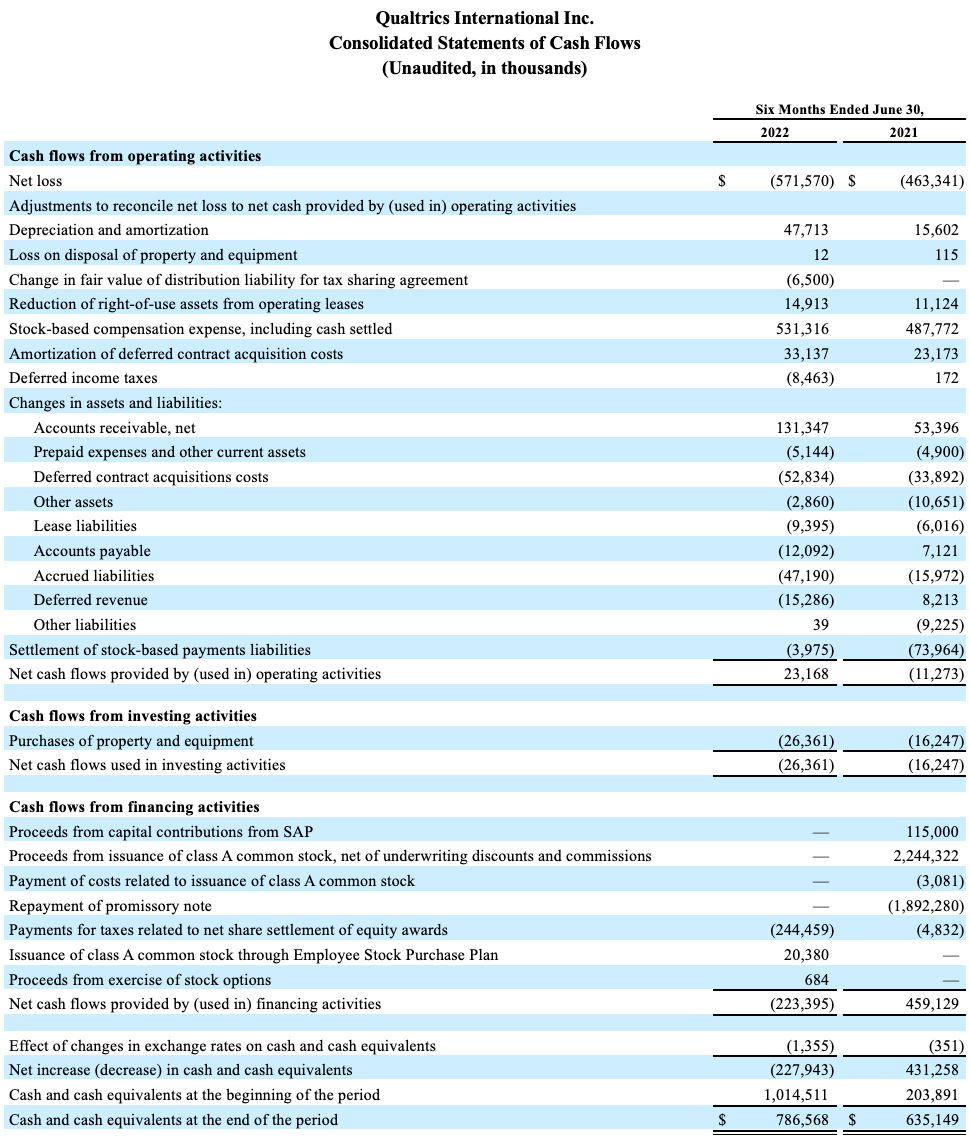
We calculate free cash flow as net cash provided by operating activities less capital expenditures. Free cash flow margin is calculated as free cash flow divided by total revenue. We incurred significant cash outflows in connection with the settlement of liability-classified, stock-based awards in accordance with SAP’s employee equity compensation programs. Our free cash flow for the three months ended June 30, 2022 and 2021 includes $1.3 million and $2.0 million, respectively, in cash outflows related to the settlement of liability-classified, stock-based awards. Our free cash flow for the six months ended June 30, 2022 and 2021 includes $4.0 million and $74.0 million, respectively, in cash outflows related to the settlement of liability-classified, stock-based awards.
________________
(1) Our stock-based compensation expense reflects the recognition of both equity-classified awards and liability-classified awards. Liability-classified awards are settled in cash in accordance with SAP’s employee equity compensation programs. Liability-classified awards are recorded according to mark-to-market accounting. On January 28, 2021, the Company completed a voluntary exchange offer pursuant to which 5.4 million cash-settled legacy restricted stock awards, restricted stock unit (RSU) awards, and options (together, Qualtrics Rights) and 1.3 million cash-settled SAP RSU awards were exchanged into 12.8 million equity-settled Qualtrics RSU awards, representing 93% of the outstanding Qualtrics Rights and SAP RSU awards. On September 13, 2021, the Company completed an additional voluntary exchange offer for certain employees in Australia who were not eligible for the January 28, 2021 exchange, pursuant to which less than 0.1 million cash-settled Qualtrics Rights and SAP RSU awards were exchanged and modified into equity-settled Qualtrics RSU awards.
(2) During the three months ended June 30, 2022, employer payroll tax on employee stock transactions reported in cost of revenue was $0.3 million and employer payroll tax reported in operating expenses was $2.5 million. During the six months ended June 30, 2022, employer payroll tax on employee stock transactions reported in cost of revenue was $1.0 million and employer payroll tax reported in operating expenses was $13.8 million. Employer payroll tax on employee stock transactions was not material during the three and six months ended June 30, 2021. The amount of employer payroll tax-related items on employee stock transactions is dependent on our stock price and other factors that are beyond our control and do not correlate with the operation of the business. When evaluating the performance of our business and making operating plans, we do not consider these items (for example, when considering the impact of equity award grants, we place a greater emphasis on overall stockholder dilution rather than the accounting charges associated with such grants). We believe it is useful to exclude these expenses in order to better understand the long-term performance of our core business and to facilitate comparison of our results to those of peer companies and over multiple periods.