
Step 5: Simulate Different Packages
What's on this page
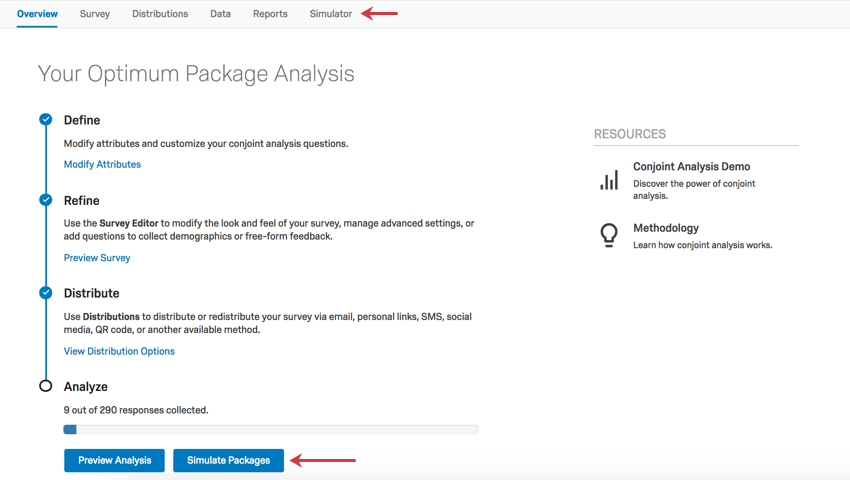
Now that you’ve collected your data and observed some preliminary reports, it’s time to decide what package to offer. Qualtrics provides you with tools to simulate packages and respondent preferences for them. Navigate to the Simulator tab or select Simulate Packages on the Overview to get started.Qtip: Conjoint projects are an additional purchase. Please contact your Account Executive if you are interested in learning more about this product.
Simulator
Within the simulator you can change package settings or add more options to gauge how your customers would react. You can use the dropdowns at the top to select from the available simulator options, First Choice and Preference Share.
Qtip: For an in-depth guide on how to use the simulator, see Simulating Packages.
Preference Share
This simulator options is based on the preference share across the included packages being tested in the simulator.
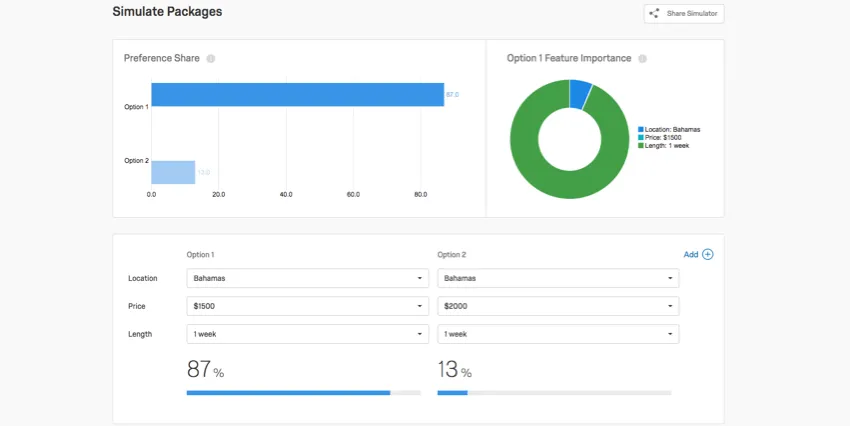
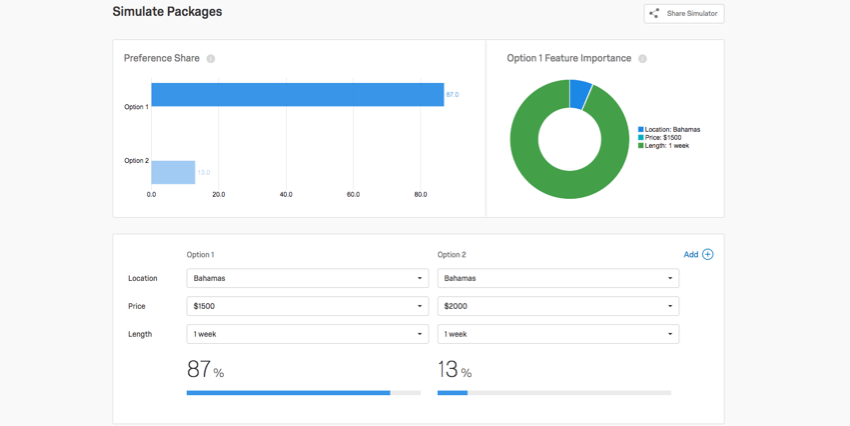
On this tab, you will see a bar graph and pie graph along the top, and a visualization along the bottom where you can add and remove different attributes. The adjustment you make in the bottom visualization will adjust the graphs at the top. Both the bottom visualization and the bar graph will show you, between the options displayed, what percentage of respondents would prefer that option.
Example: In the image above, we have 2 options (packages) in the bottom visualization. We can see from the bar graph along the top that a week trip in the Bahamas that costs $1500 is preferable to a week trip in the Bahamas that costs $2000. 86% of respondents surveyed preferred the $1500 option.
Meanwhile, in the pie graph, the green Length section is much larger than both the blue Location and turquoise Price combined. Despite what we might assume, Length was the feature respondents found most important when making their decision!
As you add more options, you will see how the preference splits.
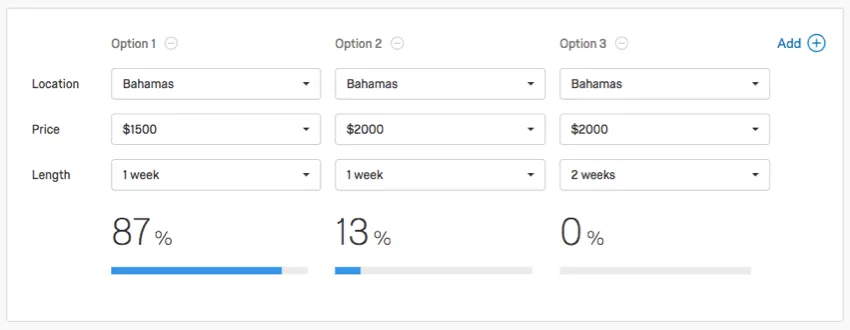
Example: Between Option 1 and 2, some respondents were willing to pay a little more for a week long trip in the Bahamas. But not even those willing to pay $2000 to go to the Bahamas were willing to extend their trip to 2 weeks.
This tool is perfect for understanding the sensitivity that customers would have to various changes. For example, perhaps a change of location wouldn’t bother customers, but the price of the vacation drastically changes their decision. This helps you understand what trade-offs customers are willing to make.
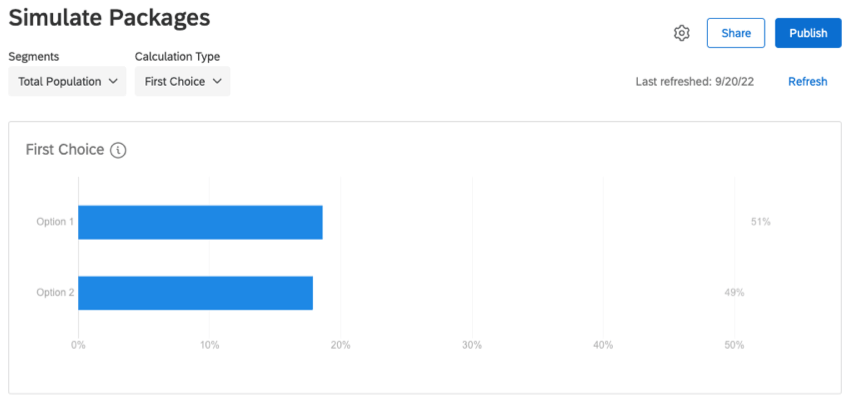
First Choice
This simulator option is based on the percentage of respondents that choose a particular option as their first choice.

On this tab, you will see a bar graph along the top, and a visualization along the bottom where you can add and remove different attributes. The adjustment you make in the bottom visualization will adjust the graphs at the top. Both the bottom visualization and the bar graph will show you, between the options displayed, what percentage of respondents would prefer that option.
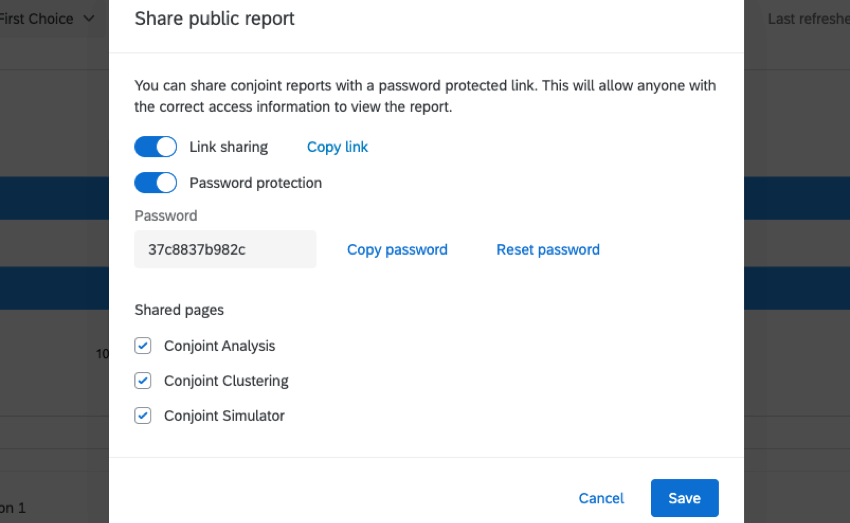
Sharing the Simulator
You can share the Simulator with your colleagues so that they can simulate different packages, too!

The sharing option will generate a link for a report webpage. An access code will be added to the link to ensure your data will only be viewed by people you give the code to. If you have multiple pages available, you can select which ones you want to share.
FAQs
How can I stay up to date on new Qualtrics features?
How can I stay up to date on new Qualtrics features?
To access these release notes, you need an XM Community account. These accounts are free for any users with a Qualtrics account. This support page contains information for how to register an XM Community account.
Once you're logged into the XM Community, head over to the Weekly Product Updates Introduction Post. This post contains all the information you need to get started with subscribing to product updates!
That's great! Thank you for your feedback!
Thank you for your feedback!