
Intro
In this guide, we’ll explore how pricing surveys work, and look at the three main types of analysis that will help you set the perfect price point for your product launch:
- Van Westendorp Pricing Studies
- Gabor Granger Pricing Analysis
- Conjoint Analysis
They all use a pricing survey as a starting point and then apply different analytical methods to help identify the perfect price point.
Read on to find out how each study works, when it’s useful to use it, and explore our sample pricing survey templates to get started with your pricing and value research today.
Why run pricing studies?
How you price your products is an essential ingredient to a successful product launch. Product pricing doesn’t just dictate the dollar amount at which you will agree to part with your product — price is communication and signal too.
For example, a high-end fashion designer would never agree to sell their perfume for the same price as a dollar-store aftershave, not just because their profit margin would suffer, but also because that price would signal a cheapening of their entire brand and make it less likely shoppers would be willing to spend as much on their other products.
It can be the difference between success and failure — price too high and your product may be out of reach for your target audience; price too low and you could signal to the market that it’s of lower value than it really is.
A pricing study is how you understand all these factors to settle on a price point that:
- Your target market will be willing to pay
- Reflects the value you’re trying to communicate to buyers
About pricing surveys
Pricing studies work by asking respondents a series of questions about what they’re willing to pay for a product. There are a few approaches and methodologies you can employ, but at their heart they’re all about evaluating how, in the real world, consumers will value your product, and how much they’d be willing to part with to get it.
Add that insight to key operational data like the cost to manufacture or provide a service, and expected sales volume, and you can make accurate predictions about the success of a product in market based on various price points.
Product managers will typically use the insights gathered from pricing and value surveys to determine the merits of increasing prices (to boost profit margins) or evaluate the impact of decreasing prices.
You can run effective studies using a variety of research approaches, including conjoint analysis, Van Westendorp models, Gabor-Granger Price Sensitivity studies, and price rating scales.
Which pricing survey to use?
Before we go into detail about how each method works, and what you need to do to get started, here’s a quick comparison of the four main approaches:
| Price ratings scales | Van Westendorp Pricing Studies | Gabor-Granger Price Sensitivity | Conjoint Analysis | |
|---|---|---|---|---|
| Best for | When you want to compare a set of predefined price points to see which would be most acceptable to your target customers. | When you have a product and you aren’t trying to change it, but you don’t know the right price range. | When you have a defined product and a specific price range, but you don’t know what it should be priced at within that range. | When you have multiple product options or want to capture other factors in addition to price. |
| Benefits | Simple to program | Simple for respondents. Simple to program. Suggests an optimal price point driven by consumers | Simple for respondents. Gives you an optimal price range | Provides more details than just pricing. Allows you to create optimum pricing and packaging |
Price rating scales
Rating scales are one of the simplest ways to use a pricing survey to understand a consumer’s preference.
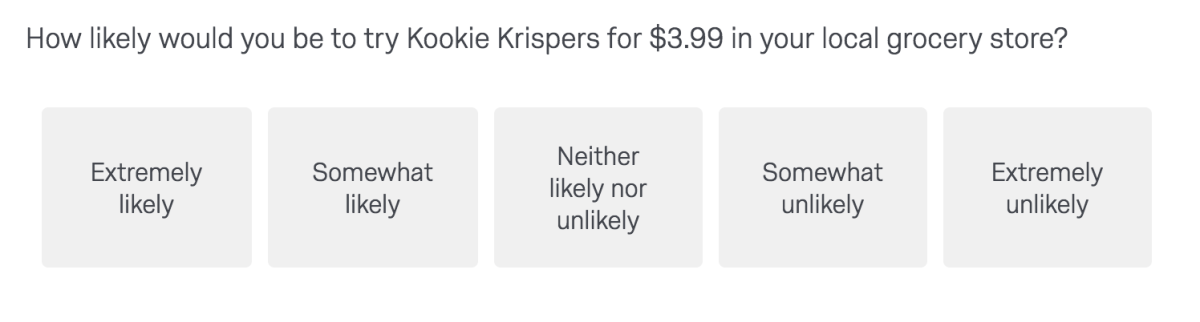
They use graded scales to indicate the importance or acceptability of a given concept, and can help you understand:
- The degree of importance that consumers attach to a given price level
- The likelihood of trial
- The likelihood of purchase at given price points
- The overall acceptability of a series of price points
Unlike the other methods we’ll explore below like Van Wetendorp or Gabor Granger studies, price ratings scales won’t pinpoint an optimal price point. Instead, they’re used to measure the acceptability of pre-defined prices and can be a useful study if you’re looking to increase or decrease the price of an existing product and want to see how that would impact sales.
Given the advance in modern research technology that makes more complex techniques accessible to anyone with an internet connection and 10 minutes to set up a study, price ratings scales are becoming less common. After all, why limit yourself to a few pre-selected prices when you can automatically identify the optimal price point using one of the other techniques?
Get started with our free pricing survey template
Van westendorp pricing model
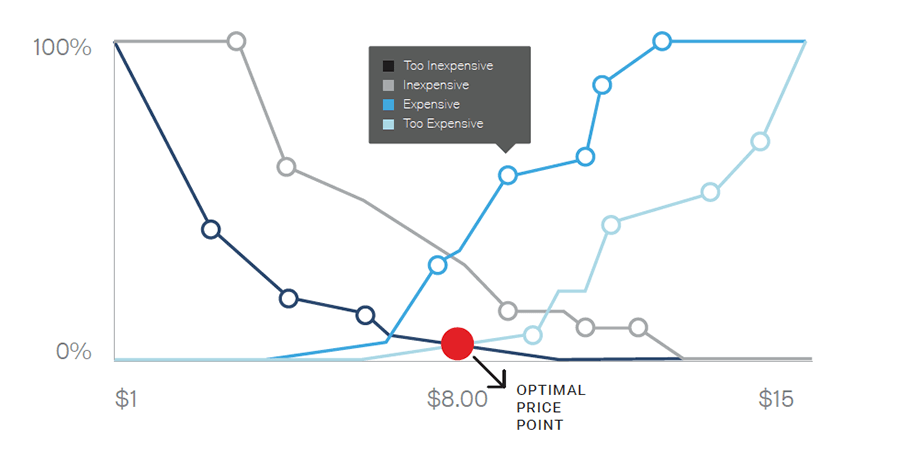
The Van Westendorp method uses a series of questions — presented to respondents after they’ve seen a product description — to identify key psychological price points and identify price elasticity of a product.
Respondents are asked:
- The price at which the product is so cheap that they would question its quality
- The price at which the product is inexpensive, but not so inexpensive that they would question its quality.
- The price at which the product is expensive, but not so expensive that they would still consider it
- The price at which the product is so expensive that they would not consider it
The price measurements in each of the respective categories provide a distribution of perceptions about the acceptable price of the product. The analysis of these distributions will help answer such questions as:
- what is the average expected price?
- at what price would we expect purchase intention to drop sharply?
- at what point is the price too inexpensive to imbue a quality image?
From there, you can see the optimal price point for your product.
The key to an effective Van Westendorp study is to create a price scale so that lower is not always better and so that you can differentiate users of a product from non-users.
It’s worth remembering too that respondents often report a preference for an expensive product over a cheaper alternative, but this may not hold true in an actual purchase situation so validation measures are essential.
Gabor Granger pricing studies
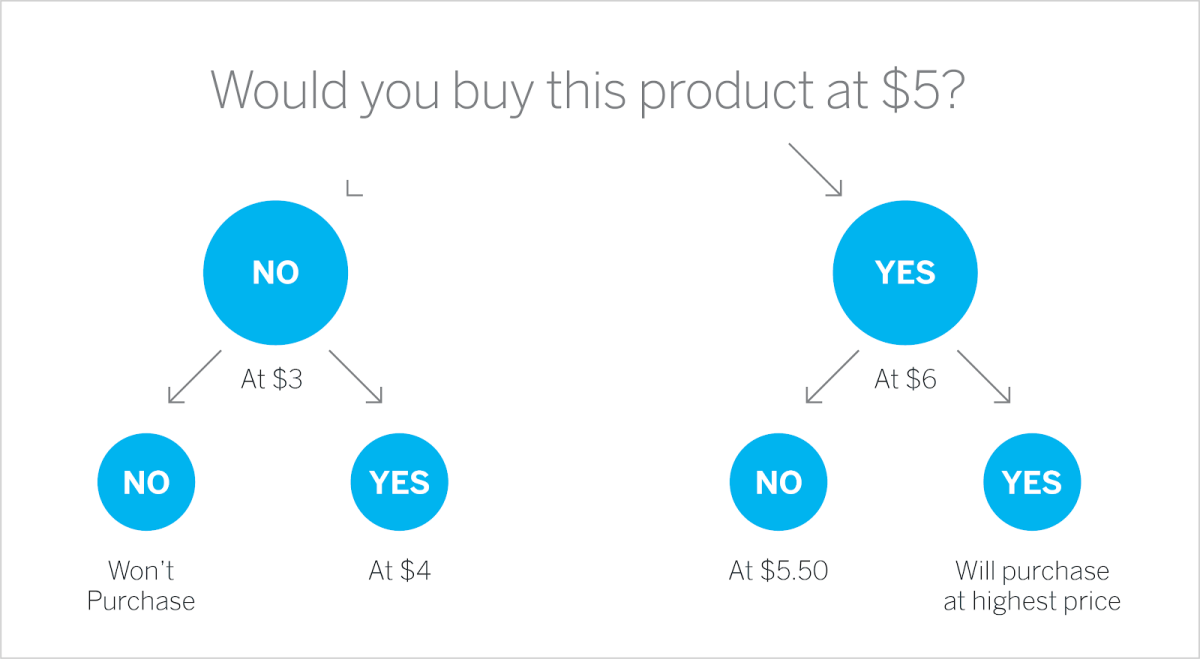
This pricing survey works by trying to establish the maximum amount someone would be willing to pay for a product or service.
Respondents are presented with set price points to determine the highest where each one would purchase, and then your responses are used to find the optimal price range for your target customer.
These pricing surveys use advanced survey logic to continually move through a series of questions to get to the highest price point.
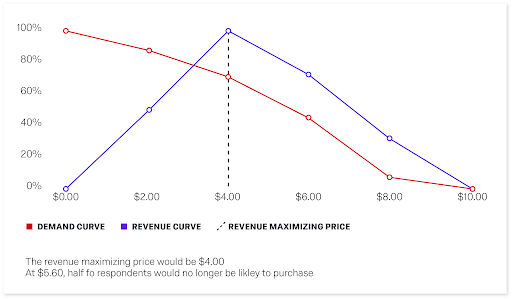
The resulting analysis gives you two key pieces of information:
- Demand Curve – the percentage of participants willing to pay at each price point
- Revenue Curve – the price point at which you will capture the most revenue
Learn about Qualtrics Gabor Granger Pricing Sensitivity Solution
Conjoint analysis
One of the most complex, yet most accurate pricing studies, conjoint analysis is a method that enables you to see the trade-offs consumers would make in the real world.It’s typically used where you have more variables than just price to take into account, for example if you’re deciding which features to include in a product, or which services to include in a customer offer.
Respondents are shown a series of configurations, at different price points, and asked to choose between them. The configurations can be randomized too, so you can see the different trade-offs customers make, for example would they be willing to pay more to have a 4K screen on a laptop, or would they choose an HD screen at a lower price point.
While traditionally conjoint was the most complex study to run — often making it inaccessible to all but the most seasoned researcher — today’s market research software has made it as simple to run as any other pricing survey.
Different types of conjoint analysis
There’s a number of different types of conjoint analysis you can use:
- Full-Profile Conjoint Analysis
A user is shown a series of distinct, complete product profiles (made up of a series of attributes eg price, features etc) and asked to make a choice between them. By controlling the attribute pairings, you can correlate attributes with profile preferences and estimate the respondent’s utility for each level of each attribute tested. - Choice-Based/Discrete-Choice Conjoint Analysis
Users are asked to choose repeatedly from a set of 3-5 full profile concepts. It’s designed to mimic real-world shopping behavior by presenting two complete offerings side by side. The data is then analyzed to identify the preference for different attributes and features based on the trade-offs the user made when making their choices. - Adaptive Conjoint Analysis
This is a ‘smart’ form of conjoint analysis as the choice sets presented to the user are adapted based on the choices they made in the previous question. So it quickly identifies their preferred features and levels and excludes profiles which will clearly be of no interest to them, thus making it more efficient and ensuring each package shown is more competitive. - Max-Diff Conjoint Analysis
Users are shown a series of packages and asked to choose the best/most preferred and worst/least preferred. It’s designed to cut out the ‘middle ground’ and focus respondents on the best and worst items in a list, requiring less effort on their part.
Want to know more about the different types of conjoint?
With so many options available, it’s definitely worth using conjoint analysis software that automatically chooses the right test for your pricing study.
Whatever type of conjoint analysis you use for your pricing study, the results will show you how changes to pricing, as well as other attributes such as the features you include in your product, will impact its success.
With Qualtrics Conjoint Analysis your results are presented with the optimum package, as well as a simple to use simulator, so you can build bespoke packages and see how changes to pricing will impact everything from customer preference to market share.
Other pricing studies to consider
While Van Westendorp, Gabor Granger and Conjoint Analysis are the three most common pricing studies used to determine product pricing, there are alternative ways of assessing pricing.
‘Real world’ pricing experiments
It’s not uncommon for companies to test pricing in the wild by presenting different market segments with different product, pricing, or purchase information. This is easiest done through an eCommerce store, where you have plenty of data on your users to be able to customize what they see when they land on your website.
However, you can also do this in location-based businesses like restaurants, retail stores etc. by running pricing experiments in specific locations and comparing the results against your control.
These studies can be useful to determine real world behavior, however they are limited in scope. For example, while a Van Westendorp study will get you the optimal price point in a few days of fielding a pricing survey, in-store or online studies may need weeks or months of data to get significant results. Even then, for your real-world studies you’re evaluating a finite number of price points, whereas many of the methods we’ve discussed in this article will choose the perfect price point for you based on advanced statistical analysis.
Econometric models
Tracking the effects of pricing on market share over an extended period of time can give you a unique view of price-demand relationships. Monthly or quarterly measures show changes that result from marketing programs, competitive action, or general market demand.
These trend analysis studies estimate price-demand relationships and can show the interaction between price and brand sales if market measures of price changes are included.
Again, this method can take months or quarters to get the data you need, compared to the fast turnaround of conjoint or Van Westendorp studies run through a market research platform.