
R Coding in Stats iQ
What's on this page
Attention: You are reading about a feature that not all Stats iQ users have access to. If you’re interested in this feature, contact your Account Executive to see if you qualify.
About R Coding in Stats iQ
R is a statistical programming language that is widely used for flexible and powerful analysis. This page explains how you can start coding in R from right inside Stats iQ.
Attention: Unfortunately, while Qualtrics Support can help you with the R code variable setup and other basics described on this page, they cannot provide assistance with custom coding in R. However, you can always consult the Developer Corner on the Qualtrics Community if you have any questions about coding in R.
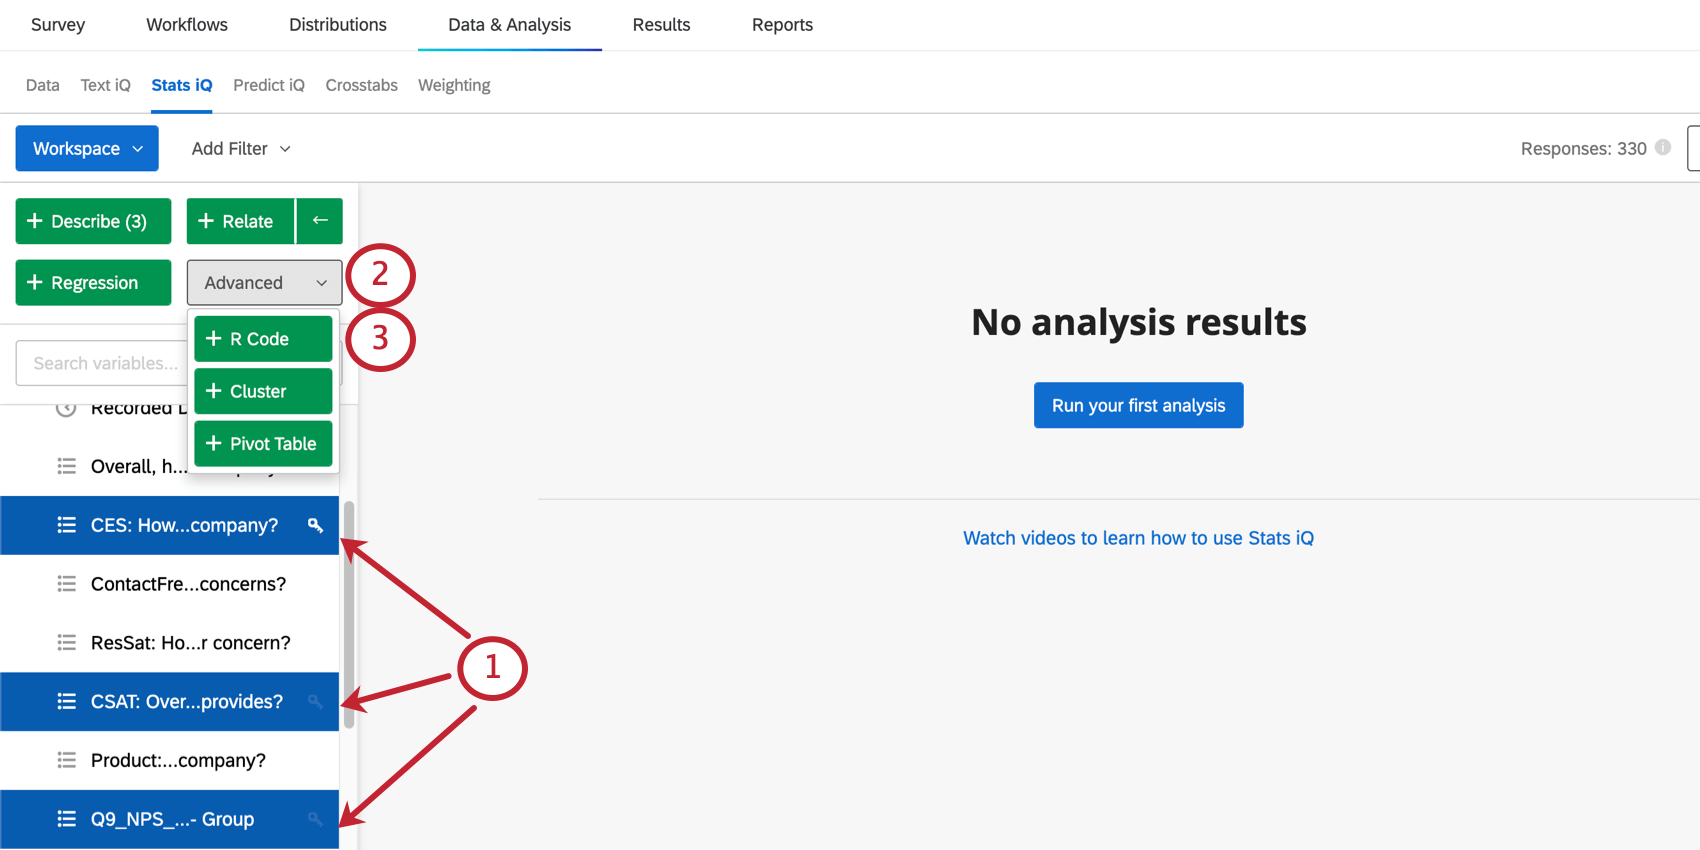
Selecting Dataframe Variables for R Code
Before you can begin coding in R, you will need to select the variables that will be part of your “dataframe.” Your dataframe is the collection of variables that you would like to perform your analysis on. These variables can be any type.
Qtip: You can select multiple variables, but limits vary based on the size of your data. See Dataframe Size below for more details.
Once this is done, your next step will be to name your variables.
Attention: If you’re familiar with R, you may be used to having your entire dataset be the dataframe for your R code. Selecting your variables beforehand might feel strange, but you will still have the option to change your dataframe as you are writing code.
Dataframe Size Guidelines
There are some limitations to the size of the dataframe you can use when coding with R in Stats iQ. Depending on the types of variables you include in your dataframe, it is possible that you may be able to analyze a larger number of variables or a smaller number of variables based on the size of a single cell.
By “cell,” we mean to visualize the data as a table or spreadsheet. The number of cells in your dataset is the number of rows (individual data points / responses) multiplied by the number of columns (the fields in your dataset). The size of each individual cell (i.e., the amount of memory it takes up) is dependent on the variable type.
Example: You can analyze a dataframe that has 30 Numeric variables with 20 million rows (i.e., 600 million data points).
Example: If you have 15 Categorical variables, and all of the variables have categories that are at most 10 characters long, you can have 20 million rows worth of data (i.e., 300 million data points). On the other hand, let’s say you have a Categorical variable named Department that has the categories “Sales,” “Customer Success,” and “Support”. The category “Customer Success” is more than 10 characters long. You can include other Categorical variables in your dataframe that are similar to Department that have categories longer than 10 characters, but the number of rows in your dataframe will have to decrease for each variable you add. Categories longer than 10 characters will take up more memory.
The maximum dataframe size is 512MB. Note that the dataframe does not comprise the entire dataset, but only selected variables.
Naming Dataframe Variables for R Code
Once you’ve chosen your variables and clicked R Code, you will be asked to name your variables. This section covers how to give your variables R code-compatible names.
Qtip: If a variable has a name with fewer than 50 characters, Stats iQ will automatically create an R-compatible name for it. Feel free to edit this name as needed.
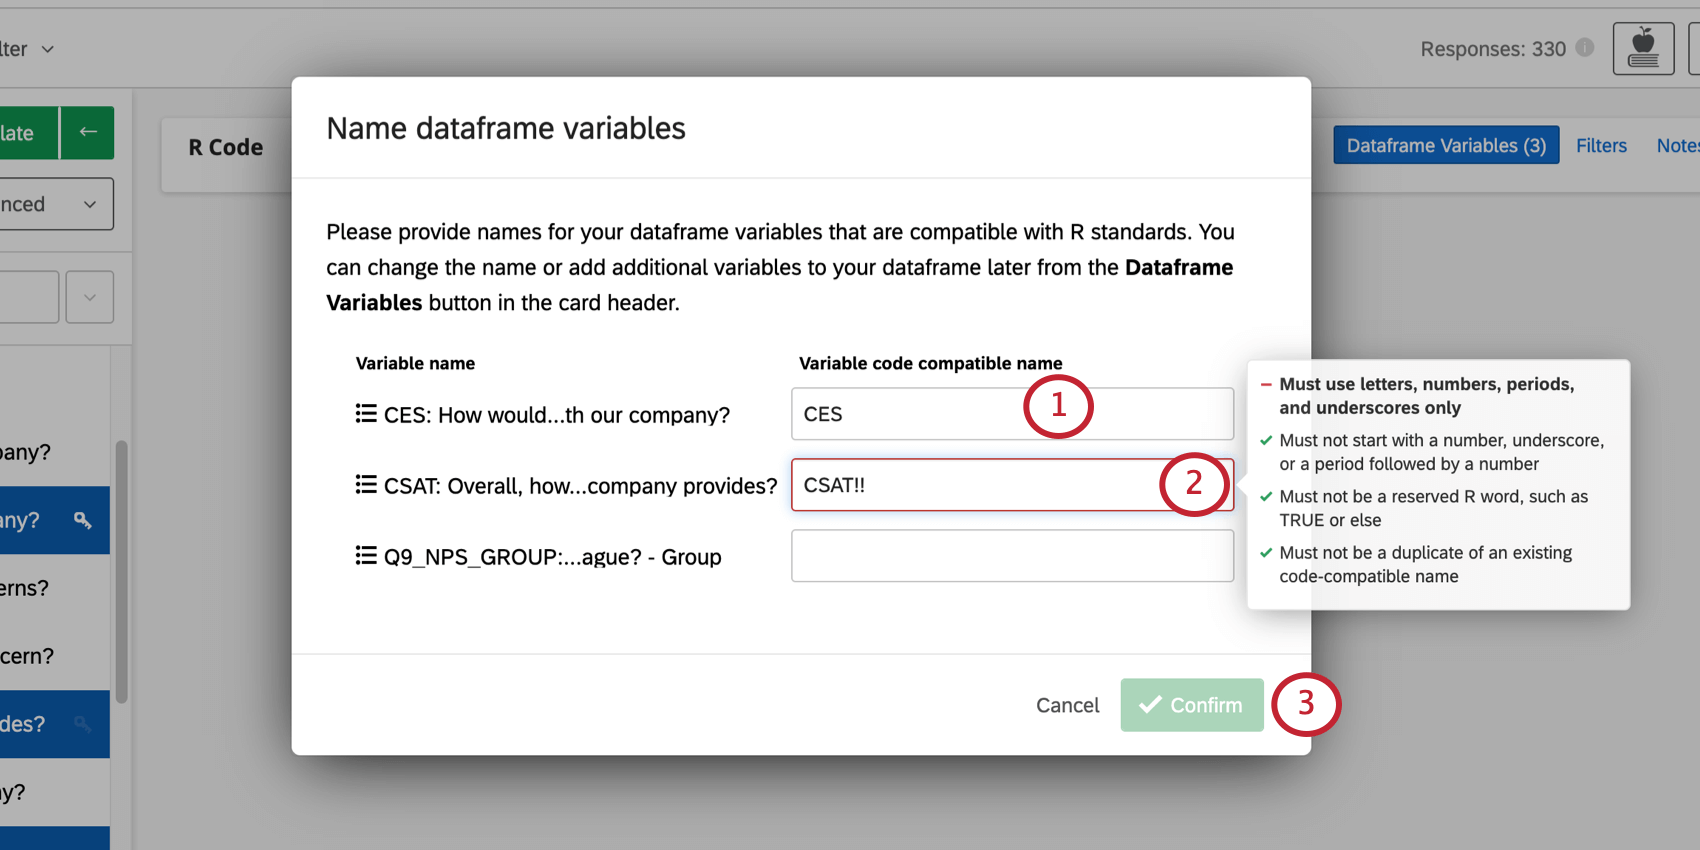
- Must use letters, numbers, periods ( . ), and underscores ( _ ) only.
- Must not start with a number, underscore, or a period followed by a number.
- Must not be a reserved R word, such as TRUE or else.
- Must not be a duplicate of an existing code-compatible name within the same R code card.
Qtip: You will not be able to confirm until all names are code-compatible.
Qtp: R code-compatible names for variables do not carry over between R Code cards.
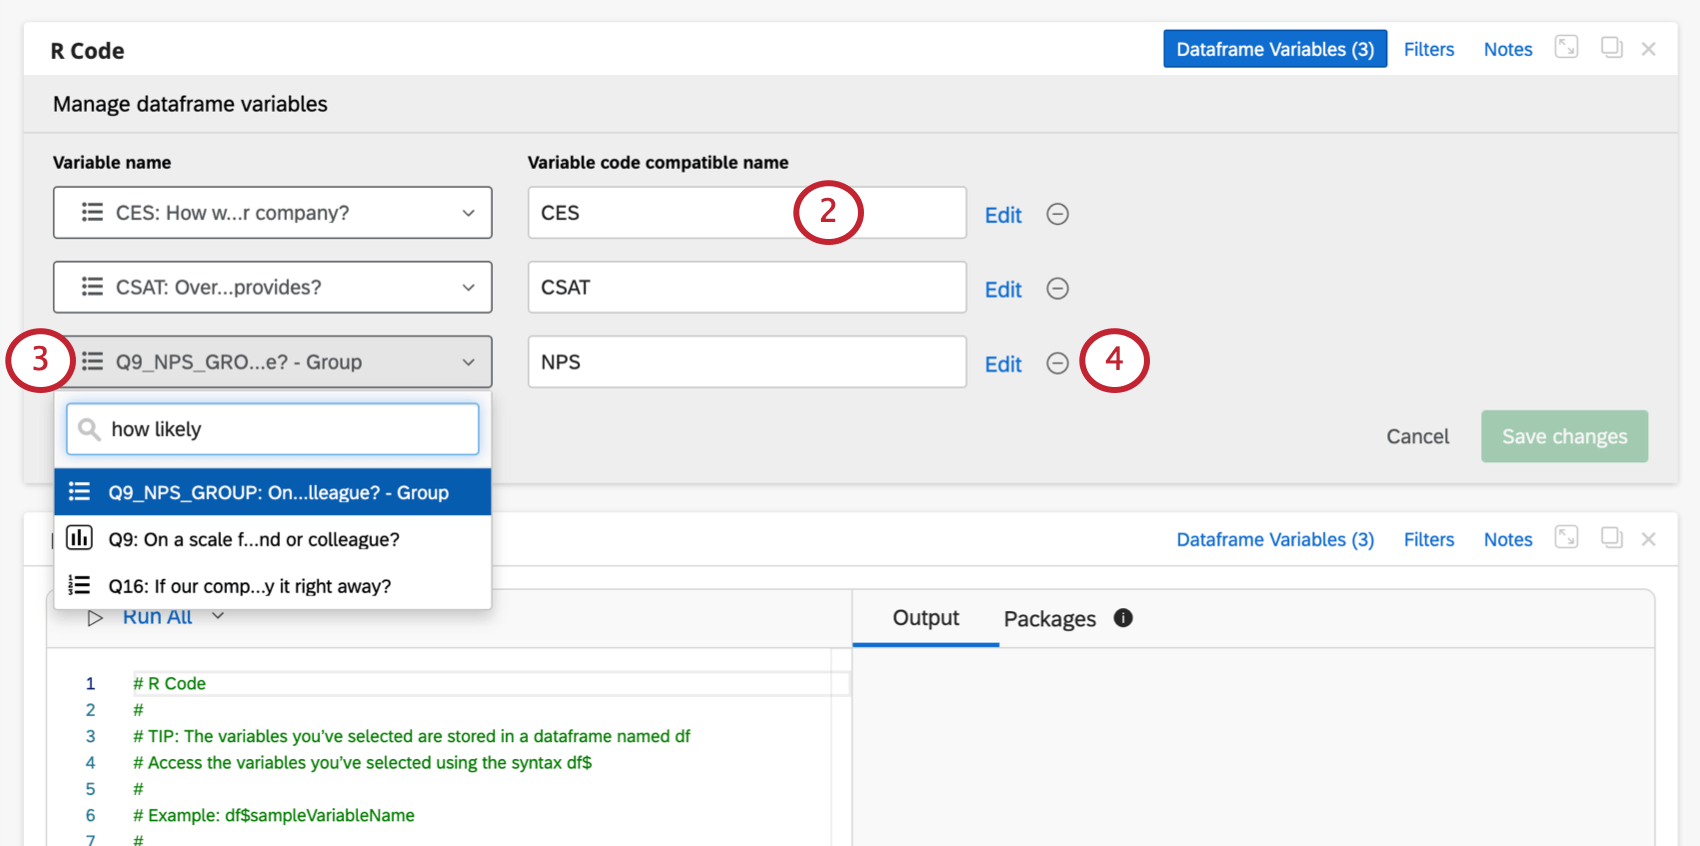
Modifying Dataframe Variables in the R Code Card
After you choose your first dataframe variables, you can change or rename them as needed.
Qtip: If you’re editing variable names, make sure to meet the requirements.
Example: We added NPS group, but want to change this to the numeric NPS value (0-10) instead.
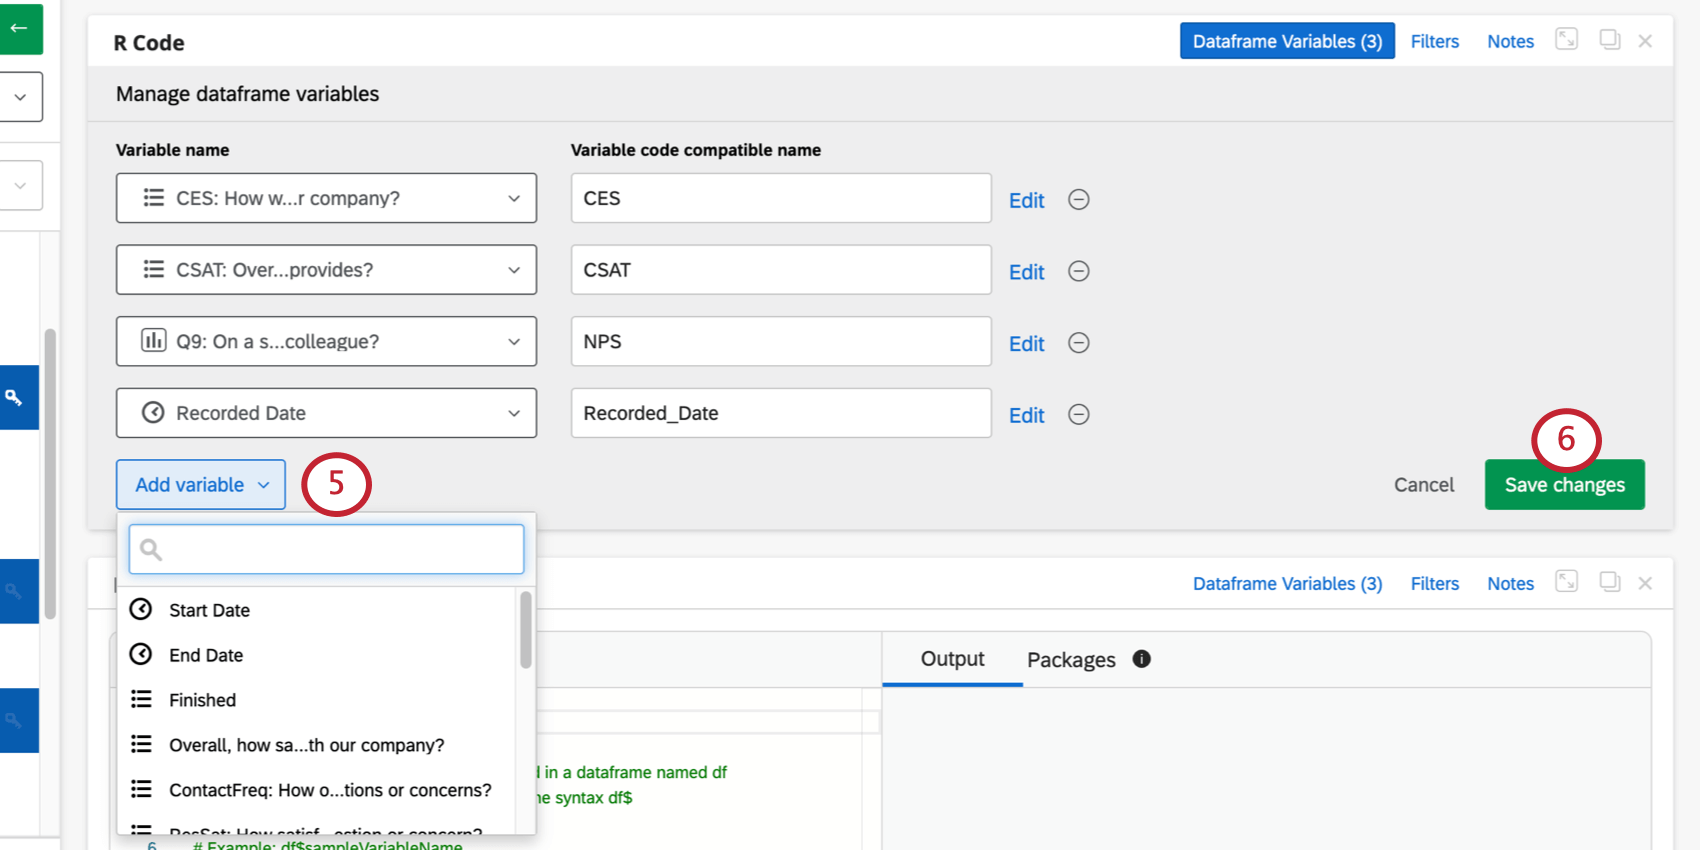
Qtip: The Edit button next to each variable will take you to adjust the recode values or bucketing. Bucketing is where you can adjust top / bottom box.
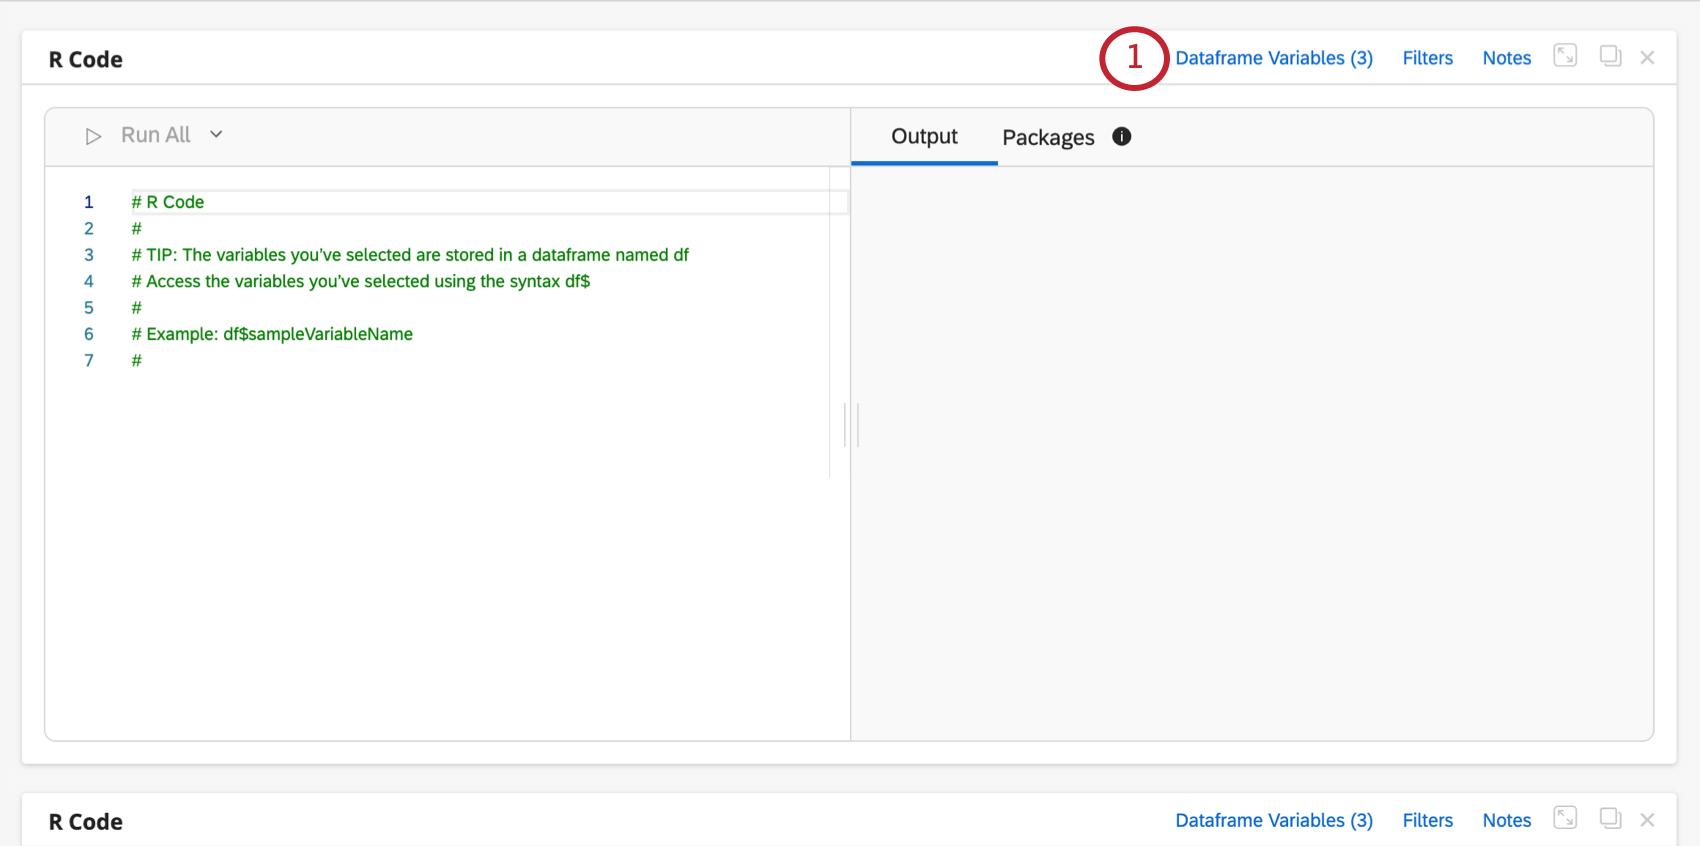
Writing and Executing R Code
The R Code card is split in half down the middle. The left half is where you can edit your code. The right half is where you will see the outputs from executing your code.
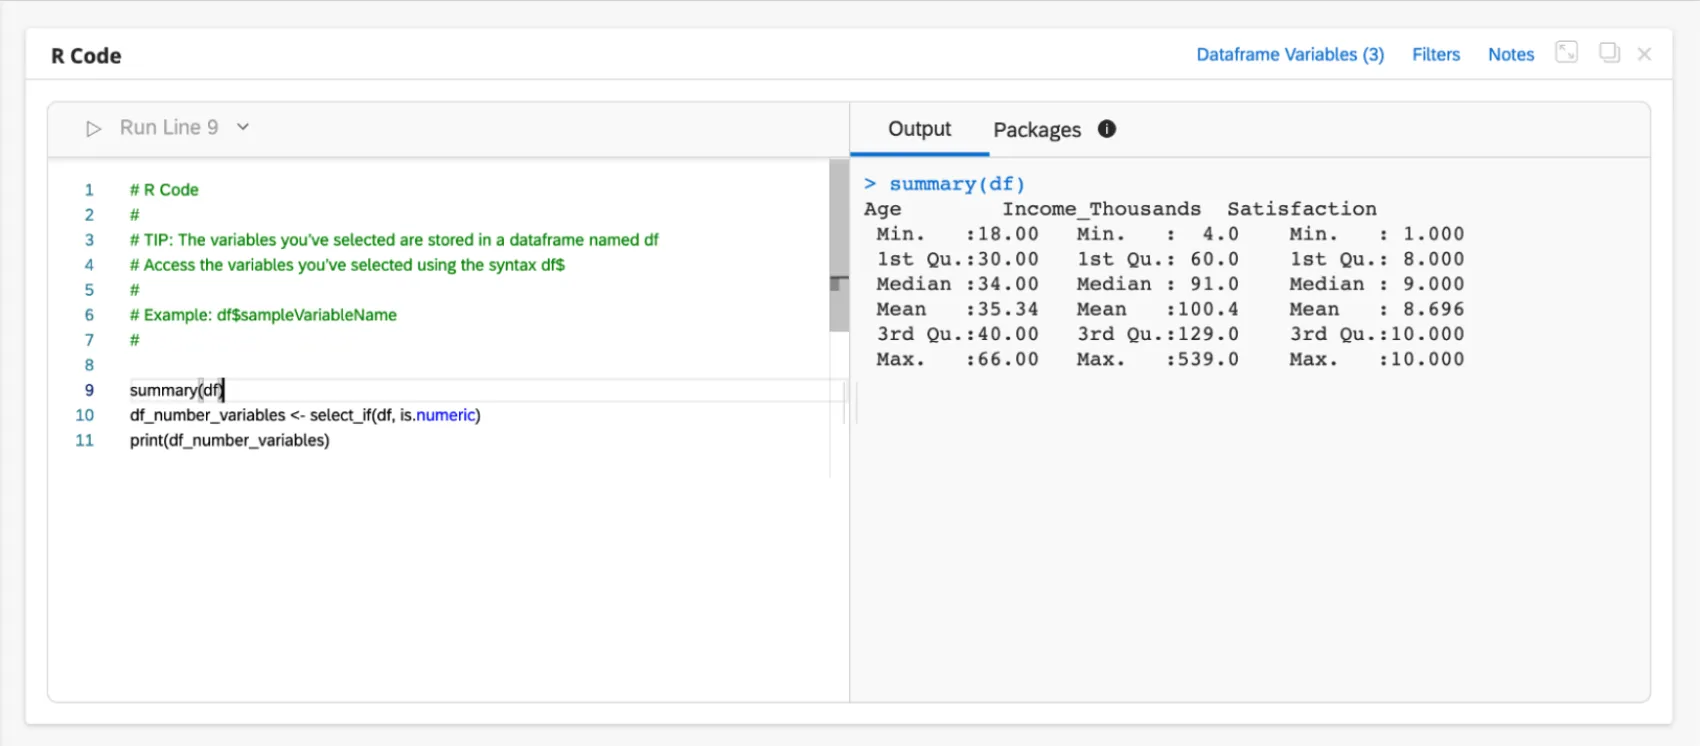
You can execute a single line of code by clicking the Run Line button at the top or using the keyboard shortcuts Cmd + Enter (for Mac) or Ctrl + Enter (for PC) when your cursor is on a specific line.
Once you trigger the execution of a line, you will see the output associated with the line in the Output tab of the right half of the card. The Output tab will display the line of code that was executed in blue and the result of the execution right underneath.
Attention: The Stats iQ R Integration does not use the same code runtime mechanism as RStudio. In the Stats iQ R Integration, if you trigger execution of code on line 15, all the code from lines 1 to 15 will be executed, and then only the output of line 15 will be displayed. Thus, if you execute code for a particular line, all the lines up until the one selected will run, and then only the selected line’s output will be displayed.
Autocomplete for Dataframe Variables
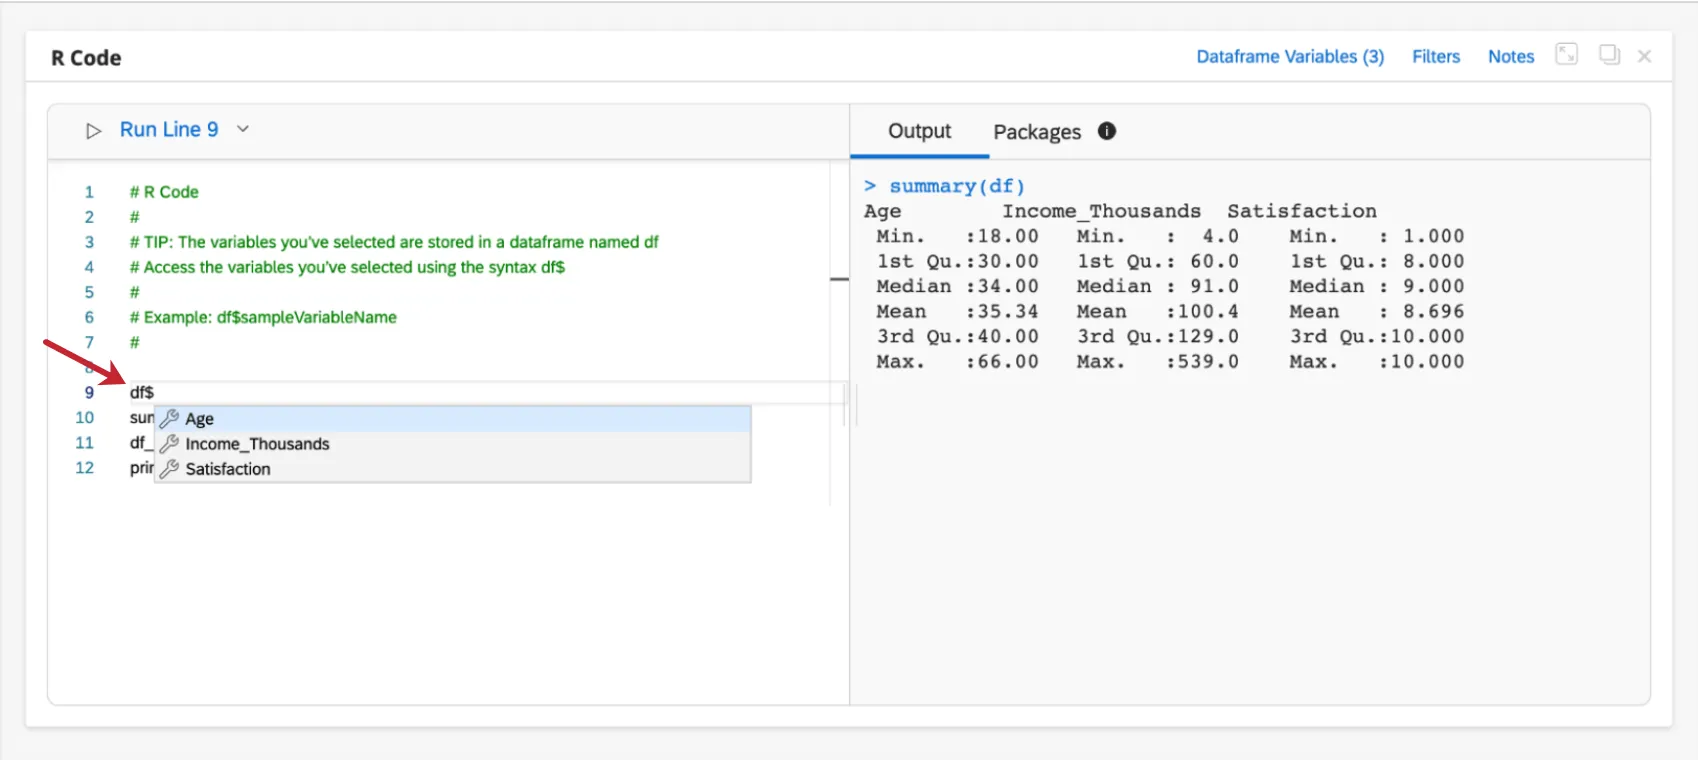
You will see autocomplete suggestions for your dataframe variables if you type df$ in the editor.
Using R Packages
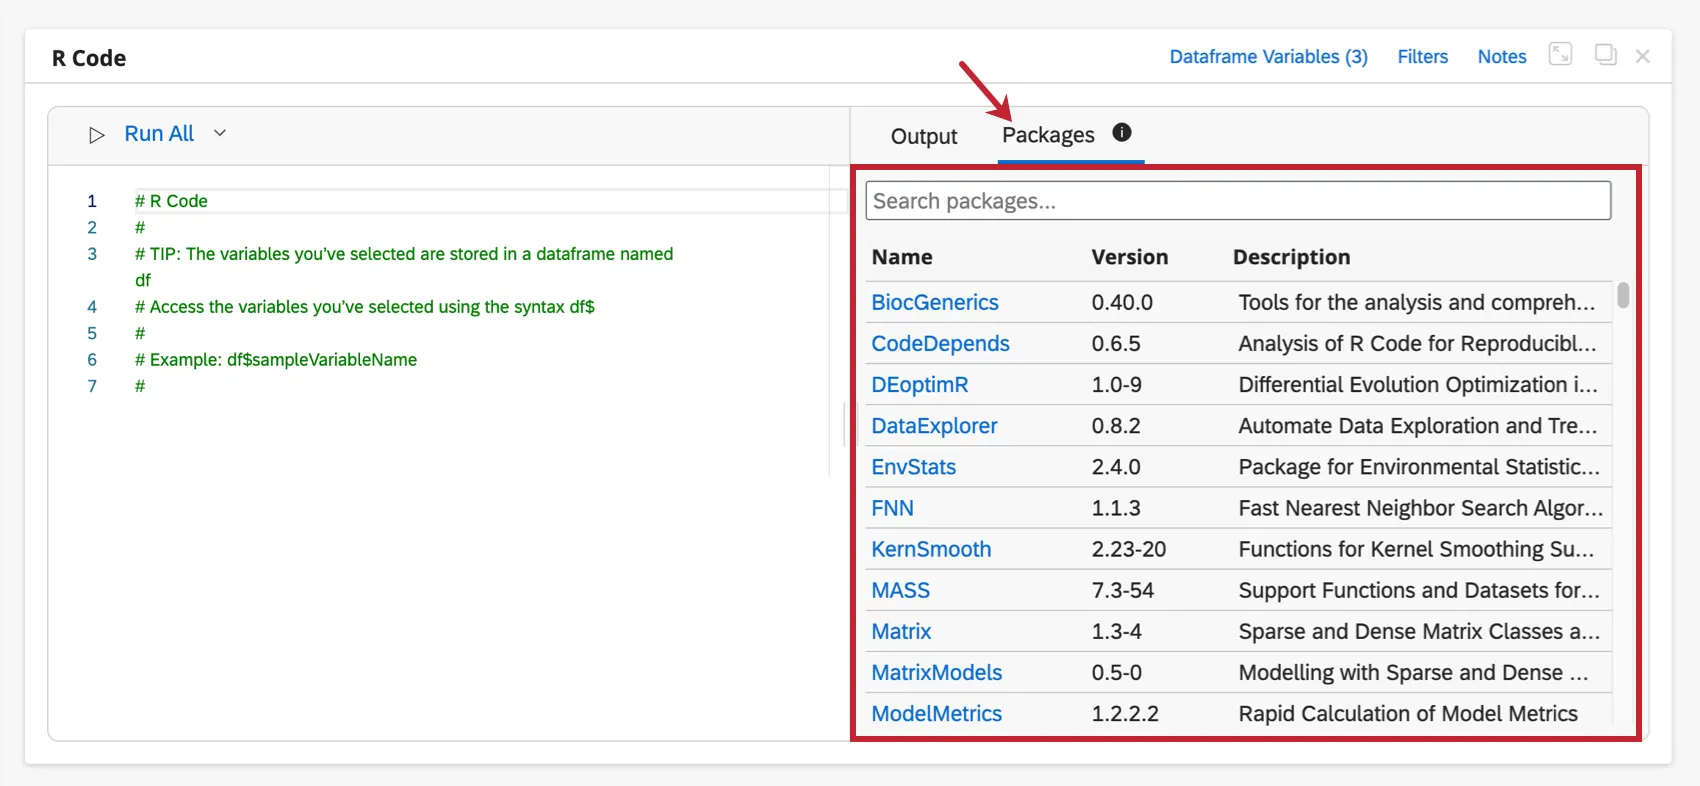
R coding in Stats iQ comes pre-installed with hundreds of the most popular R packages used for analysis. Click on the Packages tab in the right half of the card to see the list of available packages. You can use the search bar at the top to search for specific packages.
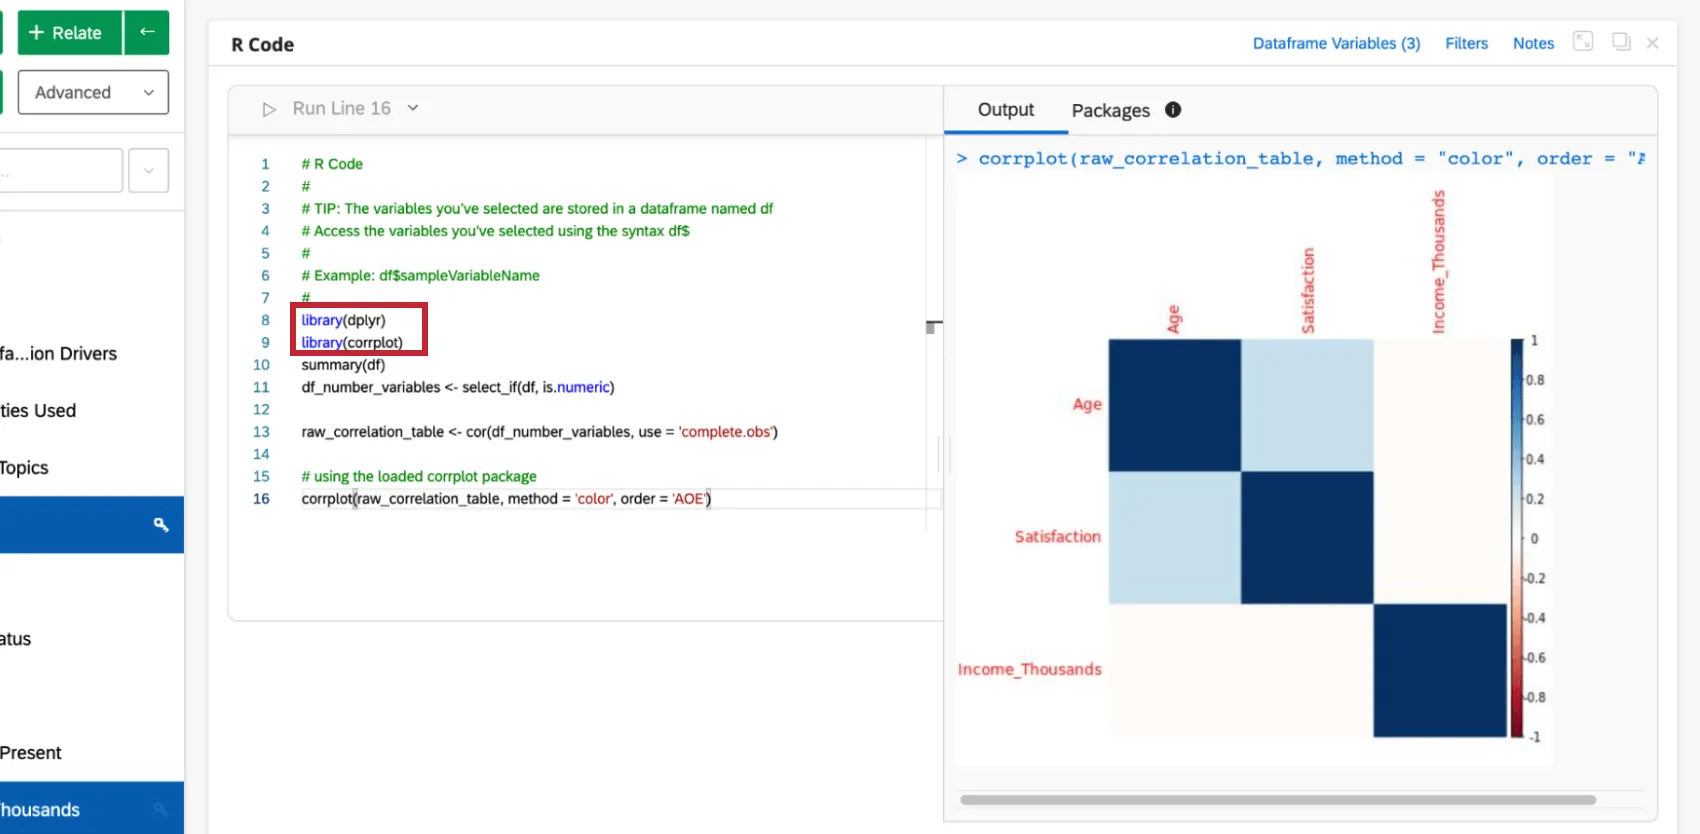
To use a package, use the library() command in the code editor to the left. Enter the package name in the parentheses and then execute the code.
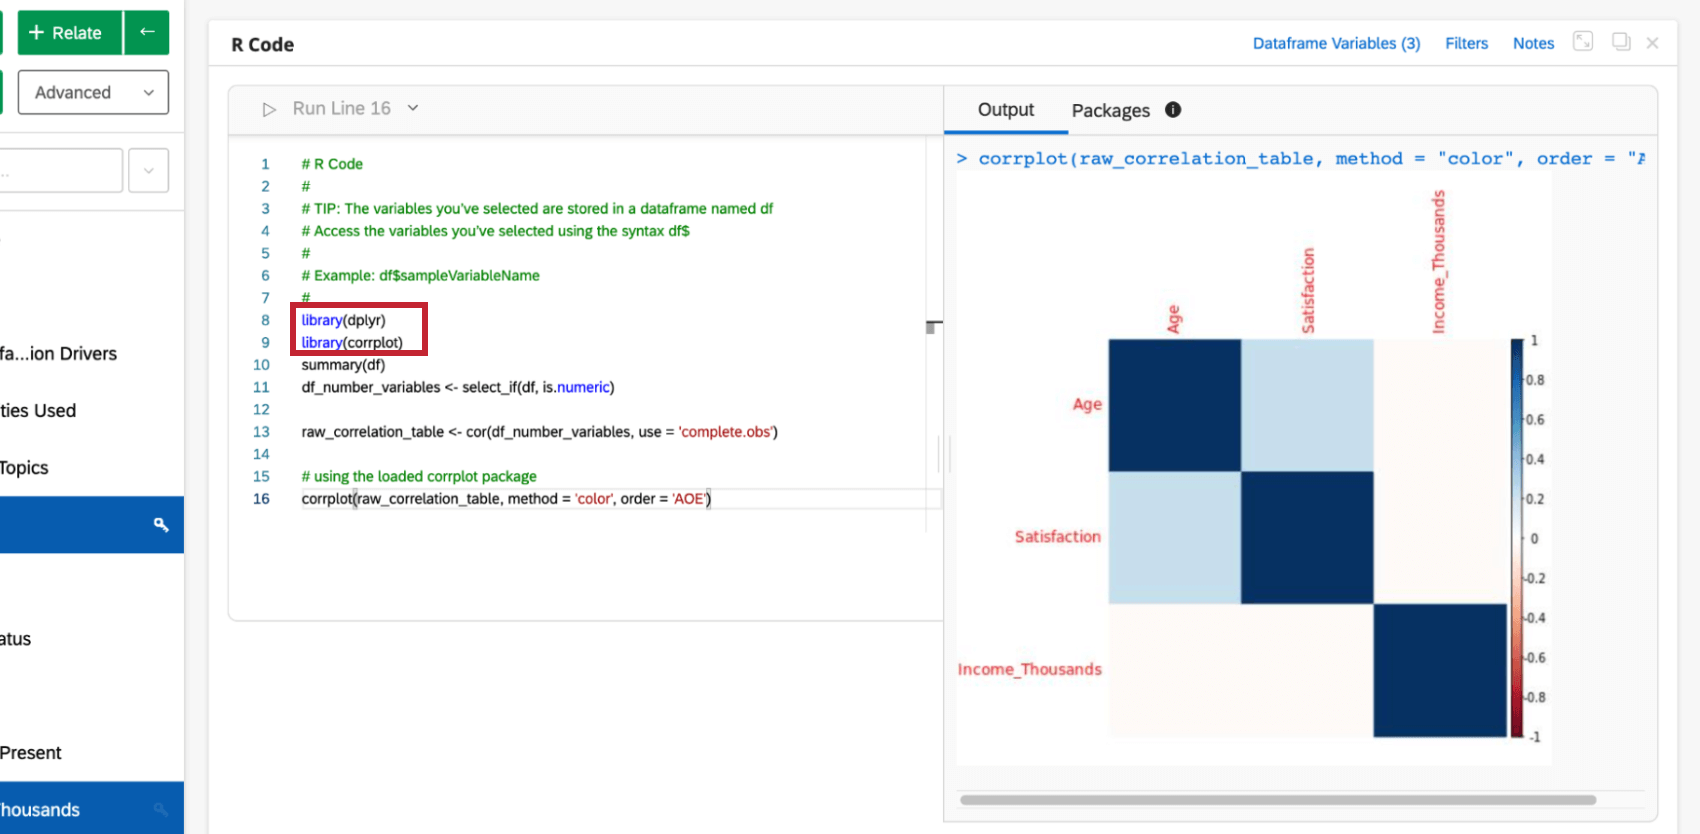
Requesting New Packages
You can request that R code packages be added to Stats iQ if you cannot find them in the list of available packages. When searching in the Packages tab, if no matches are found, you will see an option to request new packages.
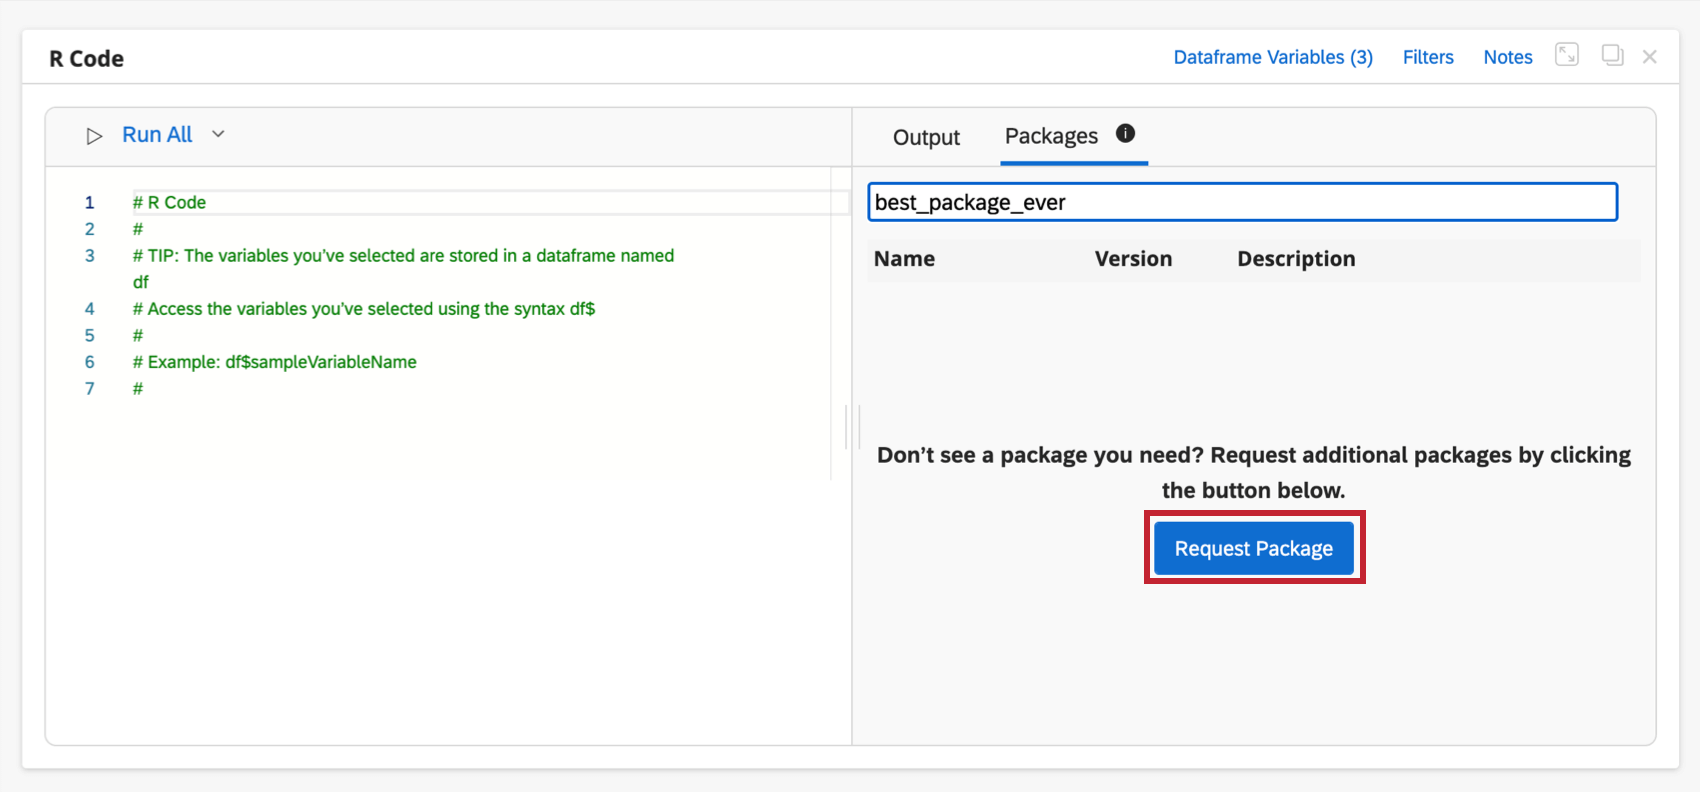
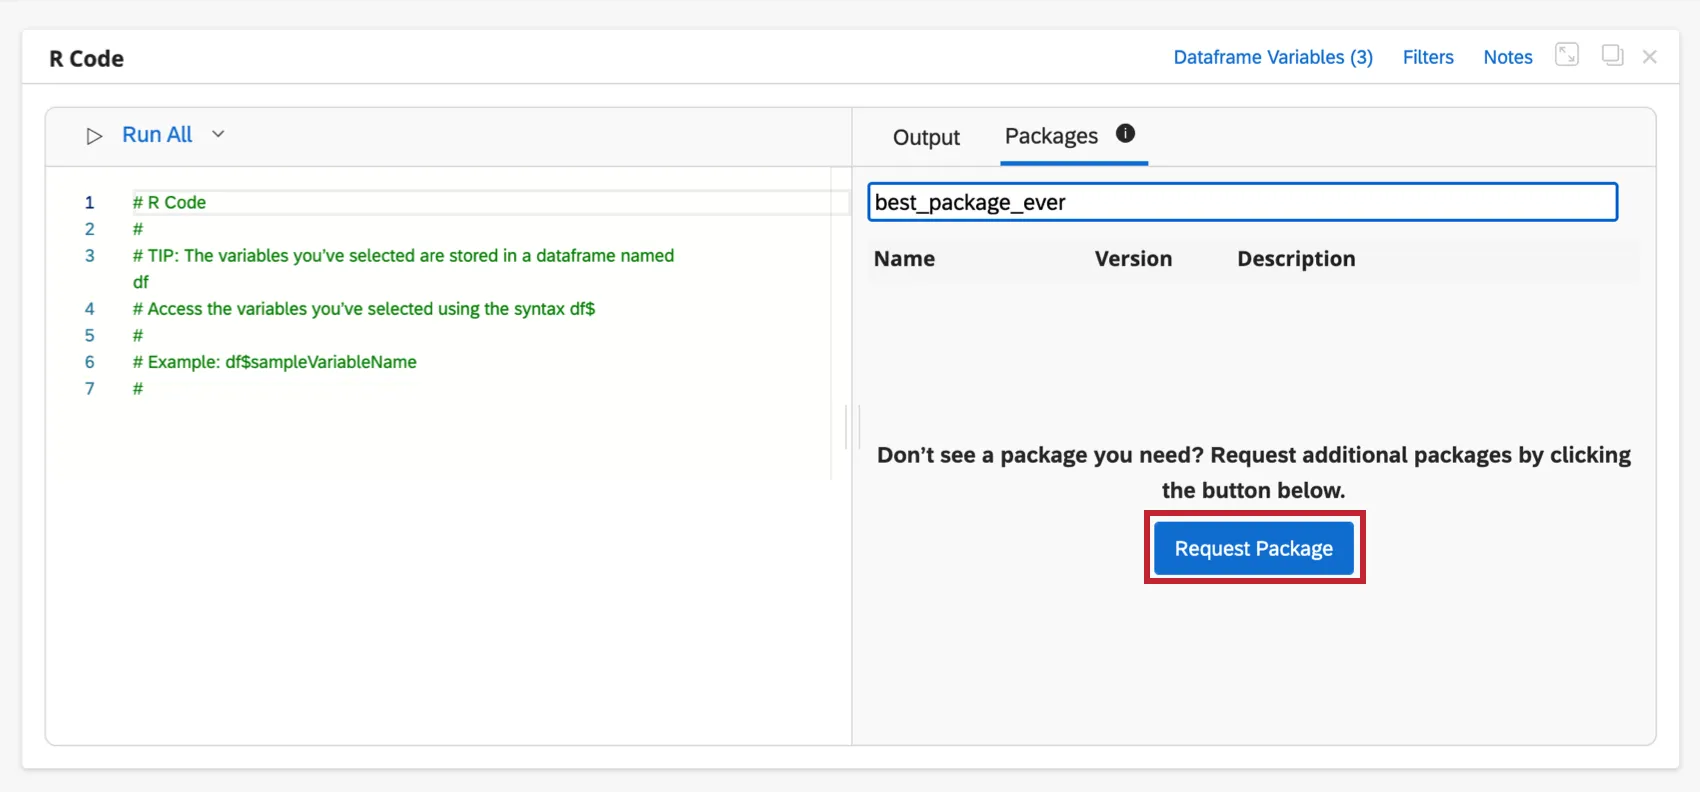
Clicking the Request Package button will take you to a quick survey where you can enter details about the packages you would like to utilize.
Attention: Package requests may take several business days to review and complete. Qualtrics may reach out to you if any clarification is needed regarding specific packages. Please do not submit package requests to Qualtrics through any other communication channel but the Request Package button inside the product.
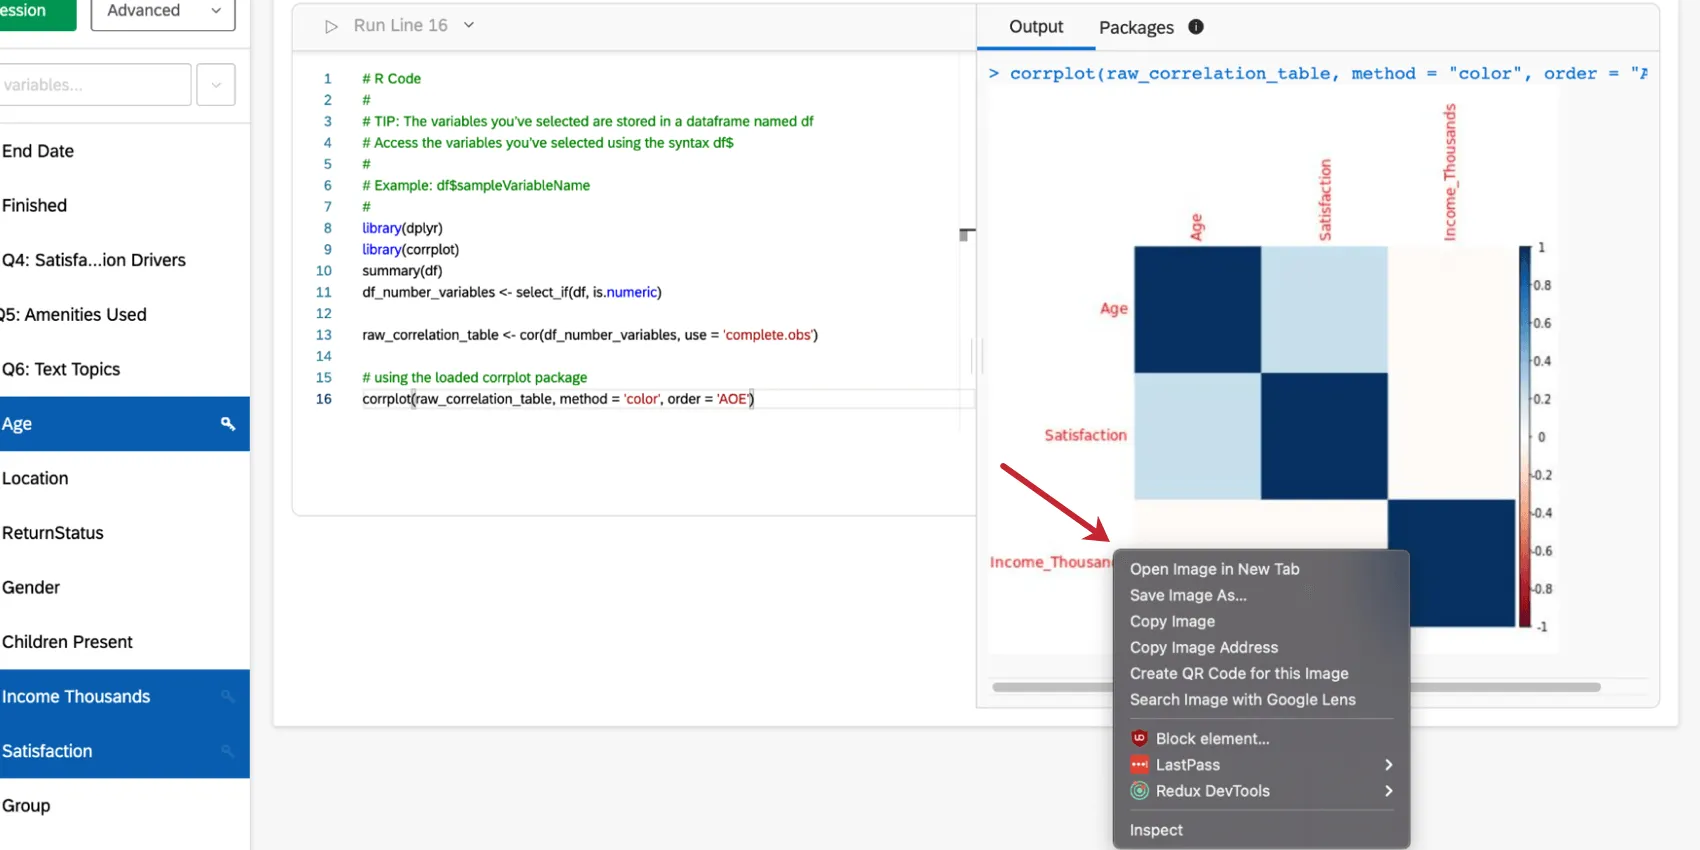
Downloading Generated Plots and Images
Any plots or images that you generate with your code can be downloaded very easily. Simply scroll to the specific plot or image and right click on the image to see copy or save options.
Incompatible R Commands
The view command is incompatible with R Code Cards.
Attention: Compatible R commands may change over time.
FAQs
How do I get my new responses to show up in Stats iQ?
How do I get my new responses to show up in Stats iQ?
What do I do if my data isn't loading properly?
What do I do if my data isn't loading properly?
That's great! Thank you for your feedback!
Thank you for your feedback!