
Time Between Ticket Statuses
What's on this page
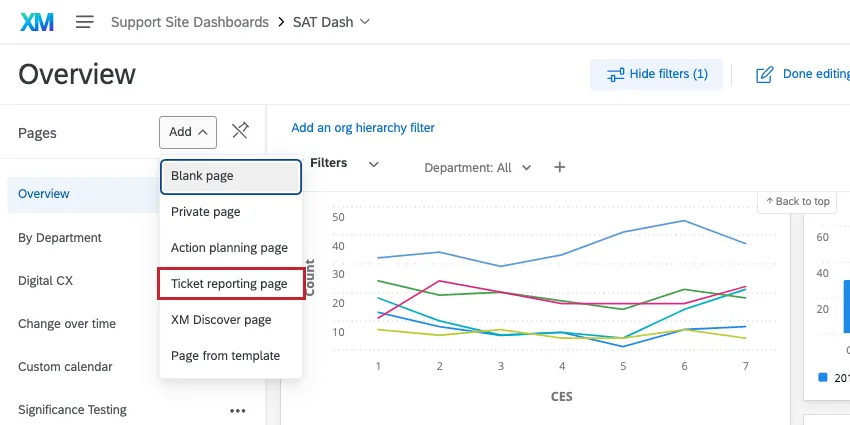
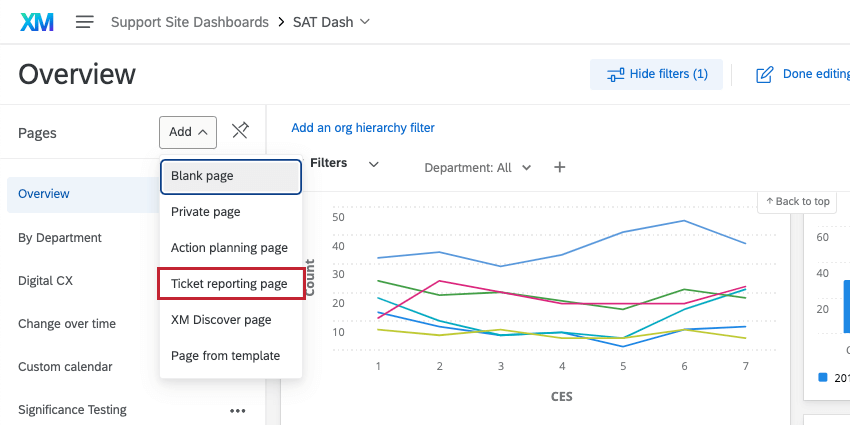
About Reporting Time Between Ticket Statuses
The longer a call center representative ignores a ticket, the longer the customer goes without a solution, and the more likely that the customers will be (justifiably) upset. Therefore, it can be incredibly important to a close-the-loop program that there are report-outs on the time taken to resolve a ticket. In Qualtrics, you can report on the time between various ticket statuses, gaining insight into the time it takes your team to take action on or resolve issues.
Qtip: Reporting the time between ticket statuses is a feature of Ticket Reporting.
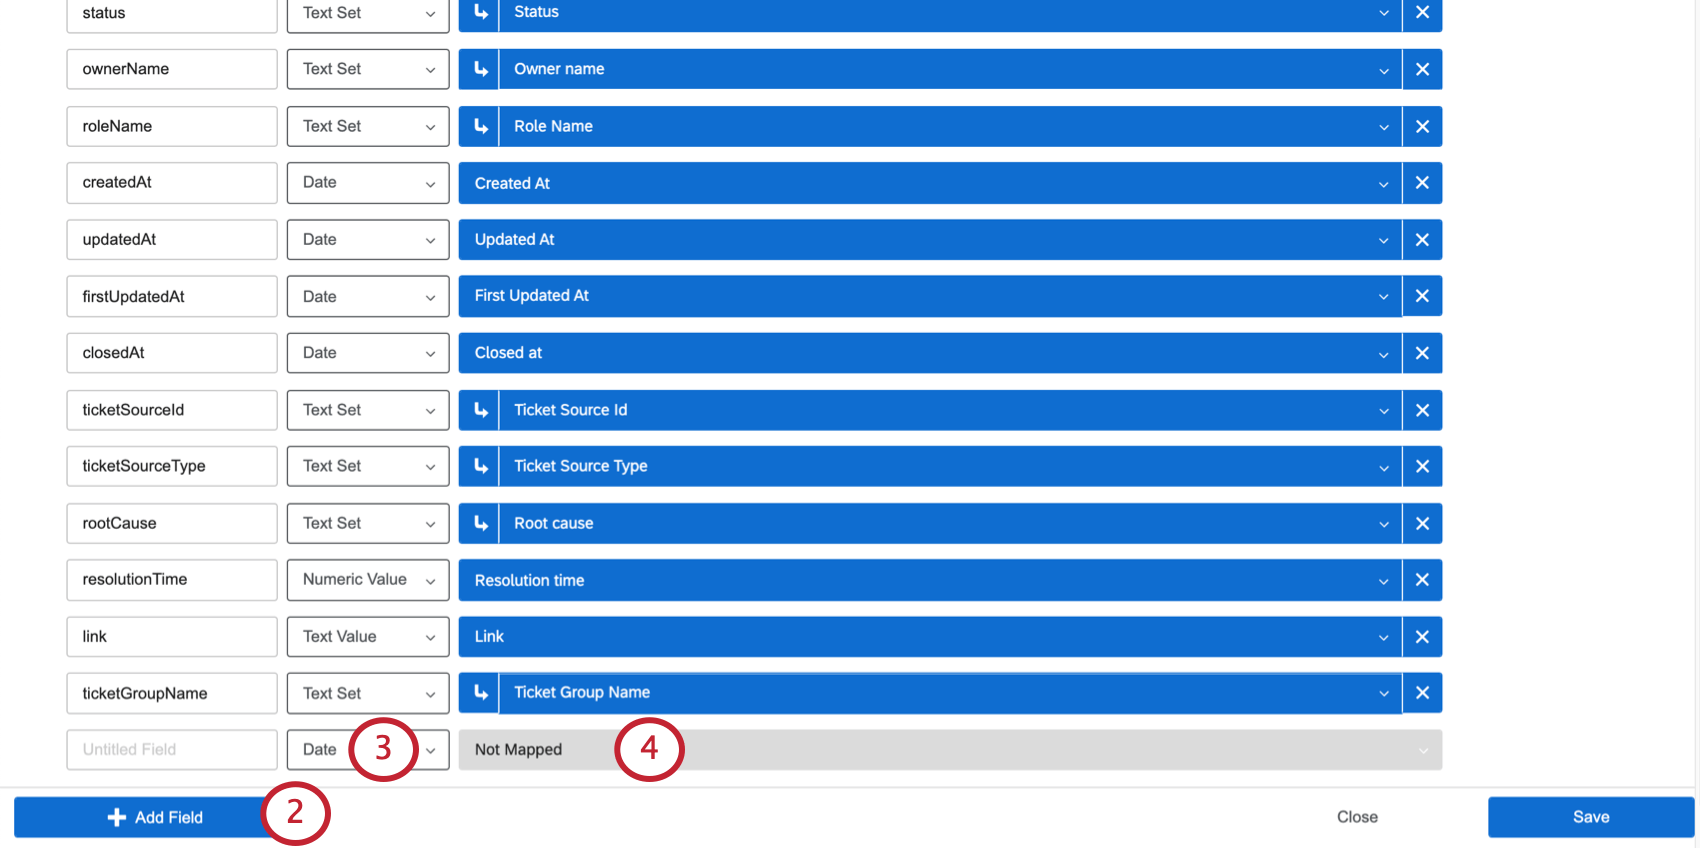
Mapping Additional Date Fields
In order to calculate the time between ticket statuses, Qualtrics calculates the differences between two date fields. By default, ticket data will map when tickets are closed, most recently updated, created, or first updated. However, you may want to map more date fields than this. For example, you may have custom statuses to indicate escalations, and want to track the length of time tickets generally spend marked under this status to get an idea of how long escalations take compared to the average ticket.
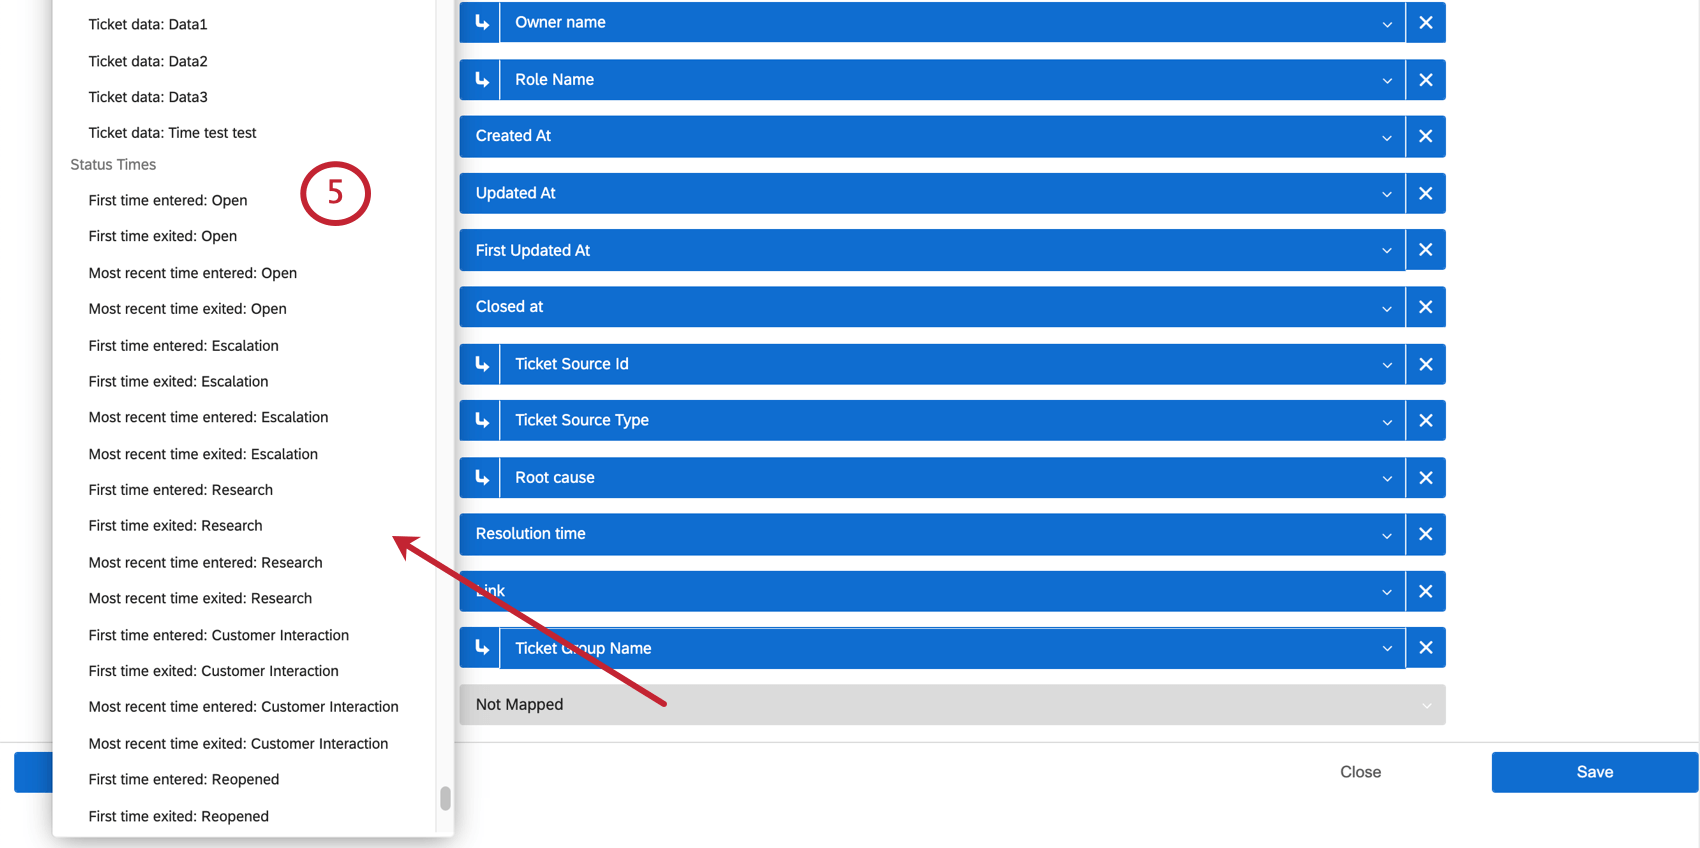
Mapping Status Times
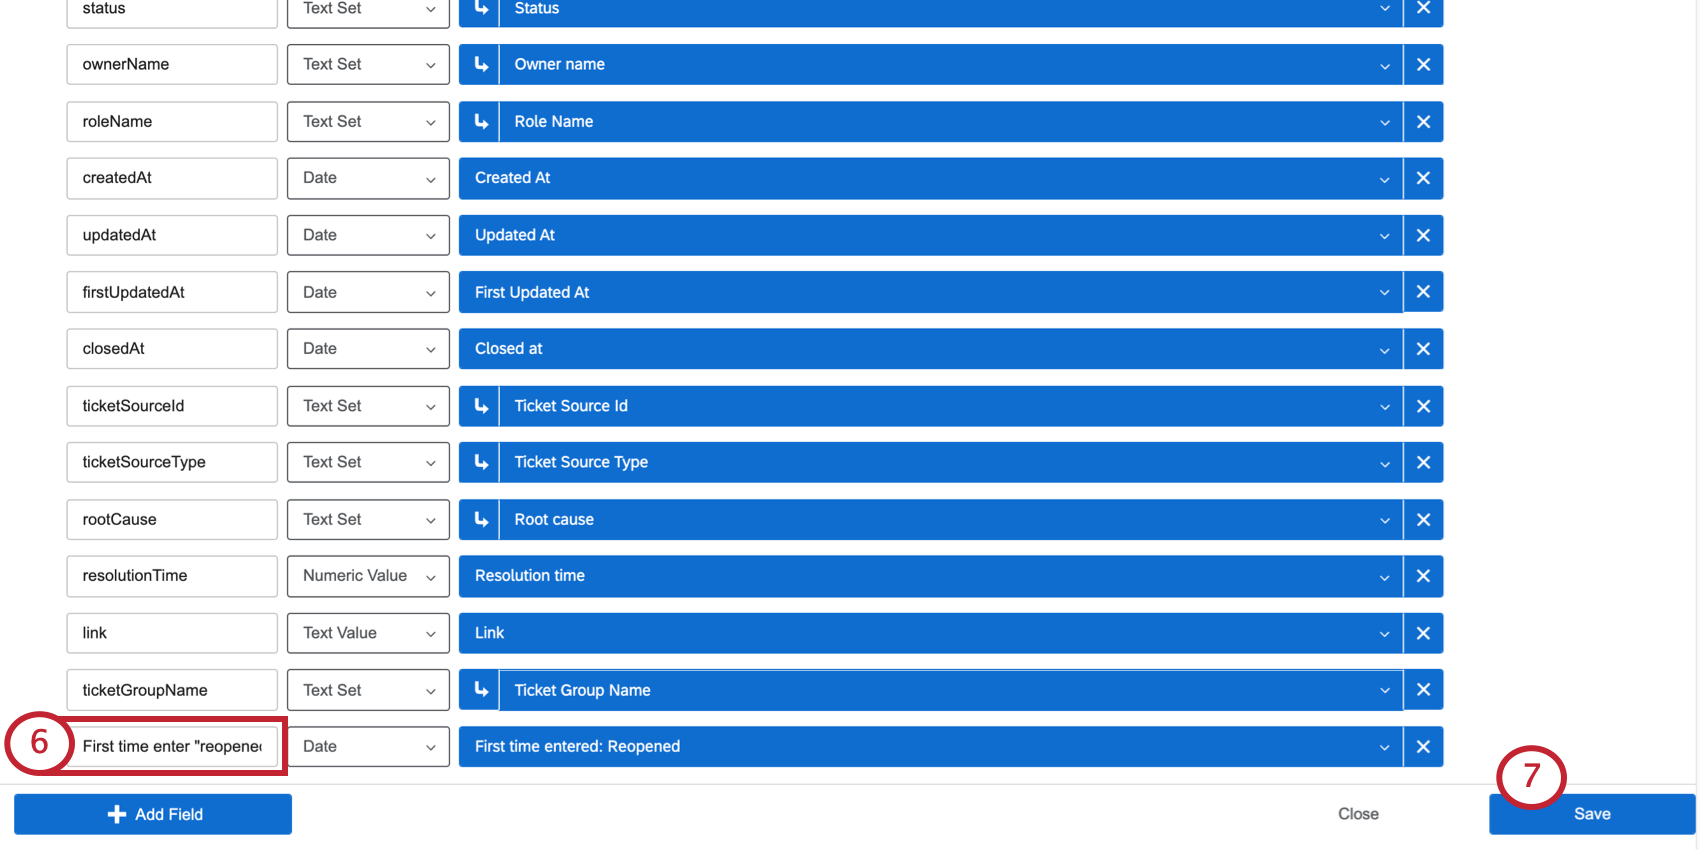
Meaning of Status Times
Each status comes with the same options of what times can be mapped. Below, we will explain what these times mean and how they can be used in a date calculation.
- First time entered: The first time a ticket was set to this status. Example: Your organization allows ticket owners to re-open old tickets if a customer calls back about the same issue. This means a ticket can have a status of Open multiple times in its existence. However, there are times where you are probably only interested in knowing the first time a ticket was opened. Then you would use the First time entered: Open

- First time exited: The first time a ticket that previously had this status was switched to another status. Example: Your organization has a custom status called “Escalation.” You want to keep track of when tickets are de-escalated, meaning when they are switched away from the status of “Escalation.” However, tickets can be escalated multiple times, and you are only interested in how long it takes for them to be de-escalated for the first time. You could use the First time exited: Escalation field to calculate this change.
- Most recent time entered: The most recent time this status was applied. Example: Unlike in previous examples, “most recent” fields will ignore if a status has been applied multiple times, and instead focuses on the most recent data. So a ticket may be “Open” when it’s first created and then later reopened; Most recent time entered: Open would reflect the second time this ticket was opened.
- Most recent time exited: The most recent time this status was removed from a ticket.
Attention: Only changes made after June 14, 2019 are recorded. Calculations including times before this date may not work. (This rule only applies to Status Times, such as First time entered, First time exited, Most recent time entered, and Most recent time exited fields. Additional fields, such as CreatedAt, ClosedAt, etc. are not impacted.)
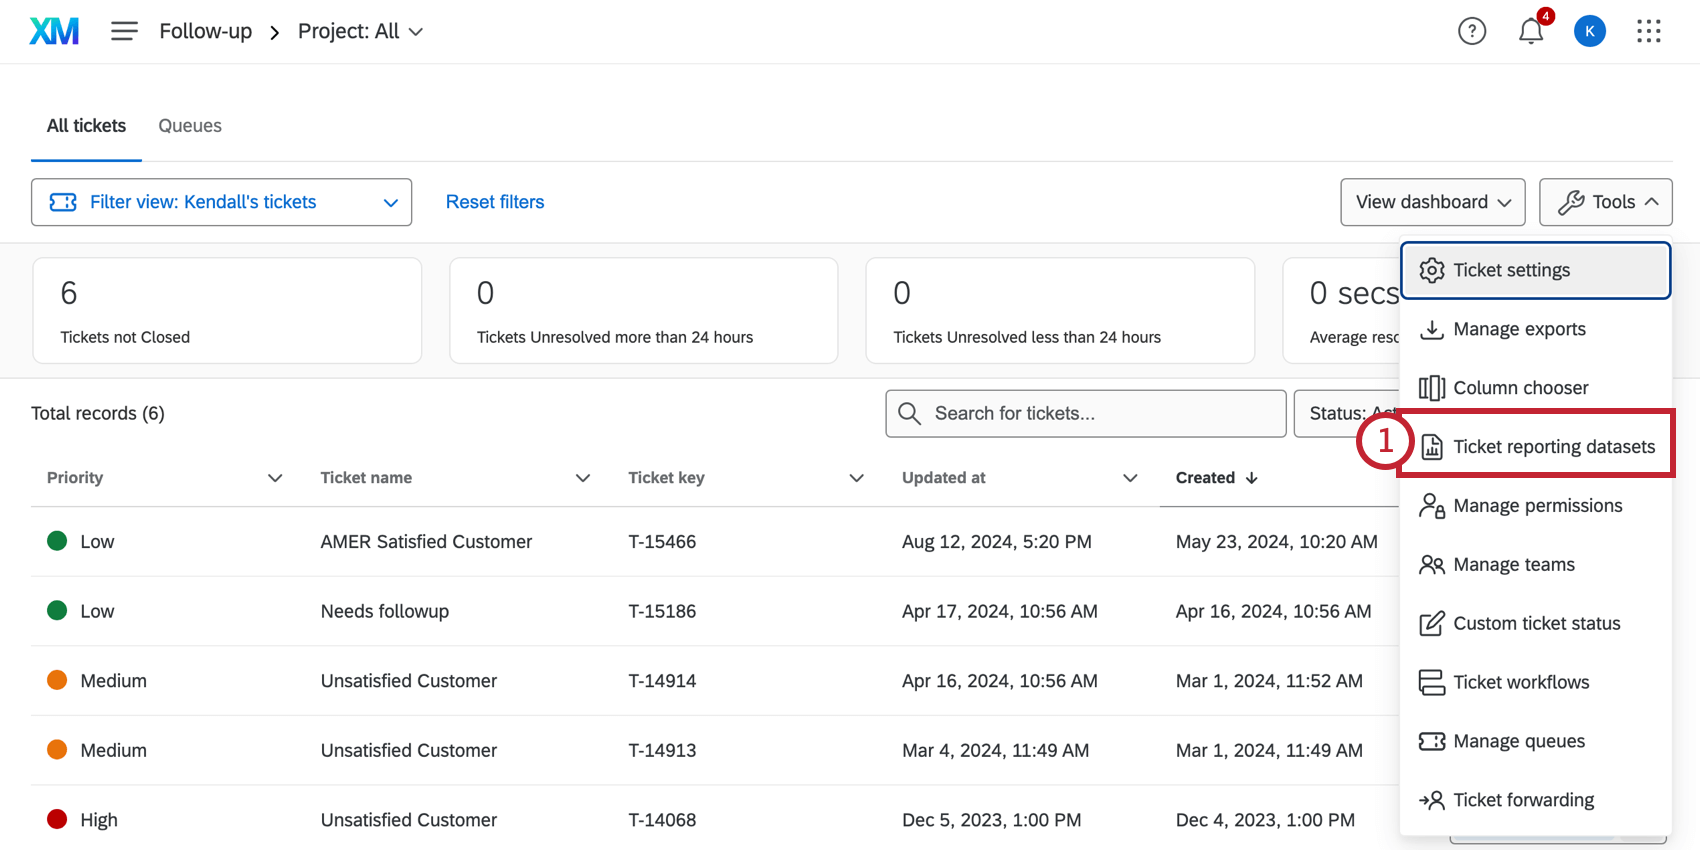
Setting Up Time Between Ticket Statuses
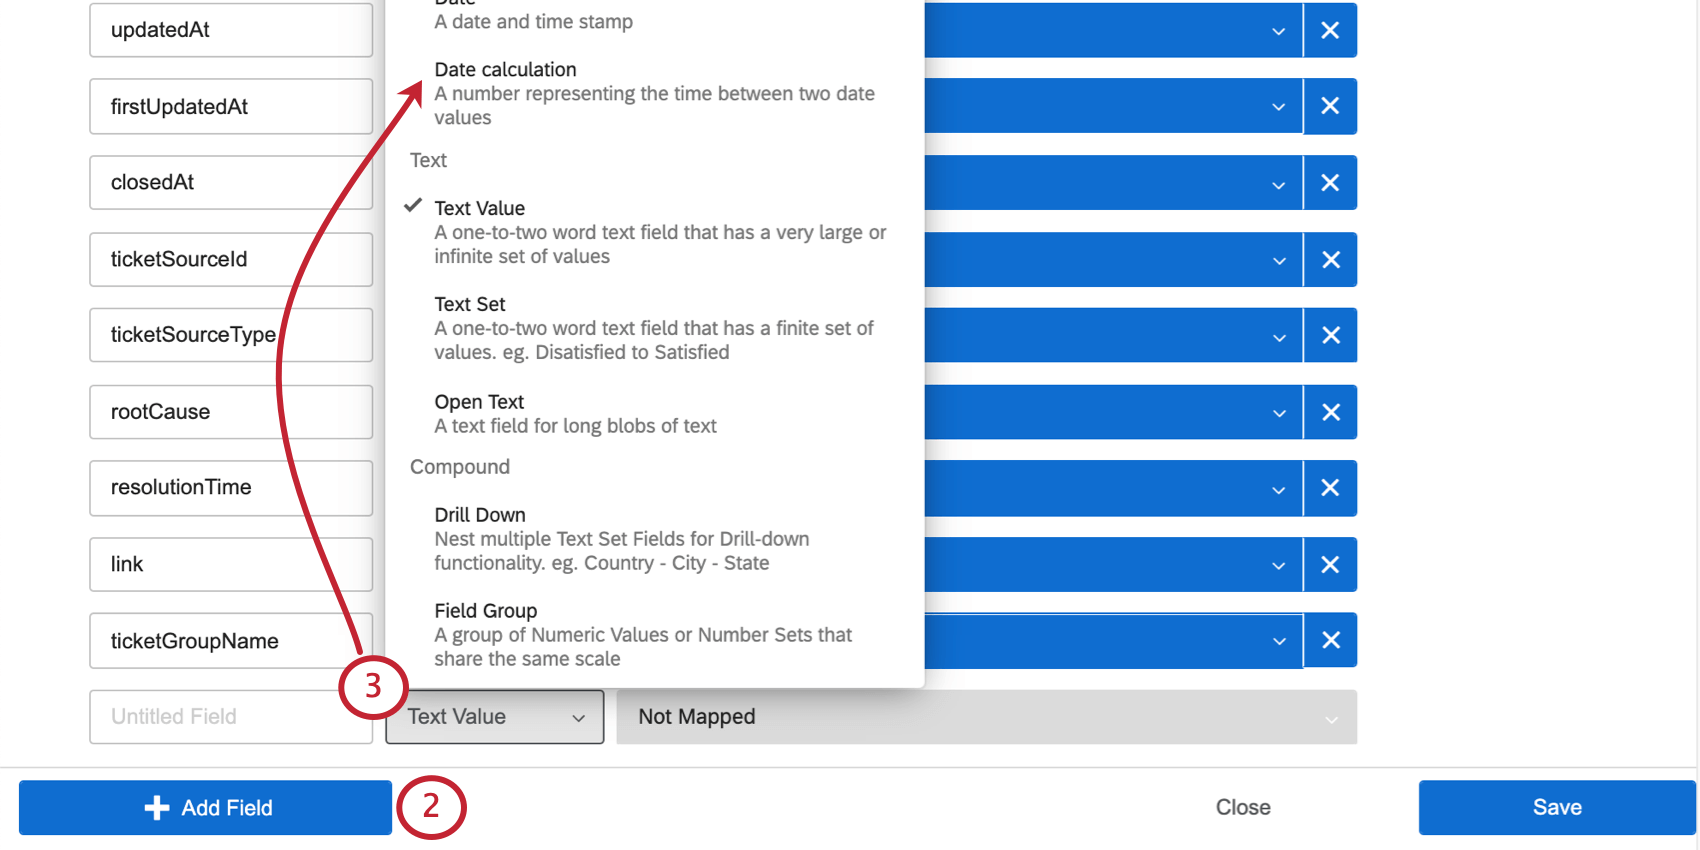
- createdAt: The date the ticket was first created.
- updatedAt: The date the ticket was last updated. Updates include any change made to the ticket, from reassignment, to status changes, to comments added.
- firstUpdatedAt: The date the ticket was first updated. Updates include any change made to the ticket, from reassignment, to status changes, to comments added.
- closedAt: The date the ticket was closed.
- Any additional date fields you chose to map.
- createdAt: The date the ticket was first created.
- updatedAt: The date the ticket was last updated. Updates include any change made to the ticket, from reassignment, to status changes, to comments added.
- firstUpdatedAt: The date the ticket was first updated. Updates include any change made to the ticket, from reassignment, to status changes, to comments added.
- closedAt: The date the ticket was closed.
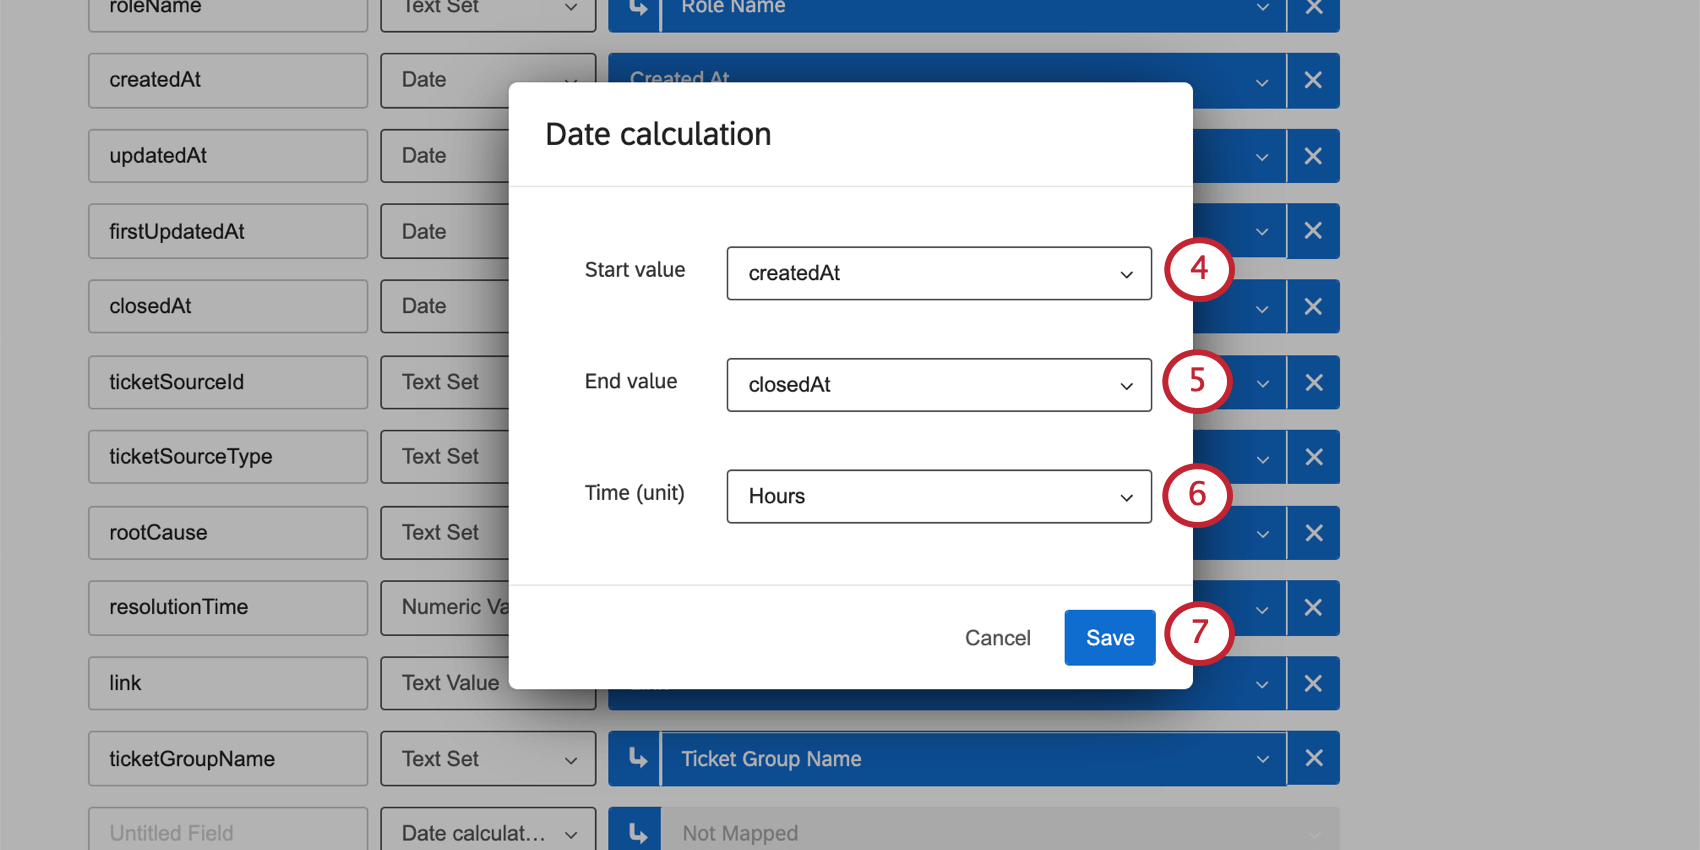
- Any additional date fields you chose to map. Qtip: Date calculations cannot be negative and will be displayed as N/A if so. Therefore, the chosen End value must not begin chronologically before the Start value.
 Example: Tickets must be created before they are closed, so createdAt makes a good Start value, while closedAt makes a better End value.
- Seconds
- Minutes
- Hours
- Days
- Weeks
Qtip: You can edit an existing date calculation by clicking the recode button on the field.

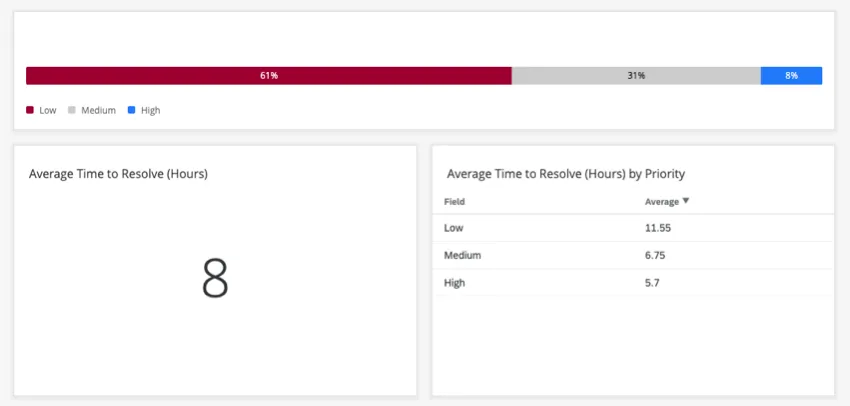
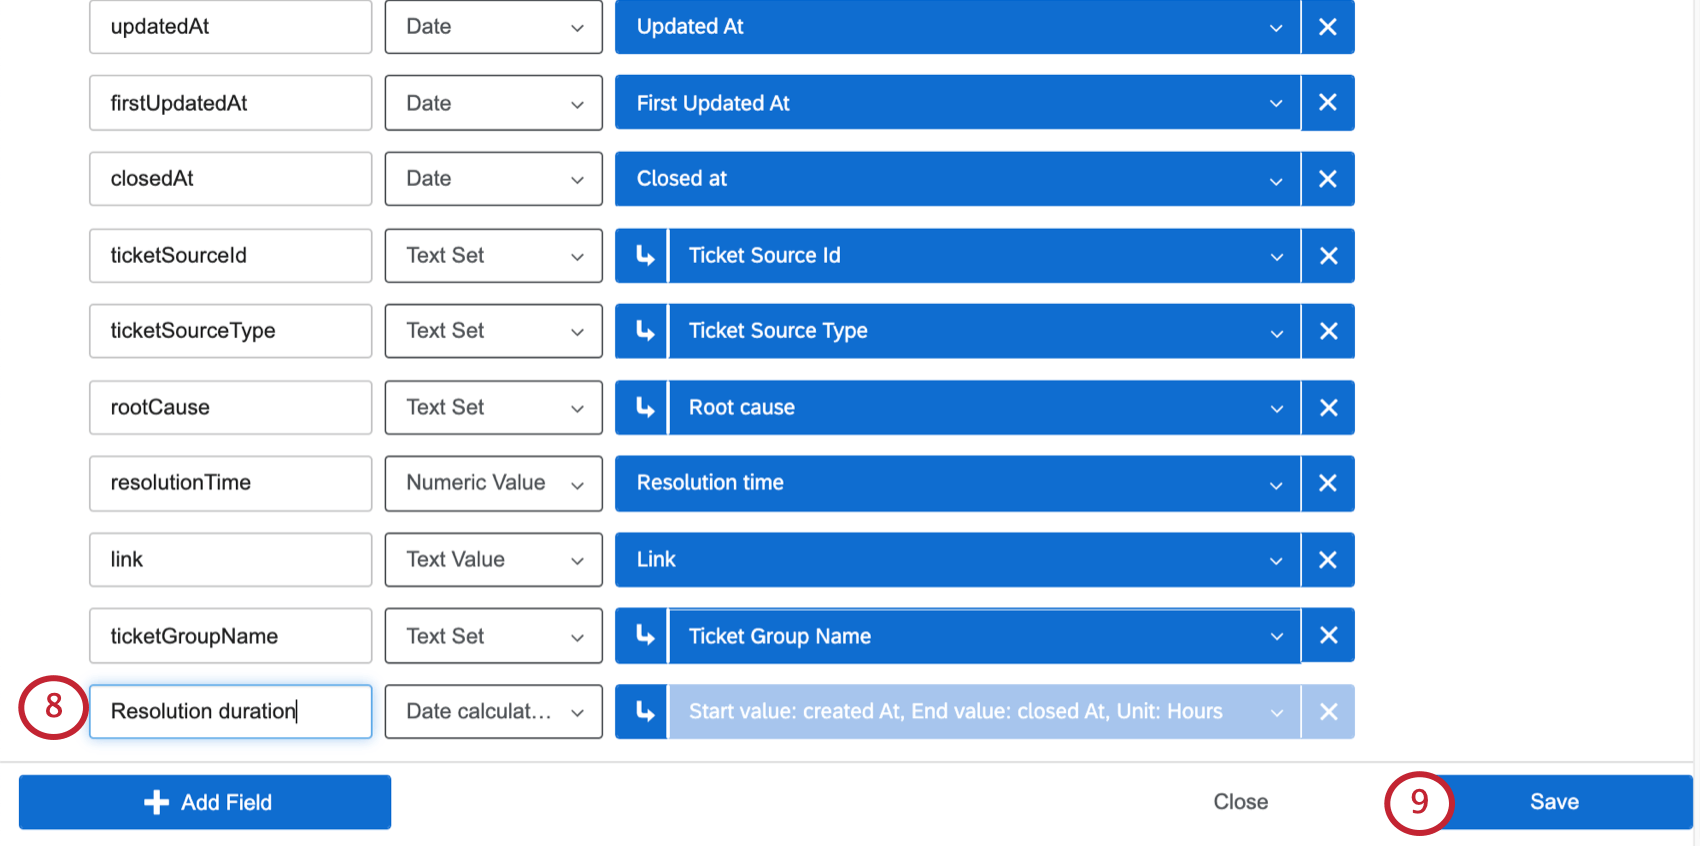
Qtip: Resolution time is a field included in ticket reporting by default. It displays the time in minutes between when the ticket was created and when its status was changed to “Closed.” This field is measured in minutes, but you can create a similar field that reports in a different time unit by using the following settings in a Date calculation:
- Start value: createdAt
- End Value: closedAt
- Time (unit): Seconds, hours, days, or weeks
Compatible Widgets
Date calculations are compatible with the same widgets and fields that are compatible with Numeric Value field types.
This means Date calculations can be used as:
- Filters on metrics
- Average (metric)
- Minimum / maximum (metric)
- Sum (metric)
- Net Promoter Score (metric)
- Correlation (metric)
- Top / bottom box (metric)
- Record grid columns
- Key driver (Outcome metric)
- Key driver (Potential drivers)
- Scatter plot (X/Y axis)
- Trend chart (Field)
- Breakdown table (Source)
- Multiple source table (Source)
- Response ticker (Ticker value)
Qtip: Remember that all widgets meant to report on time between ticket statuses must be added to a ticket reporting page.
Common Use Cases
Being able to calculate the time between ticket statuses means you can improve reporting on how your organization uses tickets, allowing you to spot weakness and make improvements to your close-the-loop program. In this section, we go over some of the most common uses of this feature and how to implement them.
Calculating Time Spent in a Status
Information about how long a ticket spends in a certain status can help your organization identify where there may be operational inefficiencies.
For example, let’s say you want to report on the average time spent in each ticket status. We’ll start with “Open” since it’s a common status and can signify the time spent working on a ticket.
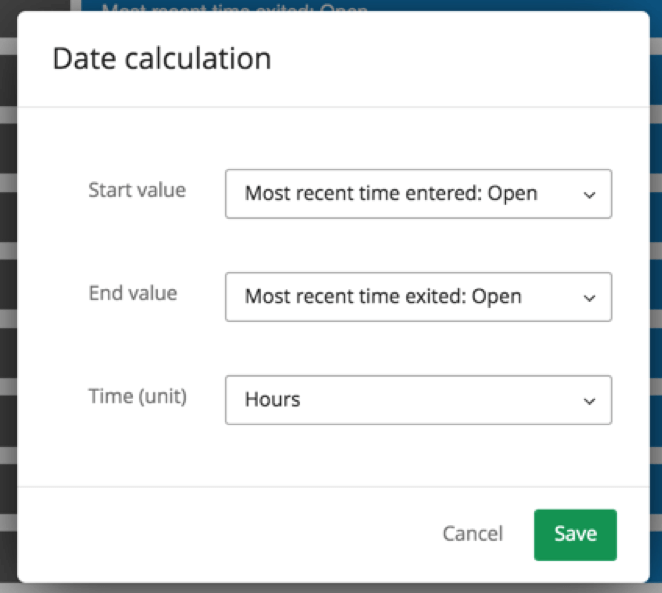
Example 1: Calculate the duration that tickets most recently spent open.

- Start value: Most recent time entered: Open
- End value: Most recent time exited: Open
Example 2: Calculate the duration of the first time tickets were open.
- Start value: First time entered: Open
- End value: First time exited: Open
Example 3: Calculate the duration that the ticket has been open across its lifetime. This includes if the ticket was reopened.
- Start value: First time entered: Open
- End value: Most recent time exited: Open
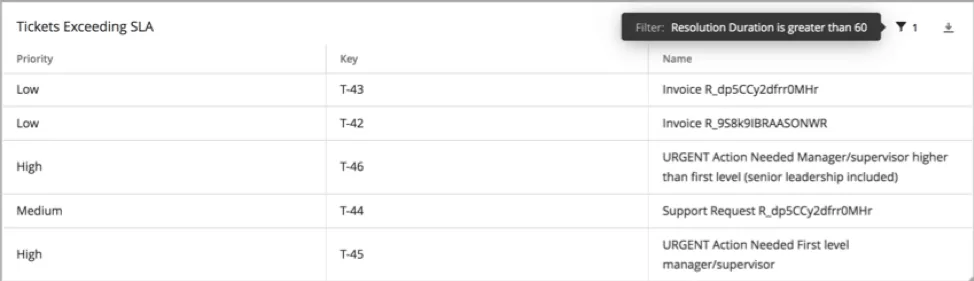
Tracking Service-Level Agreement (SLA)
Being able to view the tickets that have spent longer than the defined SLA in a specific ticket status can ensure that those tickets are prioritized immediately.
Example: First, let’s calculate the time a ticket takes to resolve. This can be time spent in a particular status (like Open), the difference between when a ticket was opened and when it was closed, and so on. Every organization is different, but in this example, we will use the following:
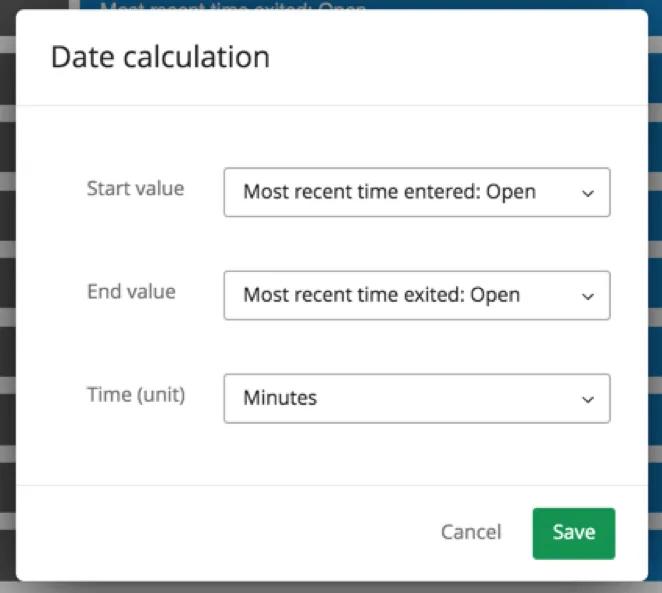
- Start value: Most recent time entered: Open
- End value: Most recent time exited: Open
Adjust the Time (unit) to how you measure the cutoff for your SLA. In this case, our example SLA is 60 minutes, so we’ll set the time to minutes.
You can then filter a widget or a page by this field to narrow the results so that only tickets violating SLA will appear. Here, we used an advanced filter on our record grid, because you can specify that a value must be greater than or equal to a certain amount, and we only want to see tickets that’s been opened for more than 60 minutes.
That's great! Thank you for your feedback!
Thank you for your feedback!