
Displaying Total Volume on Widgets (Studio)
Suite
Customer Experience
Product
Qualtrics
What's on this page
About Displaying Total Volume on Widgets
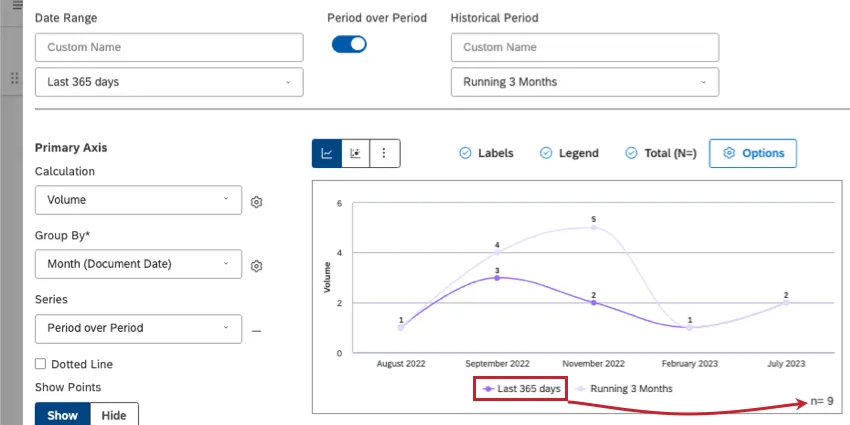
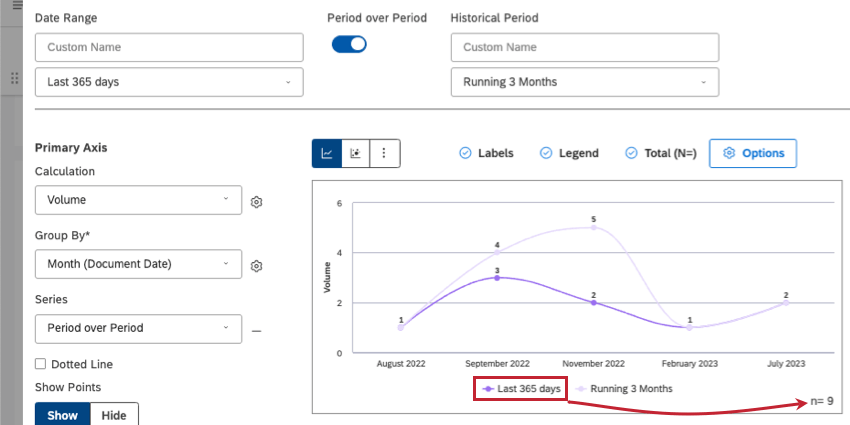
In the bottom corner of some widgets, you’ll see volume represented as n = total. This value is the total number of documents that match the dashboard’s filters.
Qtip: In period over period reporting, the total only covers the current period.
Qtip: For discrepancies in volume on a widget displaying sentiment, see Grouping Widget Data by Sentiment.
Displaying Total Volume in Widgets
Qtip: You can also decide whether or not total volume is displayed on all new dashboard widgets by default. See the Dashboard Properties page for more information.
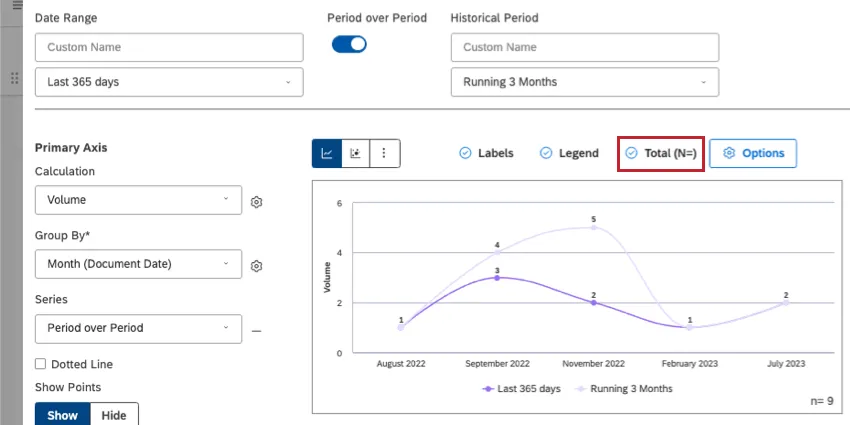
When you edit a widget, you can enable the total volume by clicking Total (N=).
That's great! Thank you for your feedback!
Thank you for your feedback!