
Dashboard Properties (Studio)
What's on this page
About Dashboard Properties
Dashboard properties define the dashboard’s title, description, owner, content provider, and personalization settings.
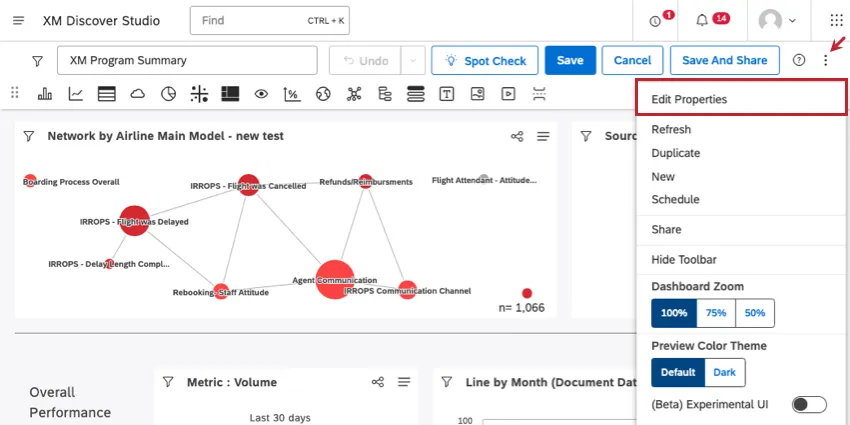
To edit your dashboard’s properties, click the dropdown and select Edit Properties.
Configure Dashboard
In the Configure dashboard section, you’ll find the following settings:
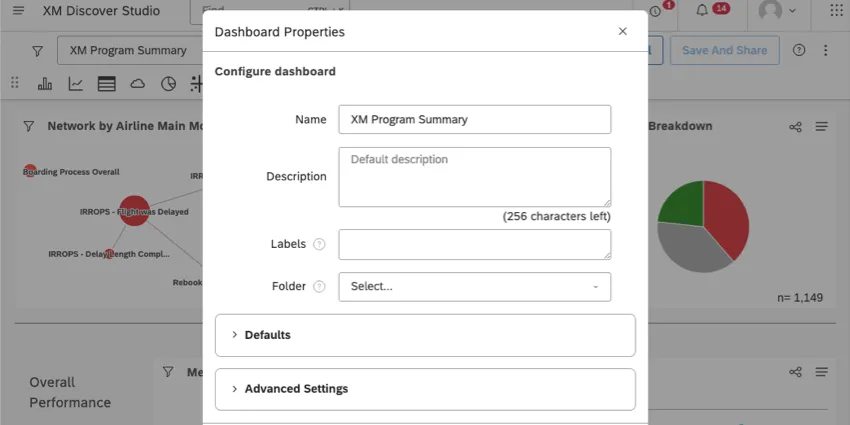
Name: Provide a unique name for your dashboard.

Qtip: The dashboard name must be unique when compared to all other dashboards in your organization. For example, you and another user cannot both name your dashboard “Executive Dashboard.” Studio will warn you if you try to use a name that is taken.
- Description: Provide a brief description of your dashboard’s purpose. (Optional.)
- Labels: Add or delete dashboard labels. (Optional.)
- Folder: Add your dashboard to a folder. (Optional.)
Defaults
You can set various default properties for new widgets created on this dashboard. You can edit dashboard properties any time, but existing dashboard widgets will not be affected.
- Content Provider: If you have access to more than one content provider, you’ll see this option. Set the content provider the dashboard data should come from.
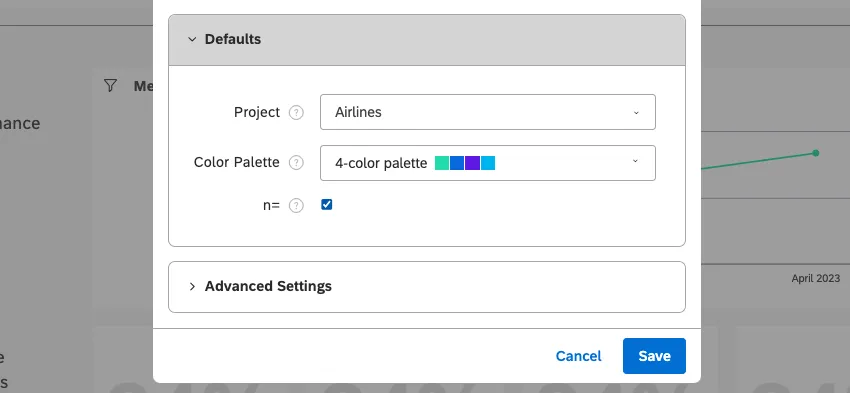
Project: The default Designer project that data should come from when you create new widgets in a blank dashboard.

Example: We set our default project to our “Bakeries” project. When we make a new bar chart, it’s already set to the “Bakeries” project. We can also change it for individual widgets as needed.
- Color Palette: Choose a default color palette for all reporting widgets that will be added to this dashboard in the future.
n=: Choose whether to show the number of data points by default for new widgets created in this dashboard. When selected, new widgets will show volume by default.
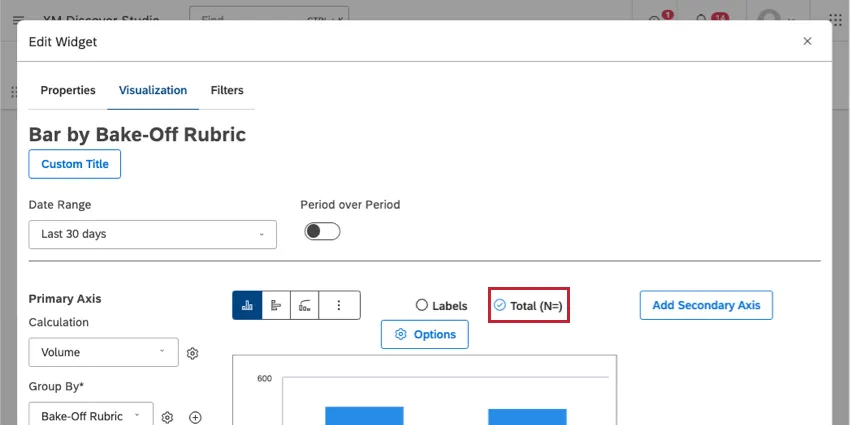
Qtip: We have n= enabled in our dashboard properties. When we create a new widget, the Total (N=) is already selected.
Advanced Settings
Dashboard properties include the following advanced settings:
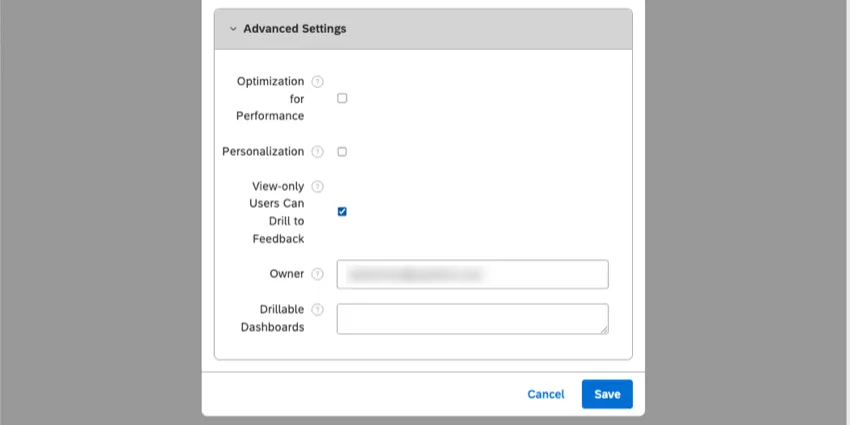
- Optimization for Performance: See Dashboard Optimization.
Personalization: Select this check box to enable personalization and select the organization hierarchy to use from the drop-down list that appears. When personalization is disabled, the dashboard shows the same data to all users.
Qtip: The list of available organization hierarchies is filtered to only include the organization hierarchies that are relevant to the default project.
- Organization Context: This option appears only if you have Personalization Select this check box to allow users to see (but not access) the entire organization hierarchy in dashboard filters, regardless of their position within it.
- View-only Users Can Drill to Feedback: Limit what users with view-only access can see in the dashboard.
- If selected (default setting), users with view-only access to this dashboard and the Drill to Feedback in View Mode permission can drill into feedback using document explorer or the feedback widget.
If not selected, users with view-only access cannot drilling into feedback.

Attention: This setting overrides users’ Drill to Feedback in View Mode.
- Indicate User Placement: This option is only available if you are using peer and parent reporting. Select this option to show the viewer’s position in the organization hierarchy using a color you select here. Other levels will be displayed in lighter hues of the same color.
- Owner: This is the user who has full control over the dashboard. You can transfer your dashboard to another user. See Transferring Dashboards and Books for details. Only a dashboard owner can do the following:
- Share a dashboard.
- Schedule dashboard actions.
Qtip: Copying (duplicating) a dashboard does not copy its ownership. That is, if Paul copies a dashboard created by John, the new dashboard will be owned by Paul.
- Drillable Dashboards: See Drillable Dashboards.
Dashboard Optimization
With dashboard optimization, you can improve the performance of reports that use Natural Language Processing (NLP) aggregations by sacrificing their precision. This affects Topics and any NLP-based groupings, like Words and enrichment attributes. Aggregated numeric values such as averages, sums, and volume will have their value approximated in order to optimize dashboard performance.
To enable dashboard optimization, select the Optimization for Performance check box in dashboard properties.
Qtip: We recommend disabling Optimization for Performance to prioritize metric accuracy. We only recommend enabling this setting if your project size or request complexity results in slow widget performance.
When optimization for performance is enabled
For NLP-based groupings, numeric calculations for metrics with less than 11 distinct values (i.e. OSAT, NPS, etc.) are performed using an estimated weighted average or sum. Estimated results typically have a low margin of error.
Averages and sums for metrics with greater than 11 distinct values (i.e., call duration, cost, revenue, etc.) are performed at the sentence level and may generate skewed numbers compared to record-level stats based on the number of times a single record is duplicated in any one value of the NLP-based grouping.
When optimization for performance is disabled
Aggregations for NLP-based groupings are calculated with higher precision.
Qtip: You can decide whether Optimization for Performance is enabled or disabled for new dashboards by default in your account properties.
That's great! Thank you for your feedback!
Thank you for your feedback!