
Field Groups (CX)
What's on this page
About Field Groups
Field groups are a great way to group dashboard fields that go together conceptually. Generic groups act as a way to organize your data, whereas measure groups and drill downs let you add groups of fields onto a widget all at once.
Qtip: Field groups are for grouping several fields together. Field groups are not for grouping the values or choices of an individual field. Instead, see pages on recoding dashboard fields in the data mapper and in the data modeler.
Generic Groups
Generic groups are most useful if you want to organize your dashboard data and make it easier to find certain fields. All field types are compatible with the generic group.
Example: We want to group fields by demographics vs. key metrics for our own organizational purposes. We create a generic group for demographics and another for key metrics, and sort each field into one of those groups.
Qtip: Generic groups cannot be added to a widget the same way measure groups and drill downs can. Individual fields within a generic group can still be added to widgets on a one-by-one basis.
Measure Groups
Measure groups are fields that have a numeric scale in common. Fields in this group must be Number Sets or Numeric Values with the same number of scale points. When organizing fields into a measure group, you can add the measure group to a widget to add all the fields within it to a widget.
Example: We have 5 similar satisfaction questions we ask on a scale from 1 to 7. We create a measure group with each of these questions so we can add them to widgets all together.
Qtip: Measure groups are great for grouping different statements from the same matrix table together in dashboard widgets. Because each statement is from the same matrix, they have the same number of scale points. See Matrix Statements in a Single Widget for an example of how this can be used effectively in a dashboard.
Qtip: For help recoding the scales used in your chosen fields, see the Field Recode Values (CX) page.
Drill Downs
Drill downs allow you to organize and manage hierarchical information so that individuals can easily filter entire groups or subgroups without selecting dozens of options. For example, you can select all of the cities in California by selecting California at the state level rather than going through and selecting every city by hand. This flexibility makes it very easy to quickly compare 2 groups of data or dive deep into a group to see what your clients are saying.
Qtip: See an example of a real-world application of drill downs on the Drill Down Hierarchies for CX Dashboards support page.
Drill down fields need to have a Text Set or Multiple Answer Text Set field type.
Attention: Make sure to add fields nested inside the drill down in the order that individuals will be using them (e.g., Country, State, and then City). This also affects the order they appear in filters.
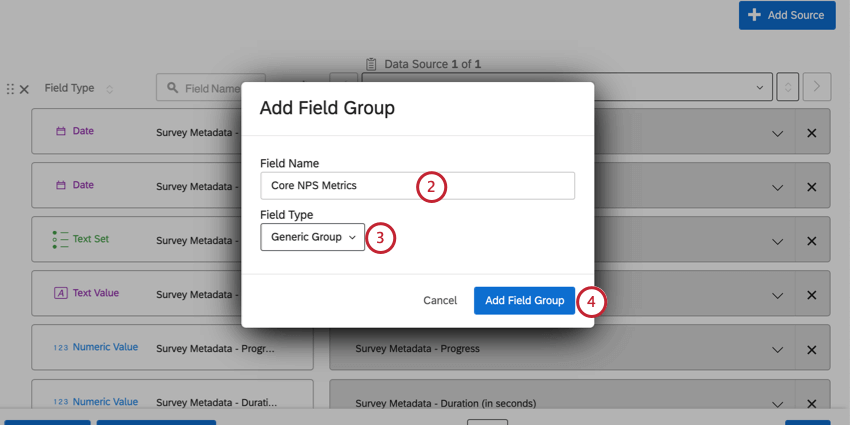
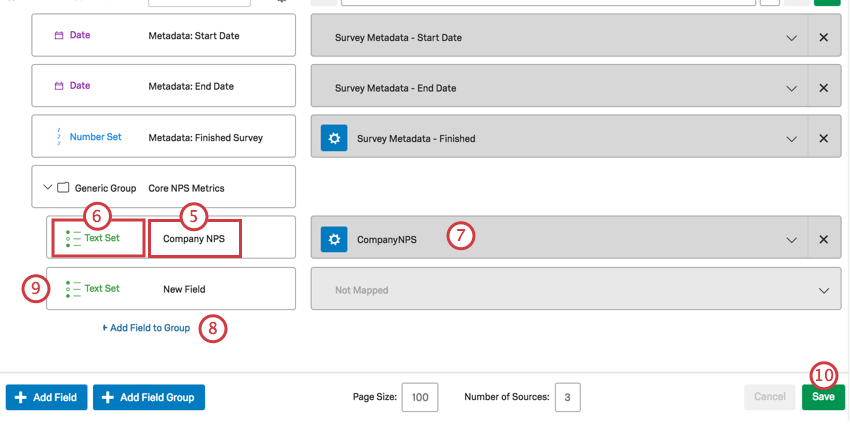
Creating Field Groups in a Data Mapper Dataset
Qtip: Fields cannot be dragged and dropped under field groups. You must add new fields beneath the groups.
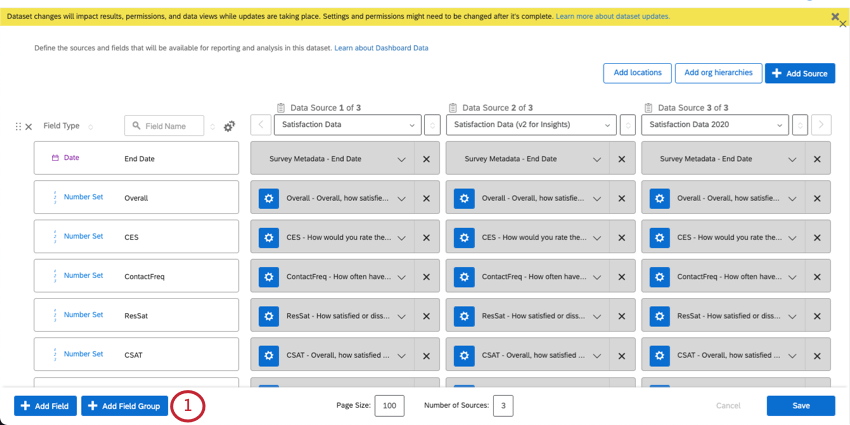
- Generic Group: Organize similar fields in your data mapper. You cannot use this group type to add fields to widgets, although you can still add each field individually.
- Measure Group: Group fields with similar numeric scales.
- Drill Down: Organize fields into a hierarchical structure.
Qtip: Compatible field types vary by group type. See linked sections on each group for more details.
Qtip: For questions like matrix tables, you can select Map All to automatically add all the statements beneath the field group.
Creating Field Groups in a Data Model
The data modeler can be used to create dashboard datasets by allowing you to flexibly combine data from multiple types of sources. Once you’ve finished setting up your data model, you add an output dataset. This output dataset contains a final list of all of the fields your data model will contain. Here, you can create field groups.
Click the output dataset.
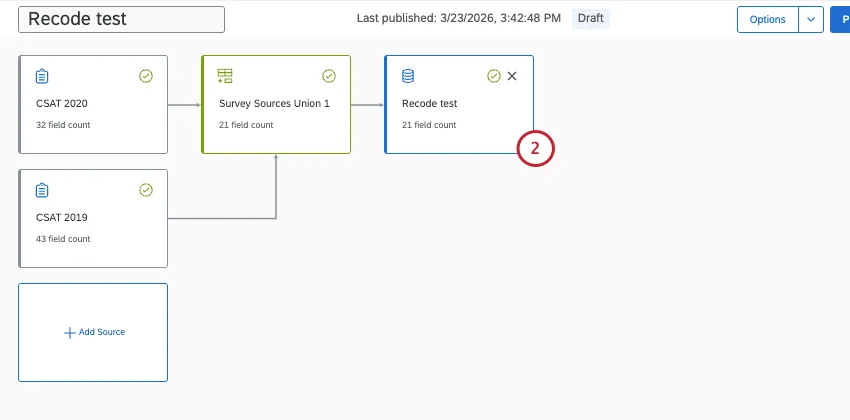
Select Dataset Editor.
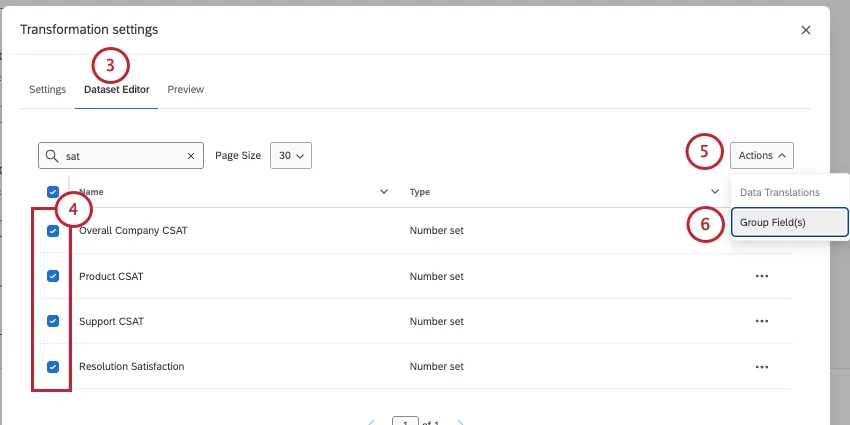
Select the fields you want to group together.
Qtip: It’s okay if you can’t select everything. You can add more fields later.
Click Actions.
Select Group Field(s).
Highlight the field group name to give it a new one.
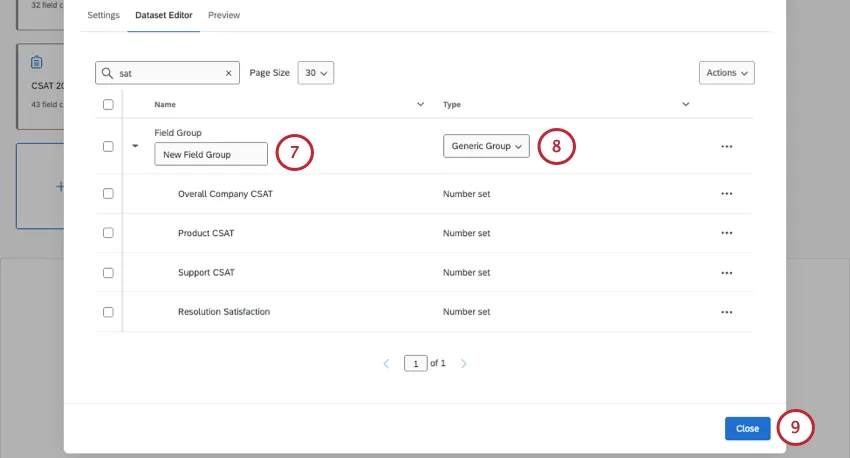
Change the group type:
- Generic Group: Organize similar fields in your data mapper. You cannot use this group type to add fields to widgets, although you can still add each field individually.
- Measure Group: Group fields with similar numeric scales.
- Drill Down: Organize fields into a hierarchical structure.
Close the field editor.
Publish your dataset to save your changes.
Editing Field Groups in a Data Model Dataset
Here are some tips on how to edit field groups created in a data model dataset.
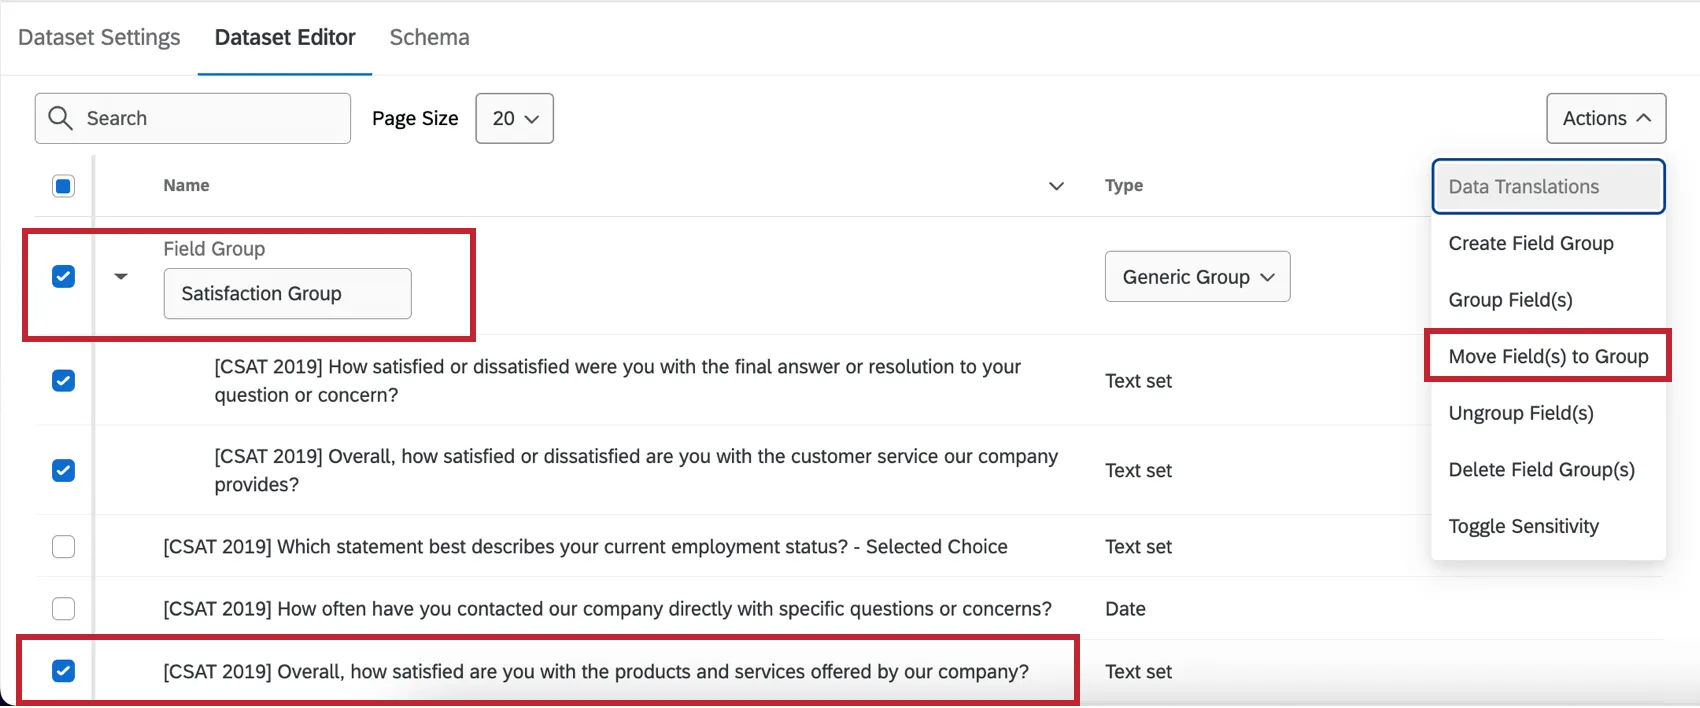
Moving Fields to an Existing Group
To move new fields to an existing group, select both the new field and the field group itself, then click Move Field(s) to Group.
Qtip: Having trouble getting your fields on the same page so you can group them together? Try giving the fields you want to group names with similar prefixes, then sort by field name.
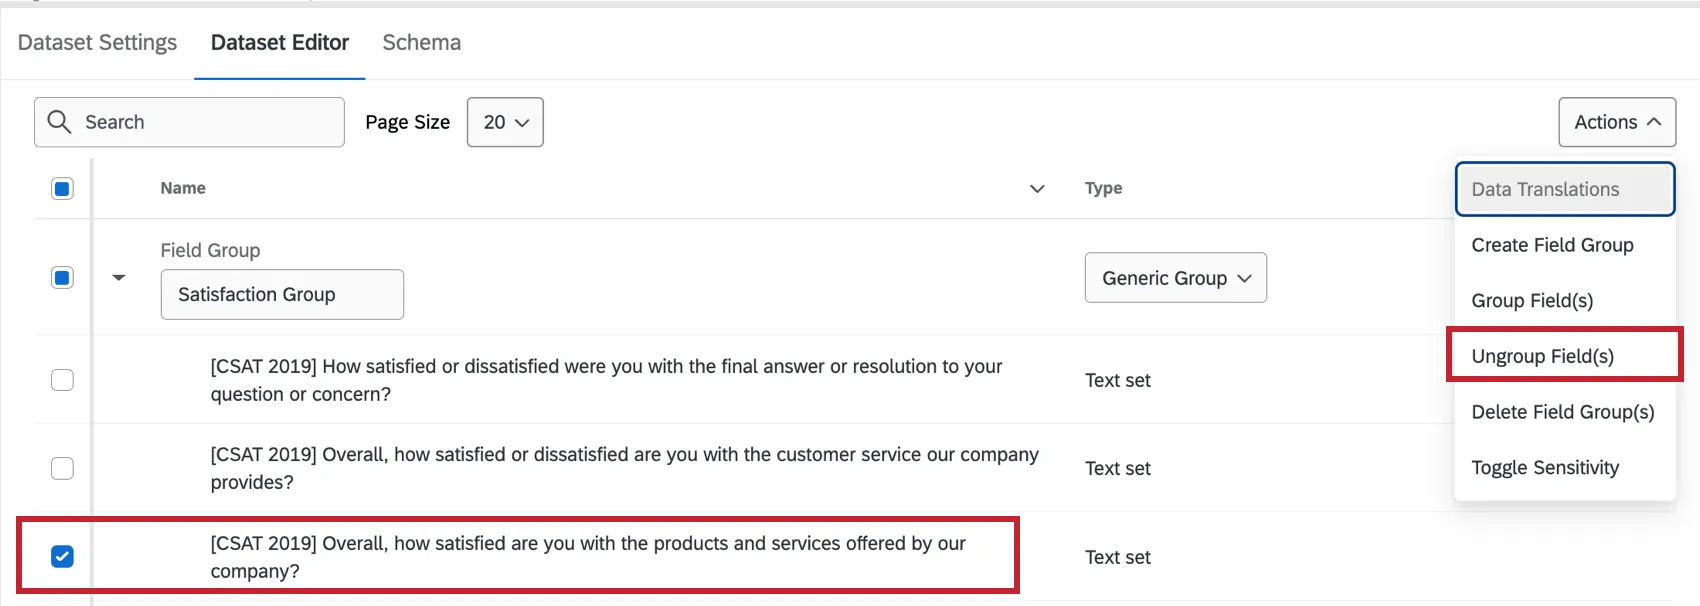
Removing Fields From a Group
Select the fields you want to remove from a group, then select Ungroup Field(s) from the Actions menu.
Deleting Field Groups
Deleting a field group does not delete the fields inside it. To delete a field group, select it, then select Delete Field Group(s) from the Actions menu.
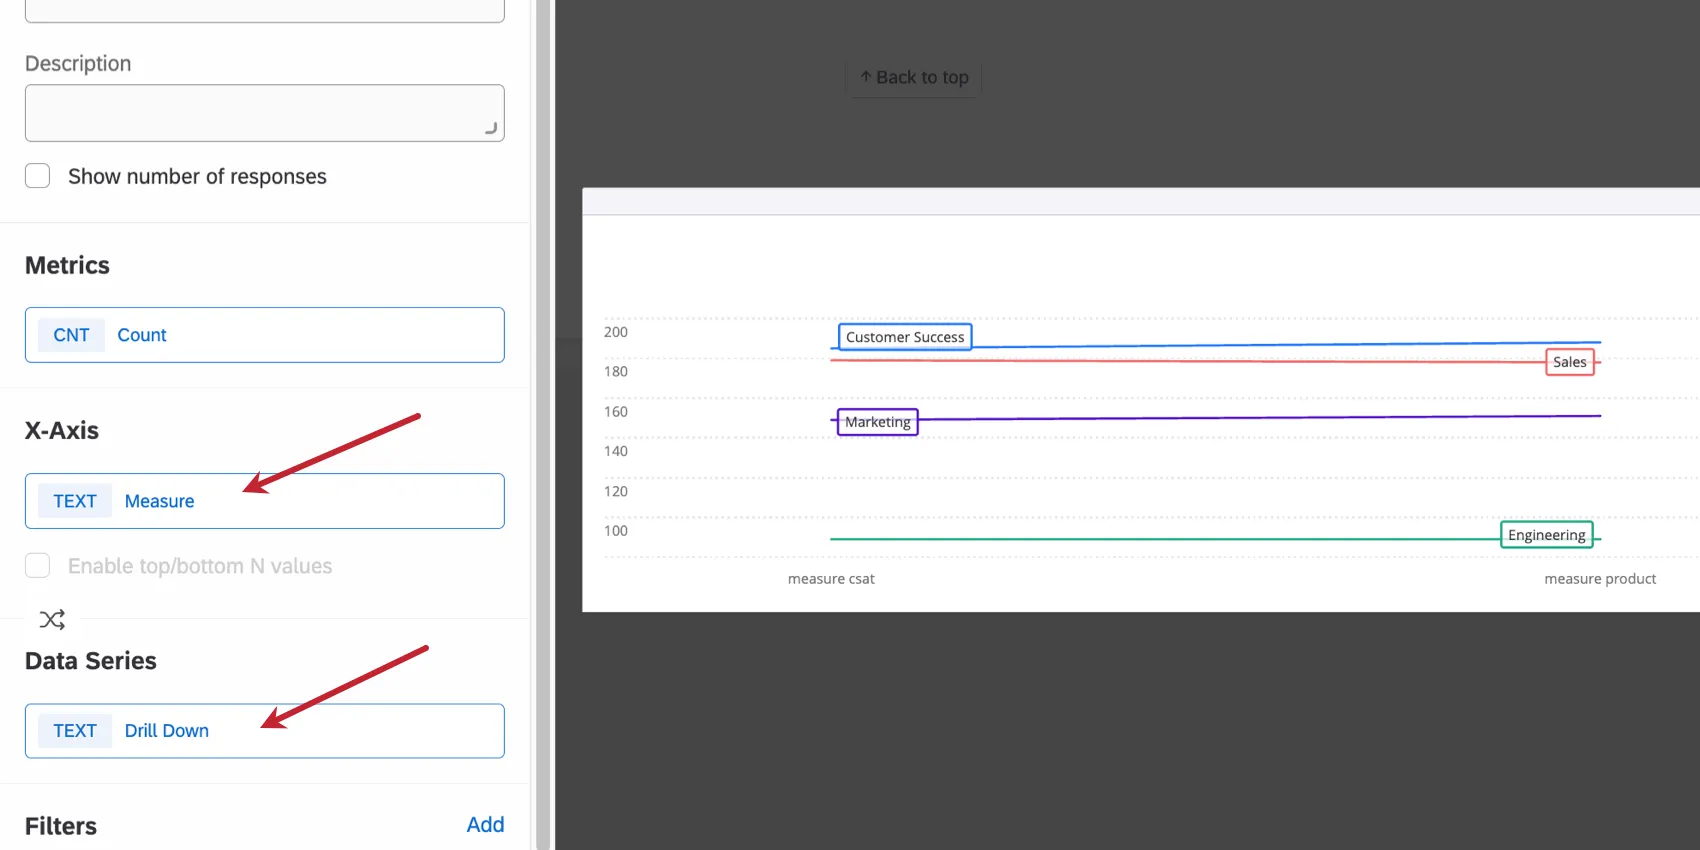
Adding a Field Group to a Widget
Measure groups and drill downs can be added to widgets the same way any other field can. For example, in the line widget pictured below, the field group can be added as an x-axis dimension or a data series.
Measure groups can also be selected as the numerator or denominator in a Subset Ratio Metric. Drill downs cannot be used in subset ratios.
Measure groups cannot be used as widget filters, but individual fields in a measure group can be used in widget filters. Drill downs can be used in widget filters.
Qtip: Generic groups cannot be added to a widget the same way measure groups and drill downs can. Individual fields within a generic group can still be added to widgets on a one-by-one basis.
That's great! Thank you for your feedback!
Thank you for your feedback!