
Using & Editing Your Brand Tracker Data Source
What's on this page
About Using and Editing Your Brand Tracker Data Source
BX programs collect data on your brand in addition to competitive brands and the larger market, which causes the dataset to be more complex than standard projects. BX programs use a stacked dataset (Brand Tracker Data Source, or BTDS) to identify insights in your data more easily.

Understanding the BX Data Source
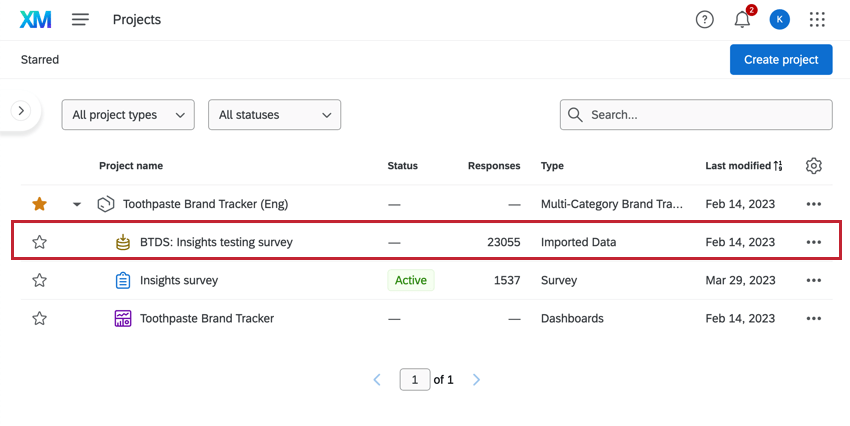
Attention: The Brand Tracker Data Source is created as an Imported Data Project in the BX Program.
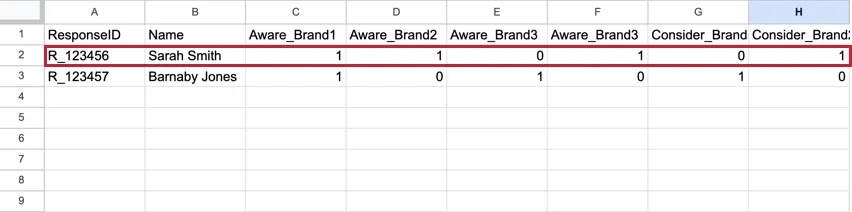
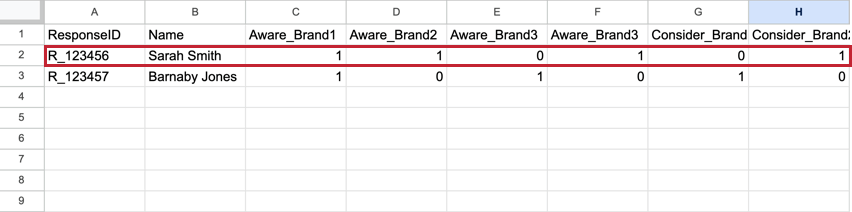
The BTDS varies from what you’d see in a standard dataset. In a standard dataset, each respondent has one row that contains all of the answers to their responses, with each brand’s metric as its own column. These datasets tend to be very wide with hundreds of columns.
Example: In this flat dataset, there is one row of data for Sarah Smith and one row of data for Barnaby Jones. There are separate columns for the metrics for each brand.
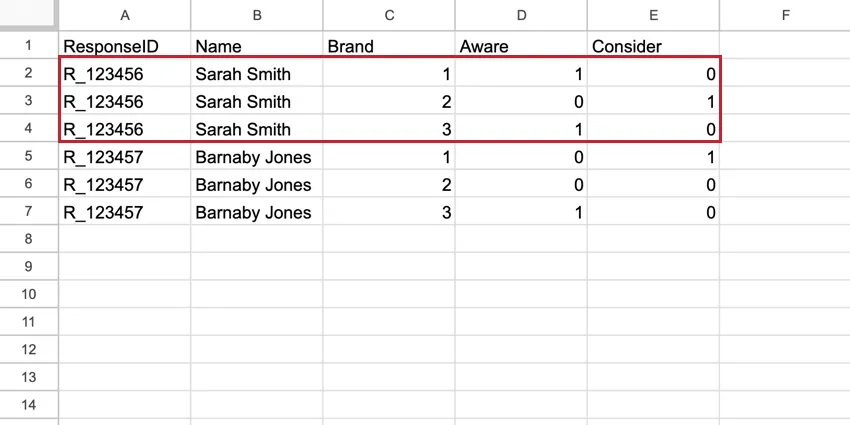
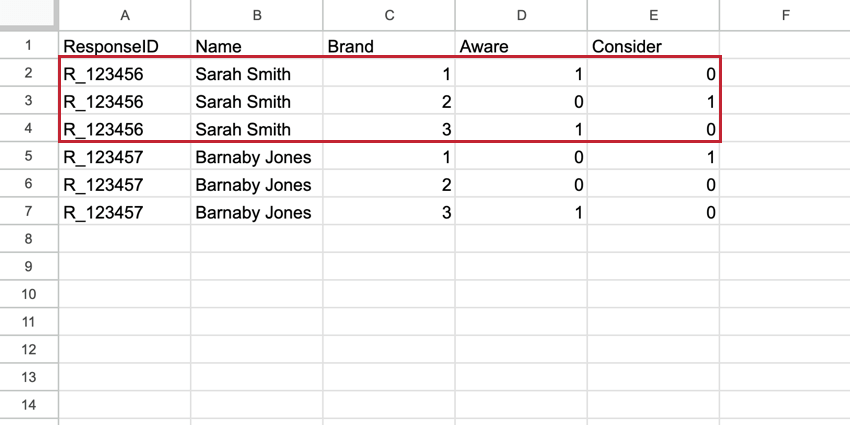
In the BTDS, Brand becomes a first-class column in the dataset and every respondent has a row for each brand. The brand’s row contains all of the data for that single brand. These datasets have more rows than the standard dataset, but they have much less columns, which make them easier to read.
Example: In this stacked dataset, there are 5 rows of data for Sarah Smith, even though they represent only 1 response. Each row contains Sarah’s data for each brand measured.
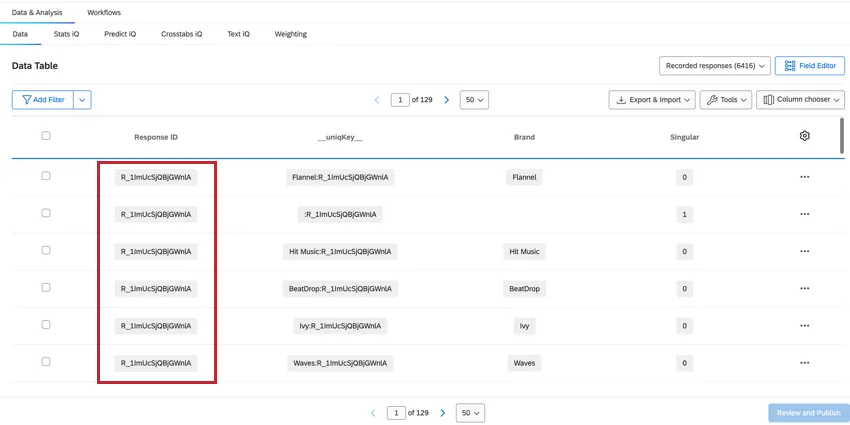
Qtip: Since stacked datasets have different rows for each brand, the Recorded Responses count in the BTDS Data & Analysis tab will be higher than the total number of unique respondents. To find the total number of unique respondents, create a filter for Singular = 1.
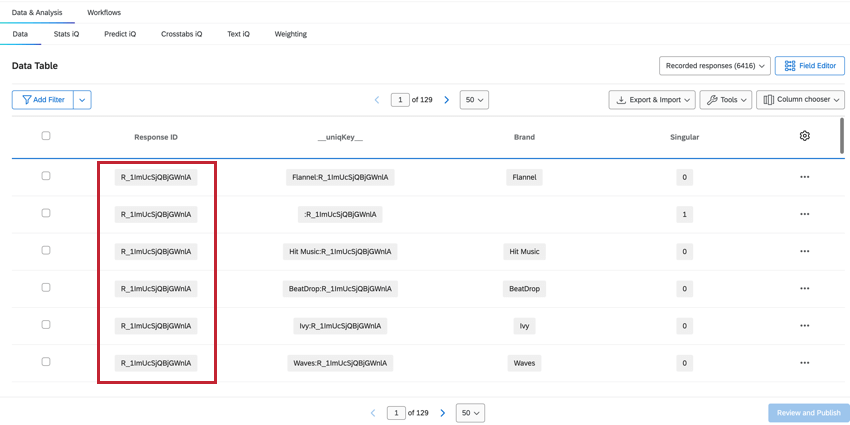
RESPONSEID
The ResponseID field helps us identify which rows belong to the same respondent. This value is from the original survey submission and is repeated for every row belonging to that respondent.
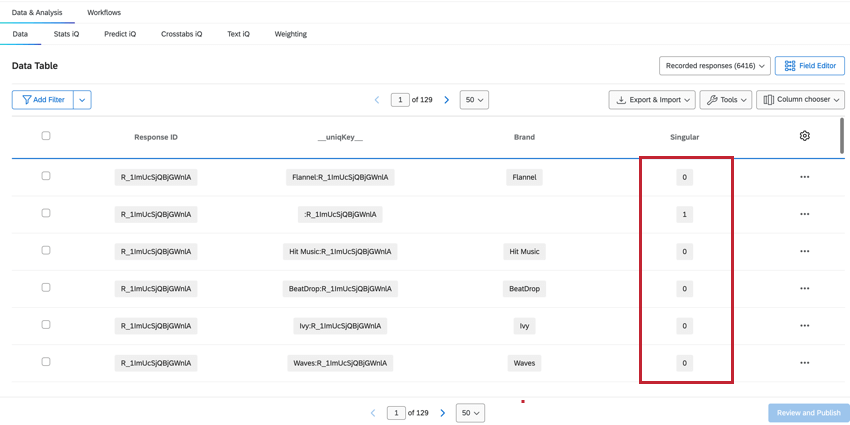
SINGULAR
The count of Recorded Responses in the Data & Analysis tab will give us the total count of all rows, which will be higher than the total number of unique respondents. To determine the unique respondents, we can filter for the field Singular.
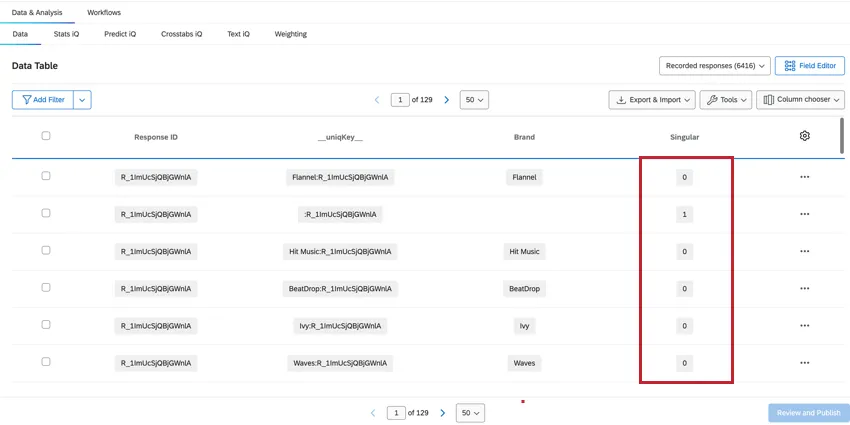
- When Singular = 1, we are shown unique respondent rows with no brand information. There is one unique respondent row per response. Qtip: Creating a filter for Singular = 1 will show the number of individual respondents.

- When Singular = 0, the row contains brand data. There are multiple rows of brand data for each respondent.
Attention: You should thoughtfully consider whether to filter Singular = 1 or Singular = 0 depending on your data goals in dashboards. In most cases, you want to filter for Singular = 0 to exclude the extra non-brand rows from your base size and prevent data inaccuracy. Alternatively, if you need to show true counts of respondent-level data, you would filter for Singular = 1.
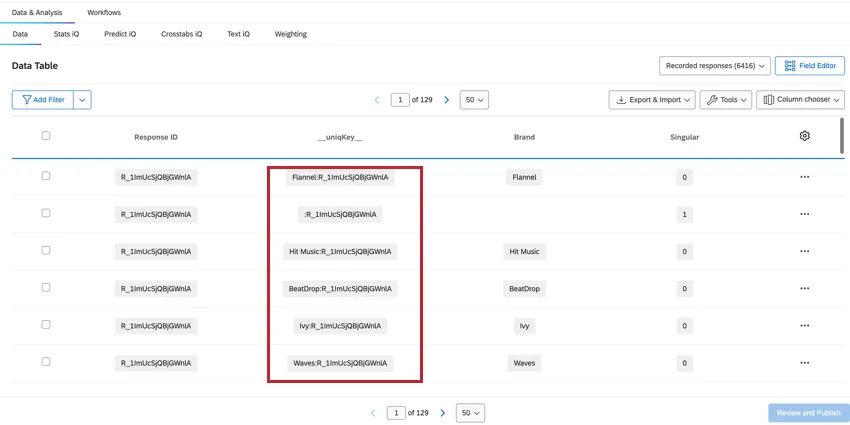
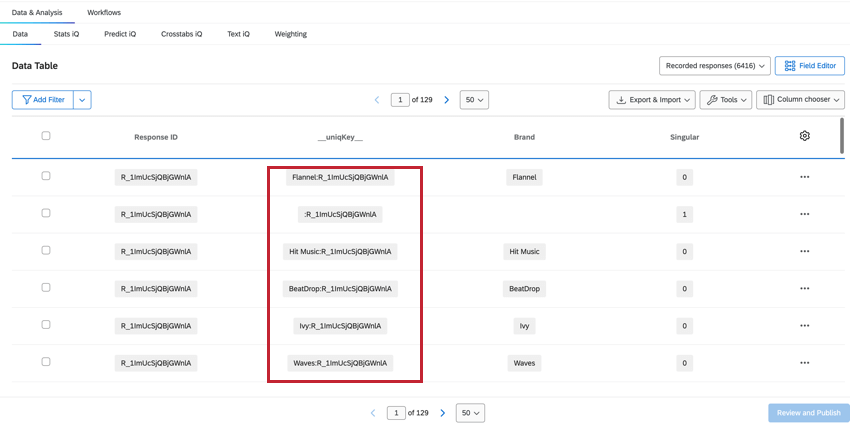
UNIQKEY
The __uniqKey__ field combines the ResponseID and brand name, shown as BrandName:ResponseID. For the unique respondent row with no brand information, the same row where Singular = 1, the __uniqKey__ will be :ResponseID. This is useful for narrowing down the exact response this data is from, as well as the brand it specifically gives feedback on.
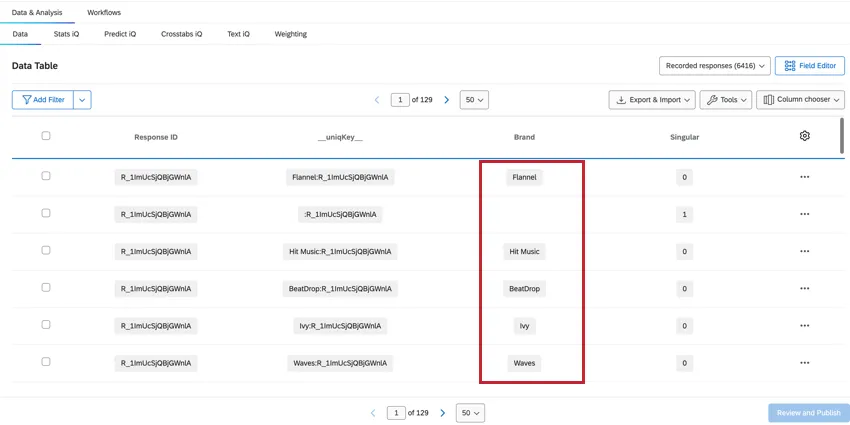
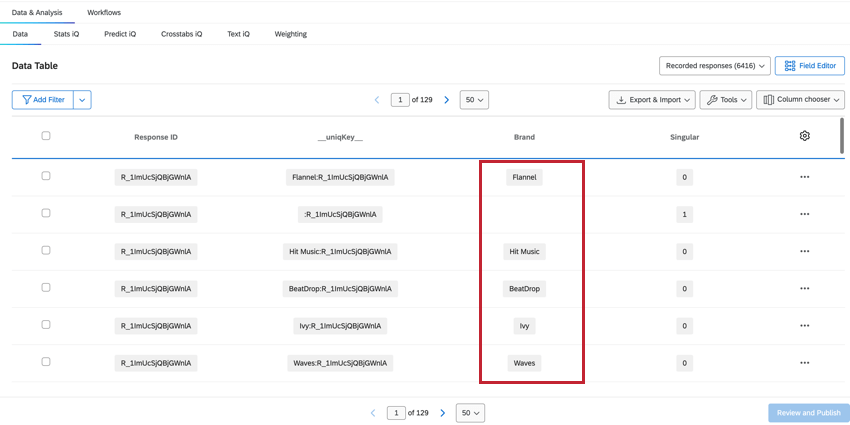
BRAND
The Brand field shows which brand the data in that column is referring to, which allows you to easily see and filter for brand data.
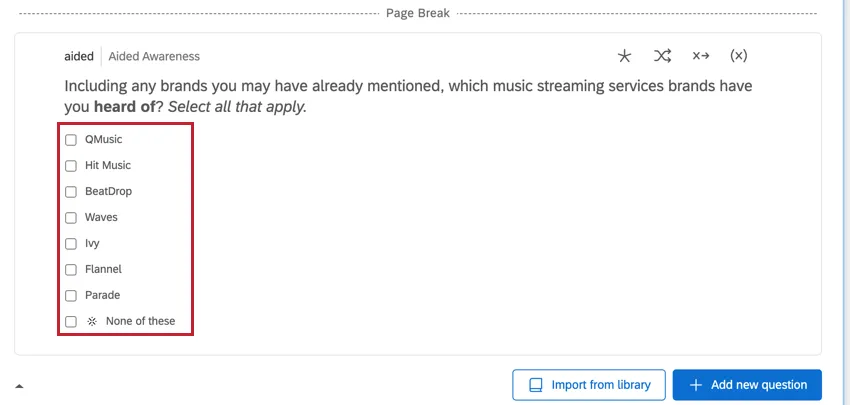
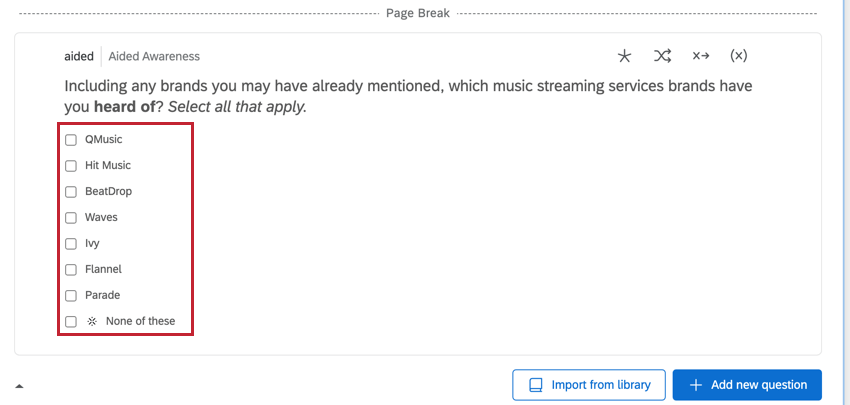
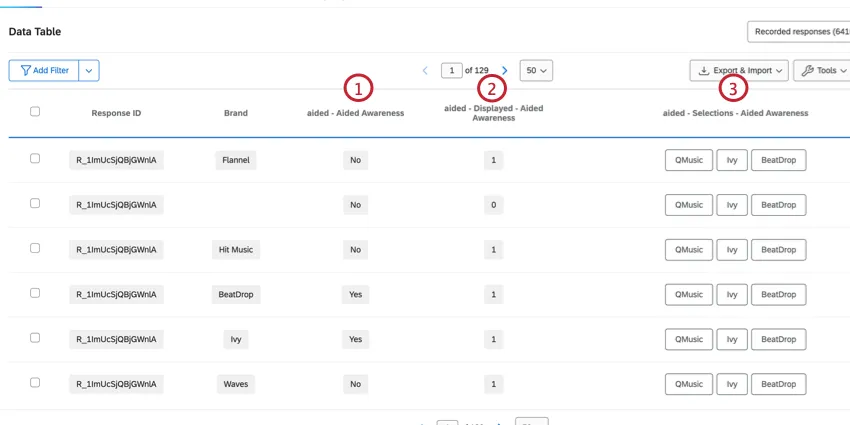
ATTRIBUTE-LED MULTI-SELECT DATA
Attribute-led questions contain the brands as the answer choices. These are typically multi-select question types, and there are multiple columns with data corresponding to that question.
Example: A common example of these question types is the “Aided Awareness” question.
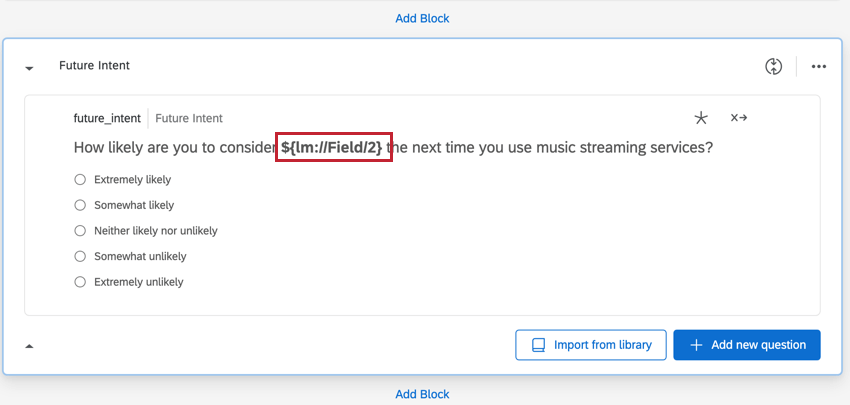
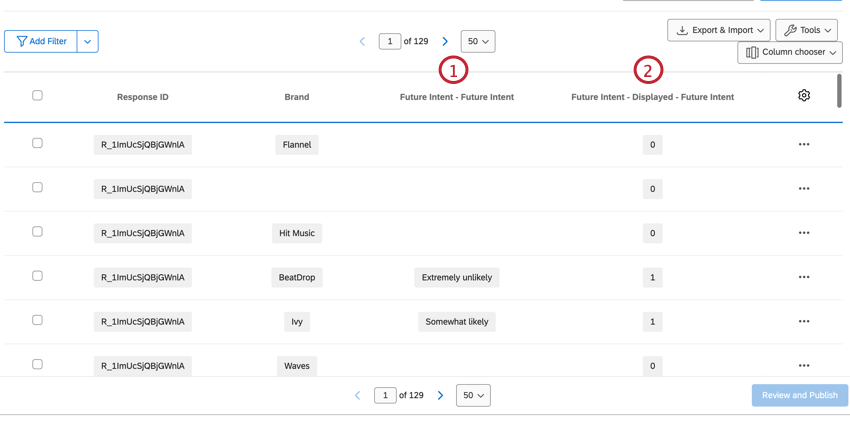
LOOP AND MERGE QUESTION DATA
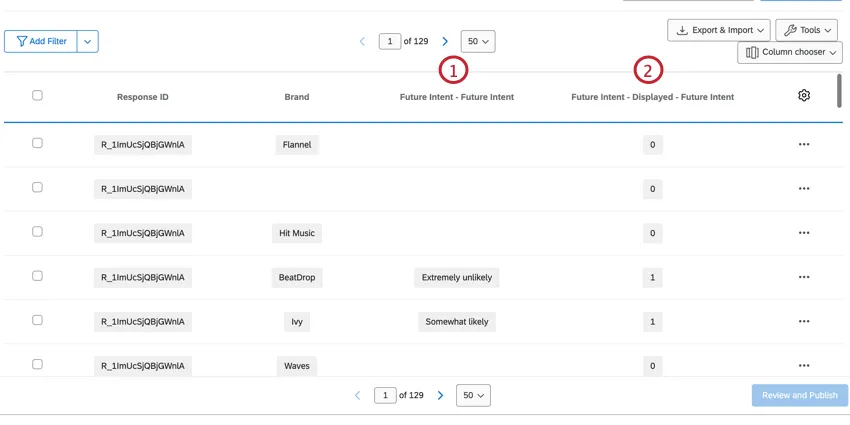
There are also multiple columns for questions that pipe in the brand name using loop & merge.
Example: An example of this question type is the “Future Intent” question.
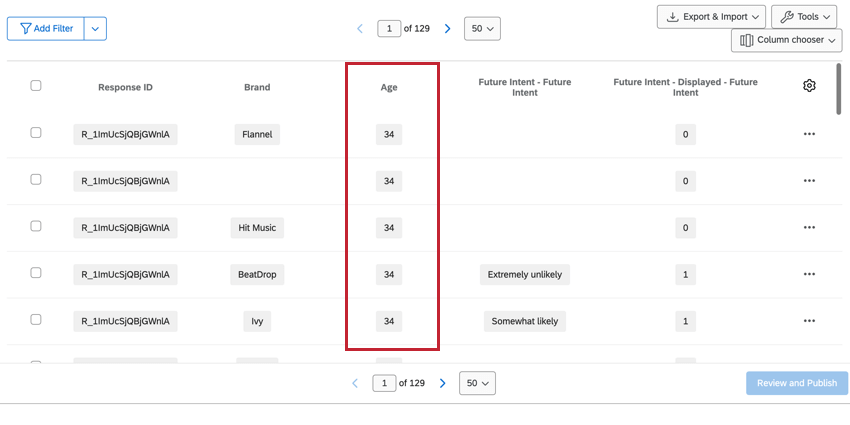
NON-STACKED DATA
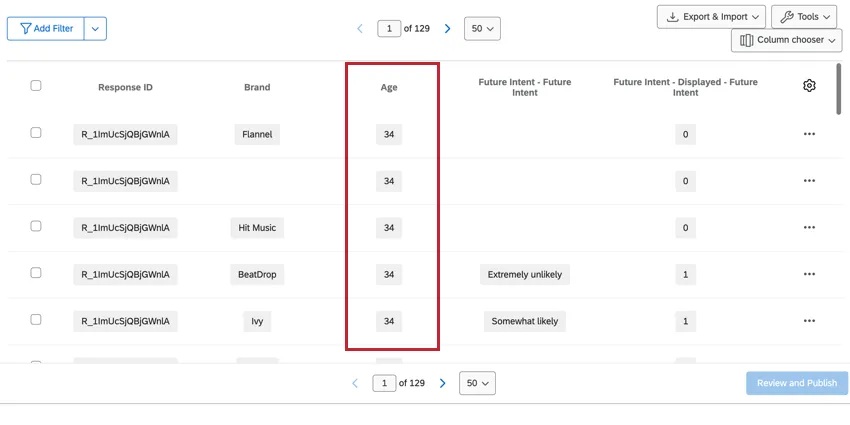
Non-stacked data are not related to brand, such as standard questions (e.g. demographics) and non-stacked embedded data fields. These fields are repeated per brand, which keeps it the data available whether you’re looking at one specific brand or across all brands.
Qtip: Multi-select questions using non-brand data will contain the list of choices selected in the same column. No information is stored on whether or not the respondent saw the answer choices.
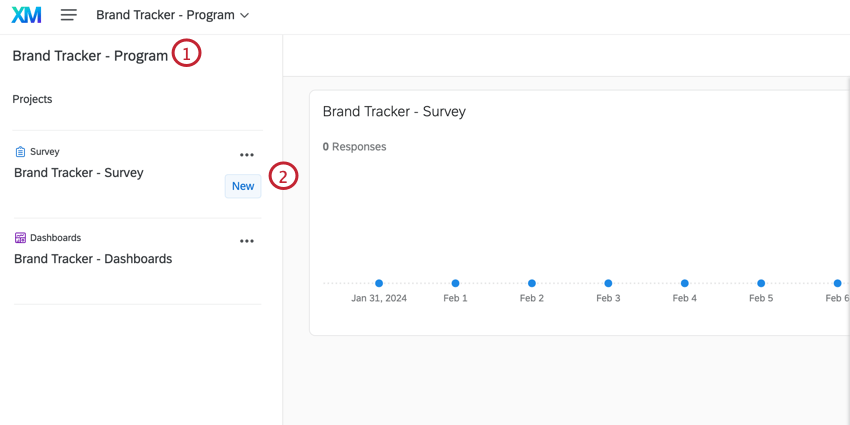
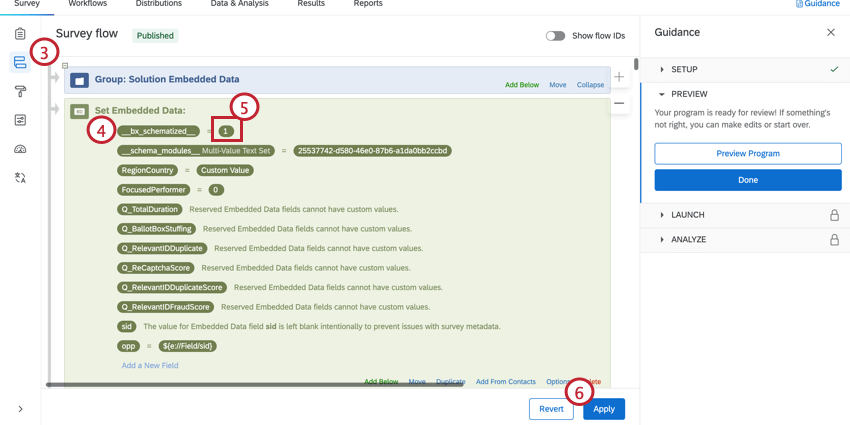
Generating the BTDS
If you create a BX program from scratch, the Brand Tracker Data Source is not generated automatically and must be generated before data collection. Any data collected prior to the BTDS being generated will not be stacked.
Qtip: We recommend generating the BTDS after your survey is fully programmed and tested. Generating it earlier could end up complicating the dataset with extra material and columns.
Stacked Dataset Compatibility
Stacked datasets have limitations on which field types and question types work best for data processing. While creating your BX program, it is important to ensure the survey structure is compatible with the BTDS that will be generated.
The BTDS compatible with the following question types:
- Multiple Choice (single and multi-select)
- Text Entry, Matrix
- Descriptive Text
- Constant Sum
- Slider
- Rank Order
- Meta Info
Attention: Using incompatible question types could cause your data to stack in unexpected ways, or to not stack at all.
Filtering and Exporting the BTDS
Filtering and exporting the BTDS works the same as filtering and exporting from the Data & Analysis tab. These operations can be helpful to better understand dashboard insights, narrow the dataset size, or view specific subsections of the stacked dataset.
Qtip: Filtering for Singular = 0 will refine the dataset to only include unique responses for the BX program. This response count should match the data in the program’s survey project.
Optimization
BX programs with large brand lists can create datasets that are larger than necessary. With brand optimization, you can limit your data to only the brands that are significant.
Example: Let’s say you are doing research on brands in both the United States and Canada. There are 10 brands of interest in the US while there’s only 4 brands of interest in Canada. The Canadian research team would use optimization to isolate their 4 brands and not have to work with unnecessary data.
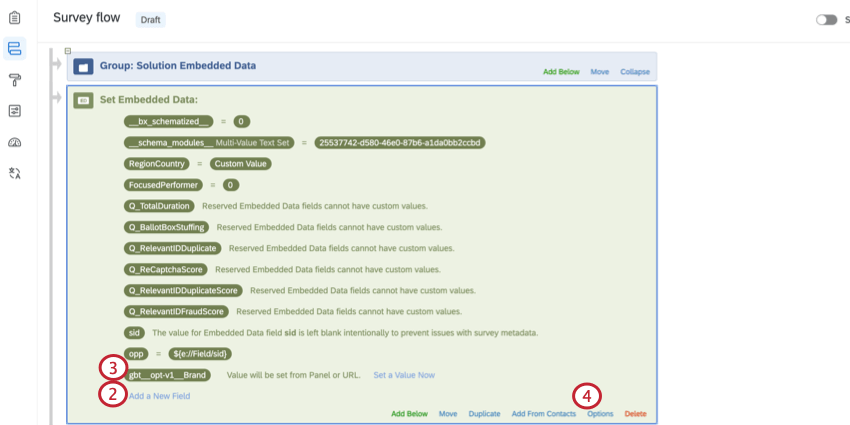
gbt__opt-v1__Brand. 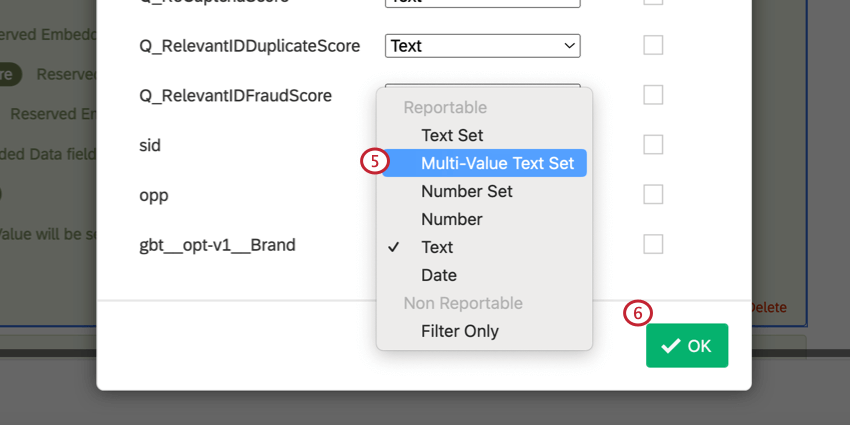
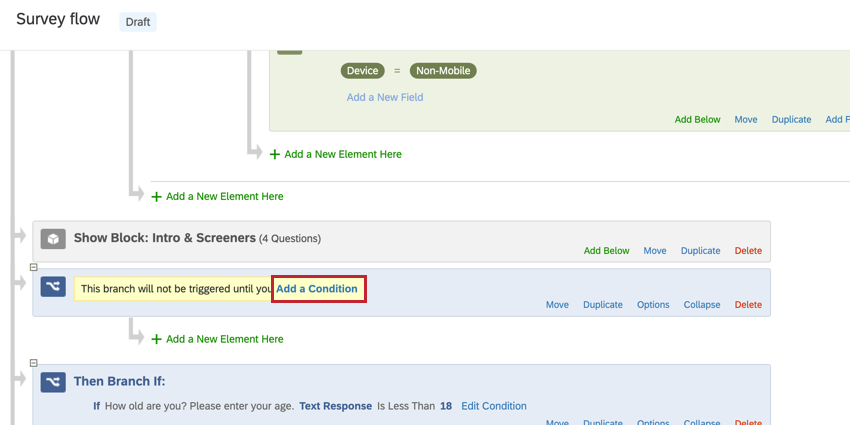
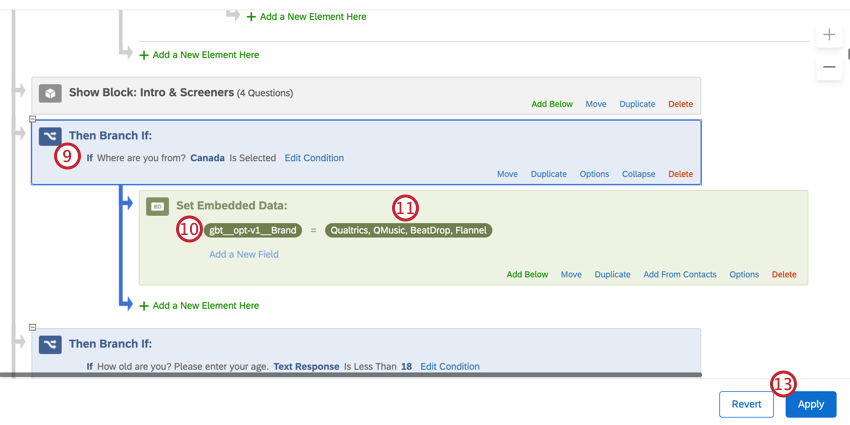
With the optimization variable defined, the processed BTDS will remove rows that are not included in the list for that variable.
Troubleshooting with BTDS
Attention: If any changes are made to the survey after a response has been collected, the BTDS will need to be reprocessed in order for those changes to be applied to existing responses.
Common issues with the BTDS include:
- The response count is different between the BTDS and the survey’s Data & Analysis.
- The brand questions or fields are not stacking or stacking improperly after the BTDS is generated.
RESPONSE COUNT
To compare response counts between the survey dataset and the BTDS, filter the BTDS for Singular = 1. Compare this count to the total count in the survey dataset. If data is flowing correctly, these two numbers should match.
If these numbers do not match, there could be incompatible components in the survey. Review BX Programs Best Practices. If all components appear correct, please contact Qualtrics Support with a list of affected response IDs.
NOT STACKING OR STACKING IMPROPERLY
Qtip: For more information on stacked dataset programming, see BX Program Best Practices.
- Check the Reusable Choice list and all brand-led questions. The brand names must match up exactly to the Reusable Choice list.
- Ensure there are no substrings within the brand list (e.g., one brand “Qualtrics” and another brand “Qualtrics Employee Experience”).
- Ensure the question text is an exact match for each question that is meant to stack together. Different piped text fields in each question (e.g., piped text for different logos per brand) will prevent questions from being stacked together, which is especially common in Matrix questions.
- Check the Expert Review > Data Stacking results to see if there are any flagged issues.
FAQs
When does the BTDS assign a zero or a “Null”?
When does the BTDS assign a zero or a “Null”?
- If a question is not displayed to a respondent, the BTDS assigns a “Null”.
- If an attribute-led brand question is shown to a respondent, the BTDS assigns a zero if the brand is not selected, even if the brand is not displayed.
- If a brand-led question is not displayed to a respondent, the BTDS assigns a “Null”.
- If a brand-led question is displayed and not answered, the BTDS assigns a “Null”.
- If an attribute-led question is not displayed to a respondent, the BTDS assigns a “Null”.
- If an attribute-led question is displayed but the brand answer option is not, the BTDS assigns a 0.
That's great! Thank you for your feedback!
Thank you for your feedback!