
Exporting Data from EX Dashboards
What's on this page
Qtip: This page describes functionality available to Engagement, Lifecycle, Ad Hoc Employee Research, Pulse, and 360 projects. For more details on each, see Types of Employee Experience Projects.
Making Dashboards Available for Export
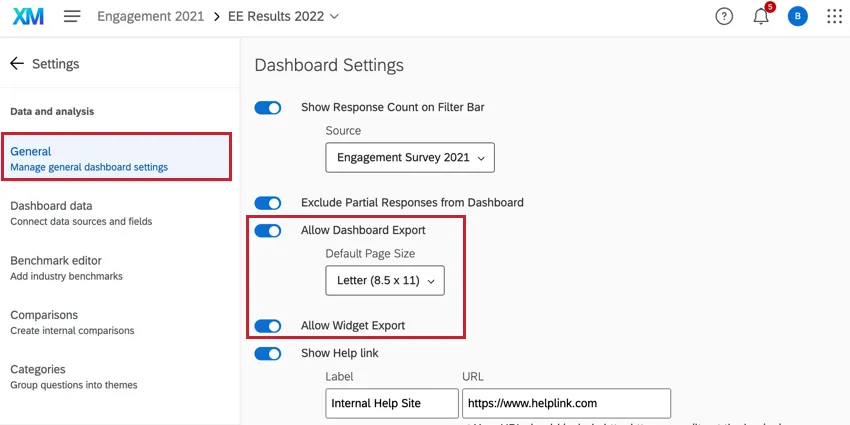
You can make your dashboard pages available for you and your users to export as PDF, JPG, PPTX, or DOCX files. Just go to the General section of your dashboard settings, and enable both Allow Dashboard Export and Allow Widget Export.
Exporting Dashboard Pages
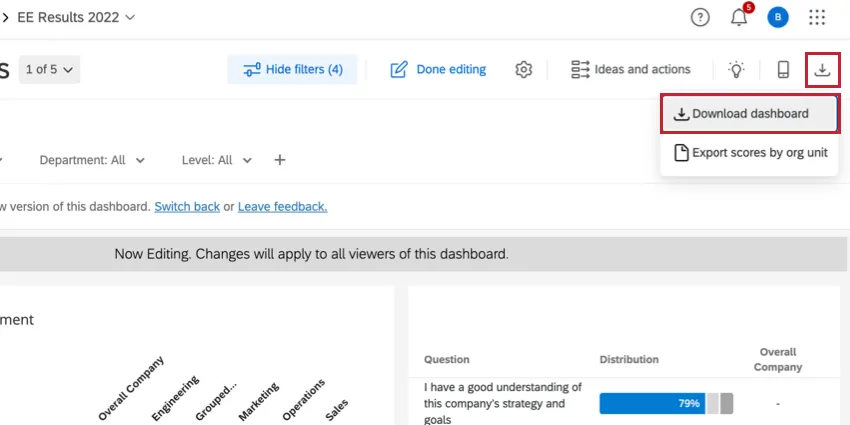
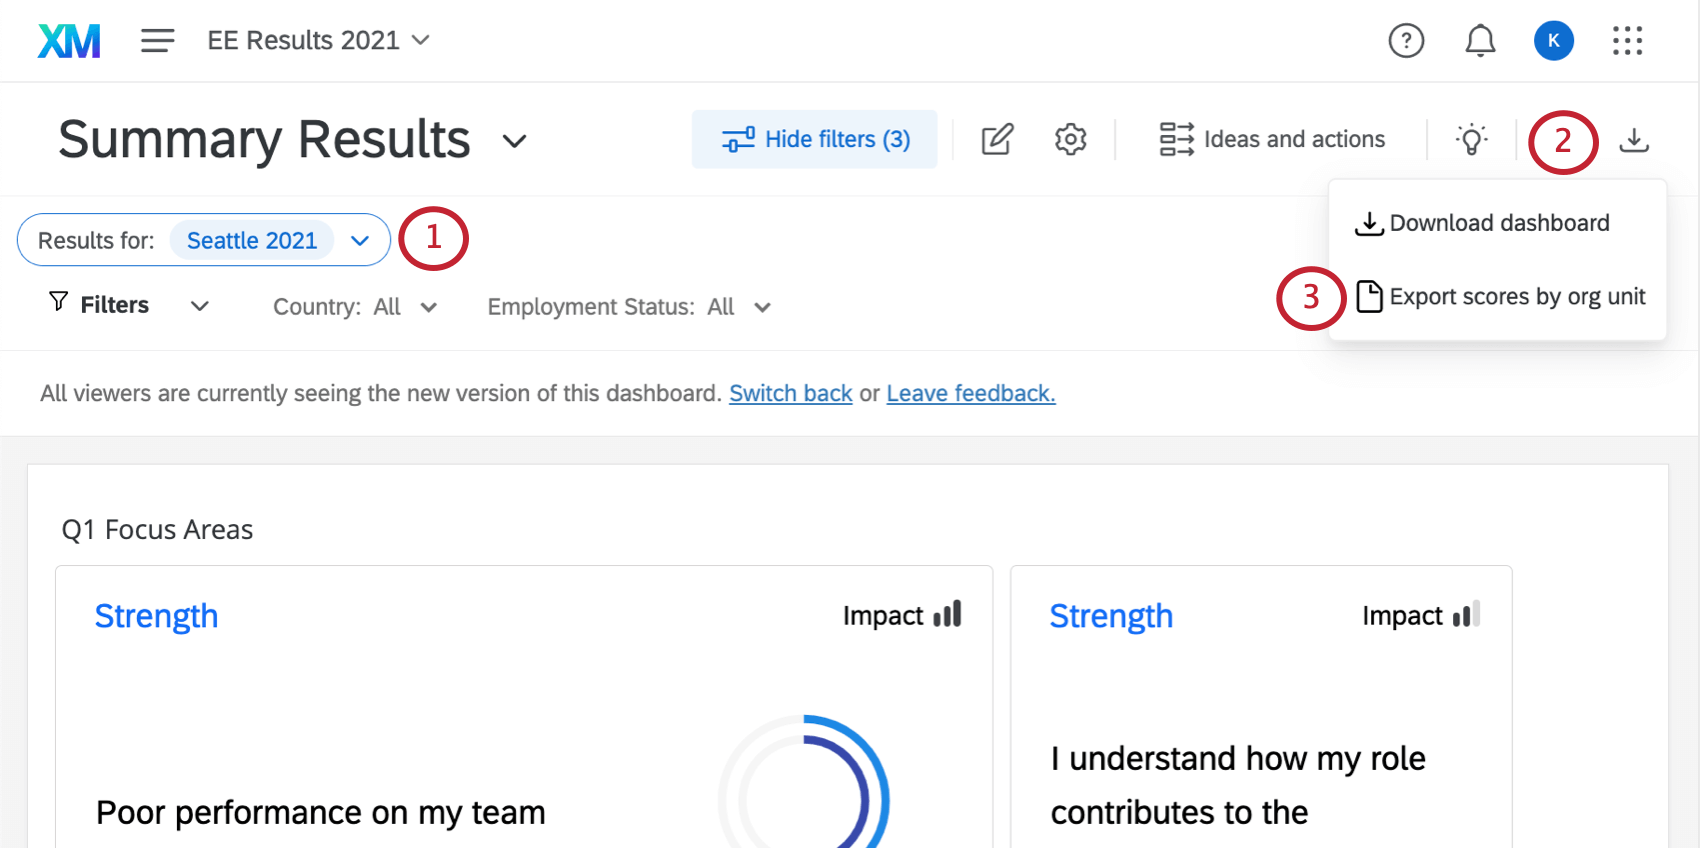
Once these options are enabled, an Export dashboard button will appear in the upper-right of each dashboard page. Click this button and choose Download dashboard to export the current dashboard page.
After clicking Download dashboard, users can further configure the file’s settings before downloading it.
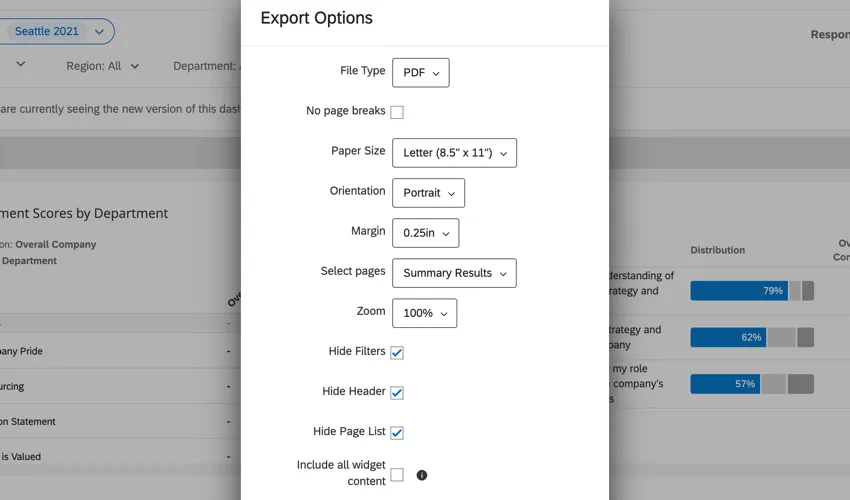
File Type: Can be PDF, JPG, PPTX, or DOCX.

Qtip: The only options for JPG files are Hide Filters, Hide Header, and Hide Page List.
Qtip: The only option for PPTX files is Landscape.
Qtip: To print this report, export it to PDF. From there, you can open the file on your computer to print it.
- No page breaks: Eliminate page breaks in your PDF. This removes paper size and orientation settings.
- Paper Size: In inches. Standard printer paper sizes included.
- Orientation: Portrait or landscape.
- Margin: In inches.
- Select pages: Select which dashboard pages you want to include in the export. You can select multiple pages at a time if needed. By default, only the page you are currently visiting is selected.
- Zoom: Can select from a list of preset options, or Custom to set a custom percentage. The minimum zoom you can set is 50% and the maximum is 150%.
- Hide Filters: Select to hide filters from the export. This doesn’t remove filter affects from the data in the export; instead it hides the filters being used from the top of the exported page.
- Hide Header: When deselected, you will see the name of the dashboard at the top.
- Hide Page List: When selected, exports the dashboard page without the name of the page. When deselected, shows the name of the dashboard page in the selected orientation (either to the left or top).
- Include all widget content: When enabled, all content from record table, response ticker, scorecard, question list, and table widgets will be included in the export.
The export does not automatically include all rows in widgets, but will export what is specifically displayed in the dashboard. Similarly, dashboard exports reflect which action plans are specifically expanded/not expanded.
Attention: Widgets may be cut off if you have page breaks in your export.
You can continue to use the dashboard while you wait for your export. Once complete, it will be automatically downloaded to your computer.
Filters in Dashboard Page Exports
Dashboard exports generally respect the default filters set for the dashboard, unless you have adjusted the filters. The page you export will respect any filters you currently have applied instead of the filters set as the default. If you are exporting multiple pages of the dashboard, only the page you’re currently on will respect filters you currently have applied; otherwise, the additional pages of the export will revert to the default filters for the page.
Example: Your dashboard administrator added filters so that every page of your dashboard shows the last week’s worth of data by default. While looking at the data, you filter the Summary and the Demographics page to show today’s data. On the Summary page, you decide to export the data. In the export, the Summary page show’s today’s data, but the Demographics page shows the last week’s data.
Export Scores by Org Unit
You can export a CSV spreadsheet containing all hierarchy units, along with their response count, question and category scores, comparisons, and benchmarks. This data can be useful for auditing, analysis, and quality assurance purposes.
The file will apply user permissions, current filters, basic confidentiality, and enhanced confidentiality settings to determine what data to include.
Qtip: This export is possible with all org hierarchy types, including level-based, parent-child, and ad-hoc hierarchies. Scores are calculated using dashboard scales.
Attention: If you add, modify or delete categories, scales, comparisons, or fields during an export, the export will fail.
Enabling Org Hierarchy Scores Exports
- This feature is only compatible with Engagement dashboards (not Lifecycle, 360, CX, or any other kind of dashboard).
- You must be a Brand Administrator or EX Administrator with editing access to the dashboard.
- “Allow Dashboard Export” must be turned on.
- The dashboard must be on new scales.
- The dashboard must have a hierarchy filter.
Export times will vary depending on the number of units being exported, as well as the number of statements, categories, comparisons, and benchmarks in the dashboard. Export times can also be influenced by factors such as system load and job scheduling.
Example: A small export with 200 units, 50 statements, and some categories, comparisons, and benchmarks may take about 30 minutes, while a large export with 15k units, 150 statements, and lots of categories, comparisons, and benchmarks may take up to 48 hours.
Maximum File Sizes
Qtip: If you are unable to export a large hierarchy, you may need to export subsets of data at a time. You can also try copying your dashboard, then limiting the number of questions, categories, comparisons or benchmarks before exporting from the copy.
Maximum of one job per organization at a time.
Qtip: Make sure to coordinate with other administrators before exporting this file.
- Maximum of 50,000 hierarchy units in a hierarchy.
- Maximum of 150 questions in a dashboard.
- Maximum of 30 categories in a dashboard.
- Maximum of 20 comparisons in a dashboard.
- Maximum of 20 benchmarks in a dashboard.
Exporting Scores by Org Unit
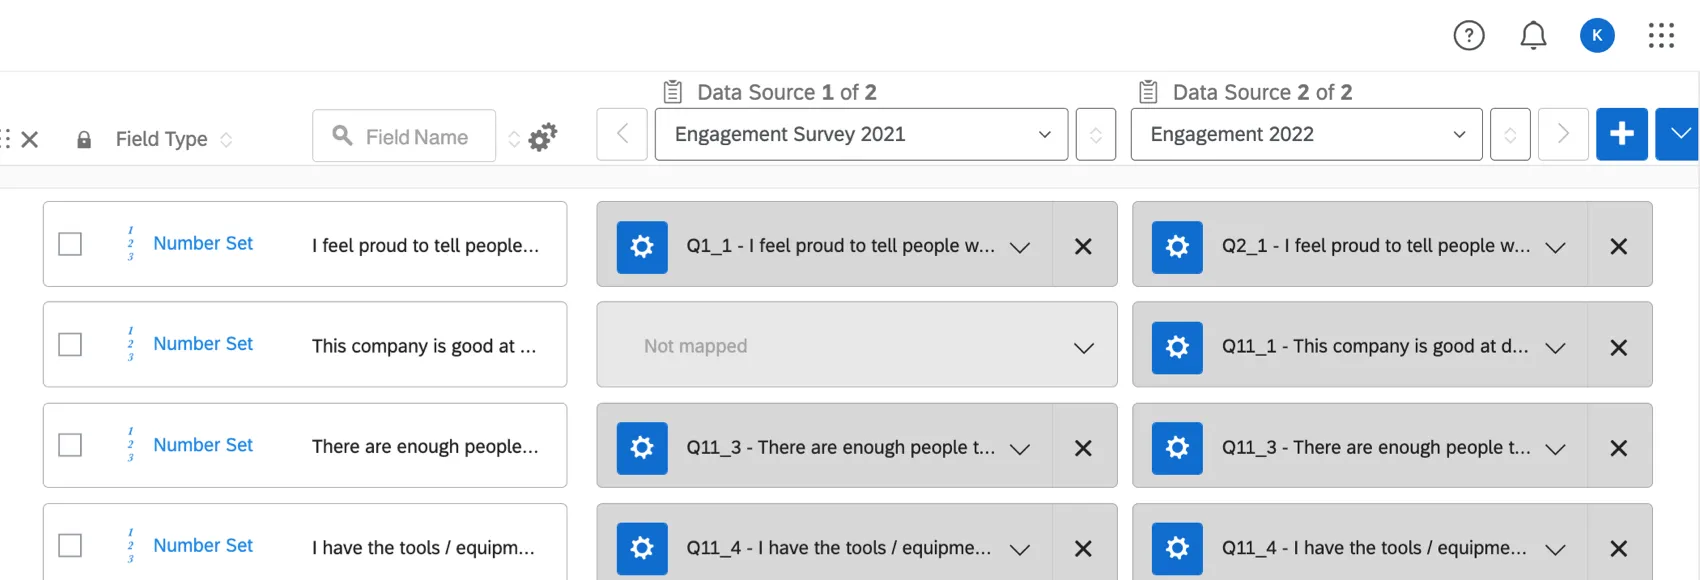
The export will include data from all data sources by default, unless you are filtering to a specific data source. Data from previous data sources will need to be mapped in order to be included. If partial responses are excluded in the dashboard, they will also be excluded in the export.
This file only exports questions as top-box favorability questions. This file does not include dynamic benchmarks.
Qtip: Make sure Dashboard notifications are enabled in your notifications feed before generating this file.
Qtip: Depending on the hierarchy size, your file will usually take a few hours to generate. For extremely large hierarchies, it may take up to a few days. It is alright to leave the page while the file is in progress.
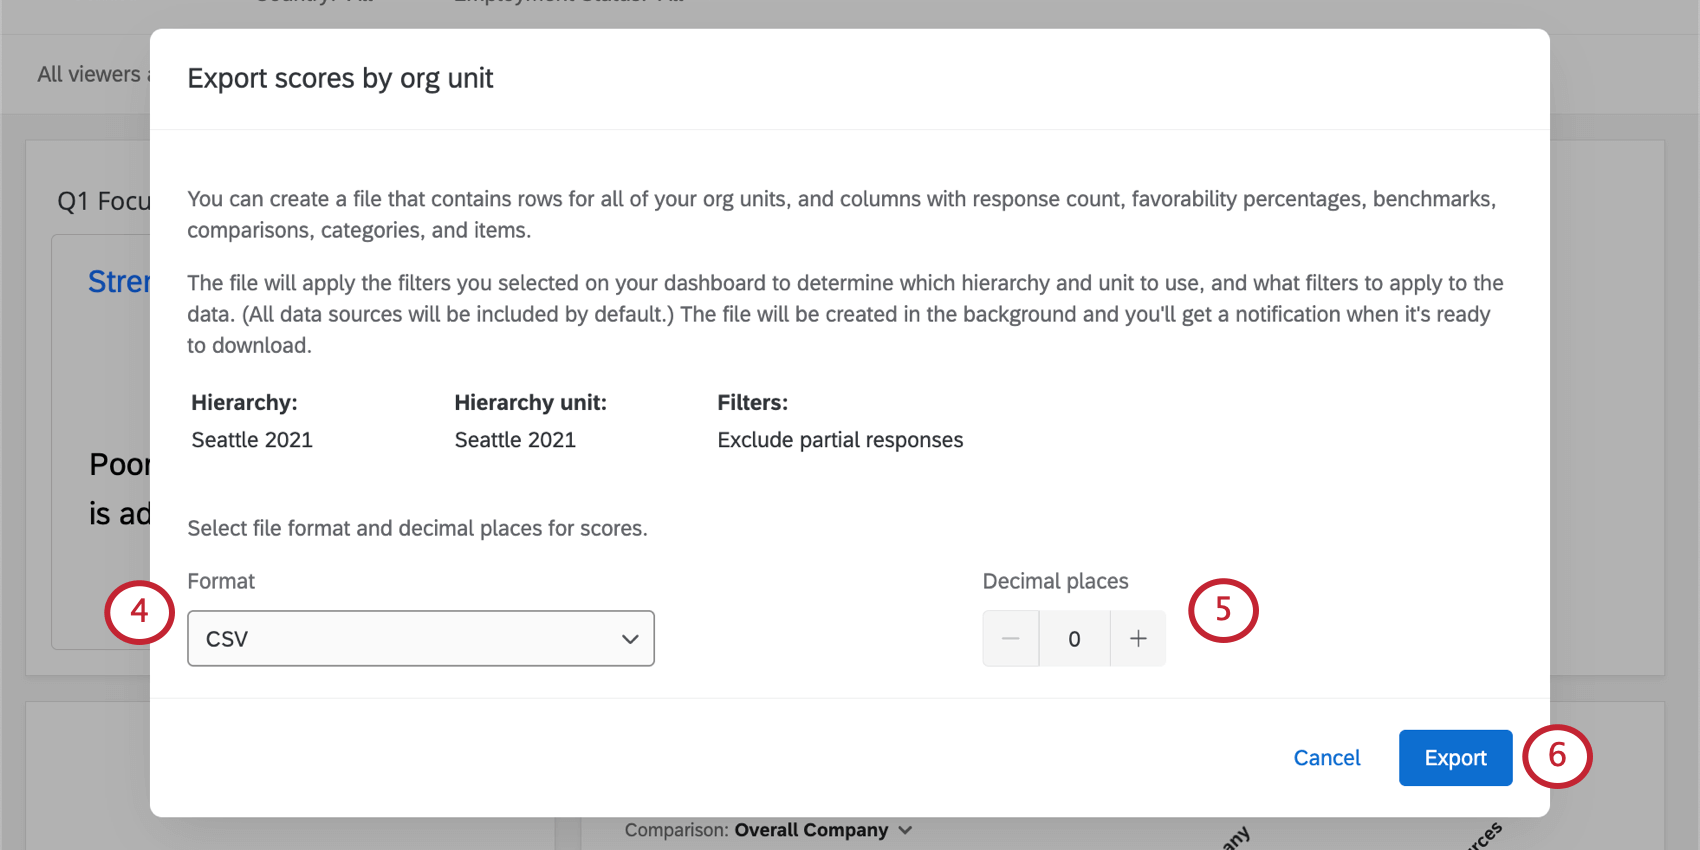
- CSV (Comma separated values)
- TSV (Tab separated values)
Understanding the Org Unit Scores File
Once you’ve exported your spreadsheet, this is how the information will be organized:
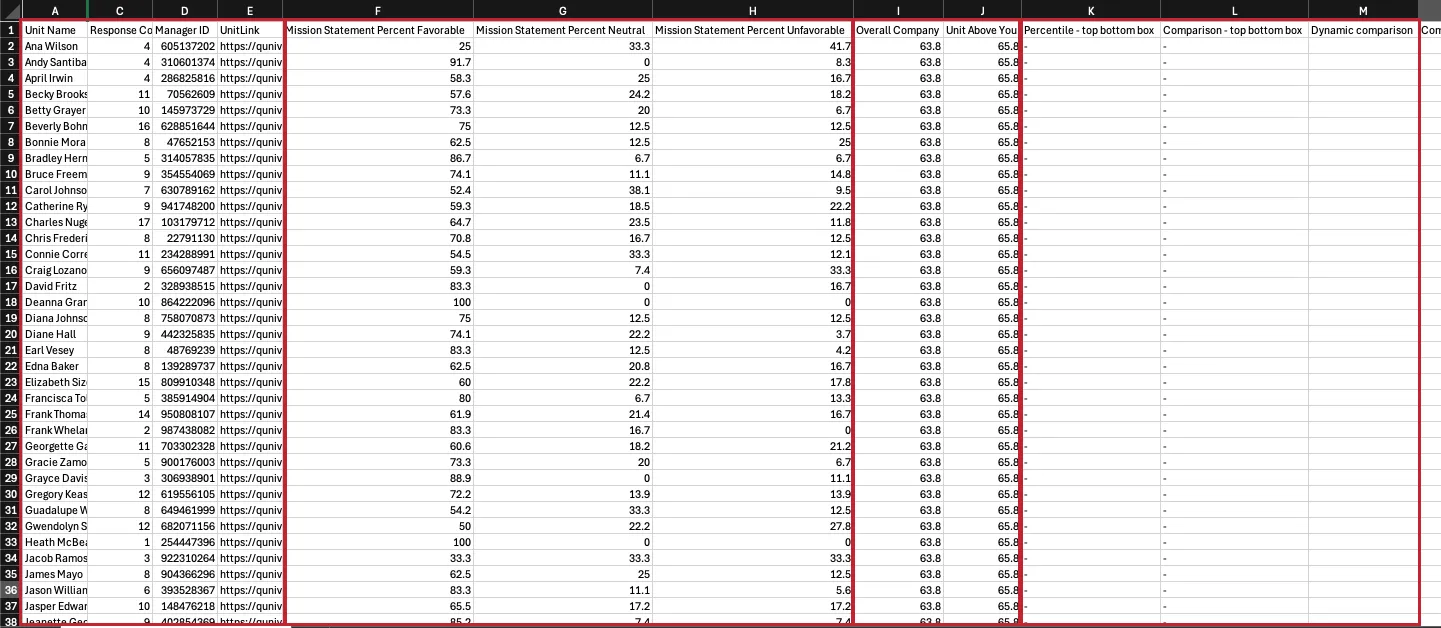
- Each row is a separate unit.
- Unit info columns include:
- Name
- Responses in that unit
- ID of the manager of the unit
- Link to unit
- From then on, columns are organized in groups by categories. For each category, you’ll have a column for the following:
- Percent Favorable, Percent Neutral, and Percent Unfavorable scores. (Which category each unit falls into is based on Scales.)
- Each comparison you’ve created in the dashboard. (These groups are compared to the row’s unit.)
- You’ll also see how each unit scored on each benchmark you’ve added to the dashboard.
- Each question within a category is also broken out by favorable, neutral, and unfavorable scores per unit.
Troubleshooting
- Be careful to take file size limits into account.
The export may fail if you have invalid scales or errors with your scales. Please check the Scales page to learn more. (Open text questions will not cause the export to fail.)
- The export may fail or contain unexpected results if you try to do the following at the same time: updating responses with new metadata, importing participants, or an other action that modifies responses, metadata, or hierarchy structure. Please avoid exporting scores by org unit while other jobs are running.
- The export may fail if the dashboard has issues in any categories, fields or scales. Check the Data Mapper, Categories, Scales, and Comparisons pages for errors or warnings. Make sure to resolve any warnings or remove any items with warnings before running the export. To troubleshoot, you can also try creating a new dashboard in the same project (not a copy) and export from that dashboard.
- The following should not make the export fail:
- Allowing multiple answers per question
- Using advanced question types
- Not having recode values applied
- Having various field types (Numeric Value, Number Set, Date, Text Value, Text Set, Multi-Answer Text Set, or Open Text)
If you are starting an export with Direct reports only enabled in the org hierarchy filter, and the unit doesn’t have any direct-report results, the export will ignore the Direct reports only filter.
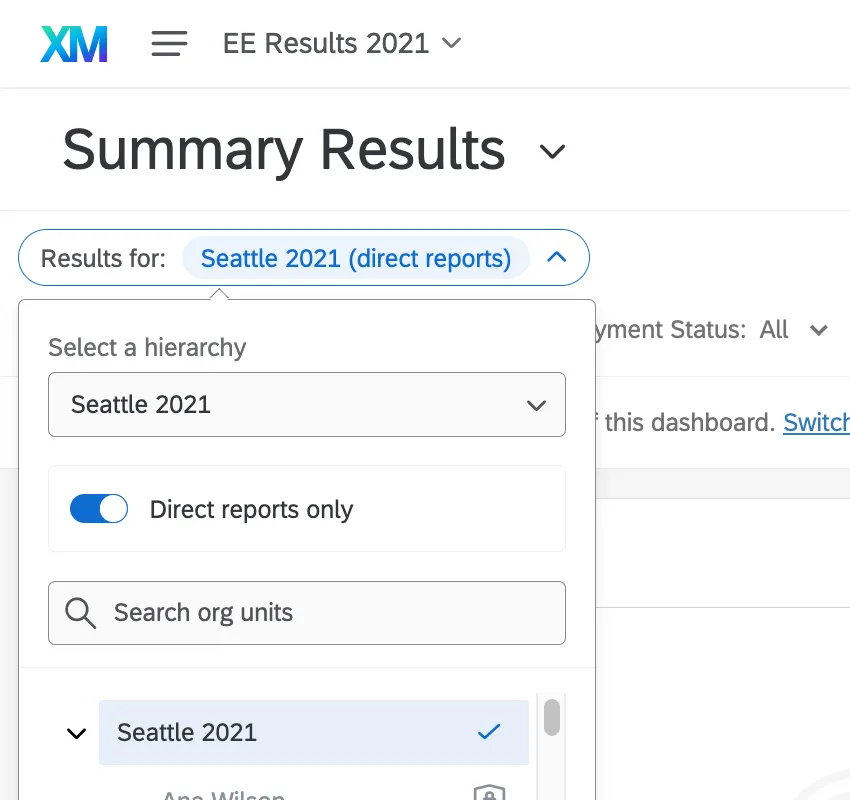
- If you select multiple units at once, the export will ignore the Direct reports only filter.
- All categories and questions show up in the export. If a unit wasn’t asked a specific question or doesn’t have data for that question, the cell won’t have data.
- You can cancel an in-progress export by clicking Manage Imports/Updates/Exports in the participant Tools menu. See Manage Imports/Updates/Exports for more information.
Manage Exports
Within the Manage exports hub you can view the downloads and recent email activity for your dashboard in a single place. For more information and step-by-step instructions on accessing past exports, see Manage Exports. Note that this content is on a page about CX Dashboards, but the functionality is the same.
Allow Widget Export
With Allow Widget Export enabled, you will also be able to export individual widgets. See the Dashboard Settings support page for more details on this and other dashboard settings.
Qtip: Allow Widget Export can be enabled independently. Allow Dashboard Export must be paired with Allow Widget Export.
That's great! Thank you for your feedback!
Thank you for your feedback!