Net Promoter Score® (NPS) Question
About Net Promoter Score® Questions
Net Promoter Score®, commonly referred to as NPS, is a customer loyalty metric that gauges how willing a customer is to recommend a product or service. Developed by Fred Reichheld, founder of Bain & Company’s Loyalty Practice, the Net Promoter Score® is now used as an alternative or supplement to customer satisfaction measurement in thousands of organizations around the world.
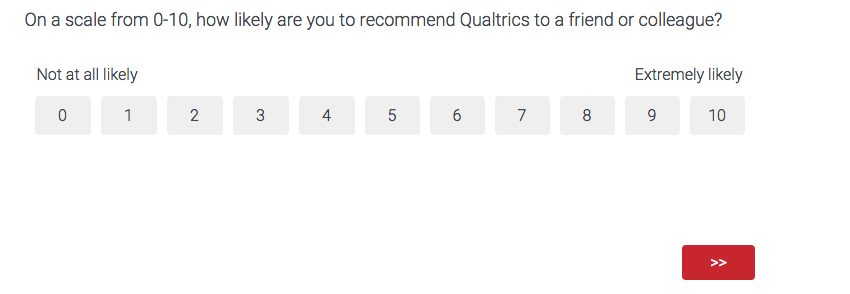
In its most simple form, Net Promoter Score can be described with 1 simple question:
Setting Up Net Promoter Score®
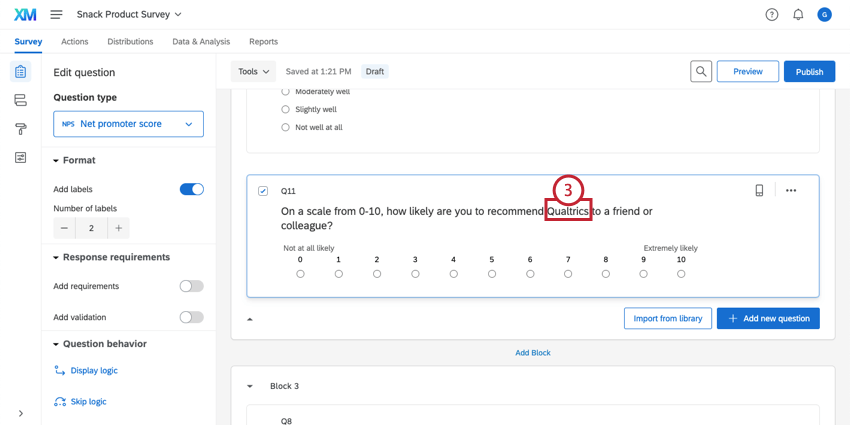
For easy implementation, the Net Promoter Score is built directly into Qualtrics as a question type. To ensure consistency with Net Promoter Score theory, the question type purposefully has limited editing options and is set at exactly 11 scale points.
- Click Add new question.
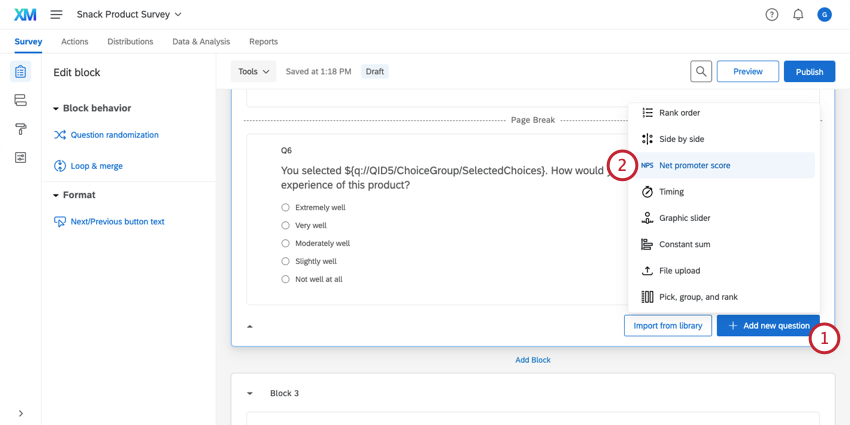
- Choose Net promoter score®.
- Click on the question text to replace [INSERT COMPANY NAME HERE] with the name of your company, product, or service.

Calculating Net Promoter Score®
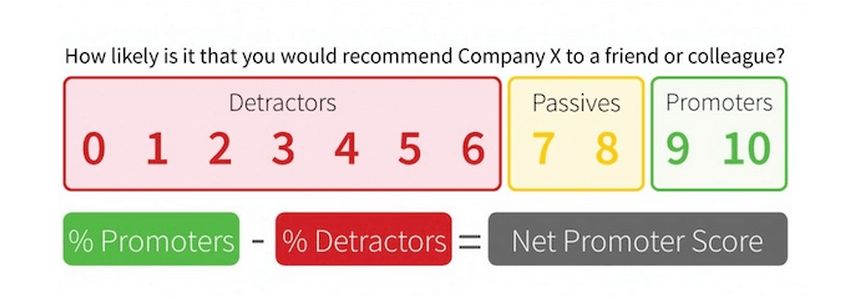
The Net Promoter Score divides respondents into 3 categories based on the scale point they selected:
- Promoters (scale points 9 and 10): Promoters are your customers who are loyal and enthusiastic about your organization and will continue buying and referring others.
- Passives (scale points 7 and 8): Passives are generally satisfied customers, but lack the enthusiasm of promoters. This group is vulnerable to competitive offerings and not immune to defection.
- Detractors (scale points 0 through 6): Detractors are often unhappy and can diminish your brand through negative word of mouth.
An entity’s Net Promoter Score is derived by taking the percentage of all respondents who are promoters and subtracting the percentage of respondents who are detractors.
Data Analysis
Once your responses have been collected, Qualtrics offers various ways you can analyze and report on your response data.
Reports
Because they come with both a numeric score and an assigned group, Net Promoter Score questions are extremely versatile, so you can use many different kinds of charts and tables to report on their results.
In the Reports tab, all visualizations except the heat map and word cloud are compatible with NPS questions.
In Results Dashboards, you can also choose from just about any widget. For example, you can display average numeric NPS using a gauge chart, or break out a line chart by NPS group.
Downloaded Data Format
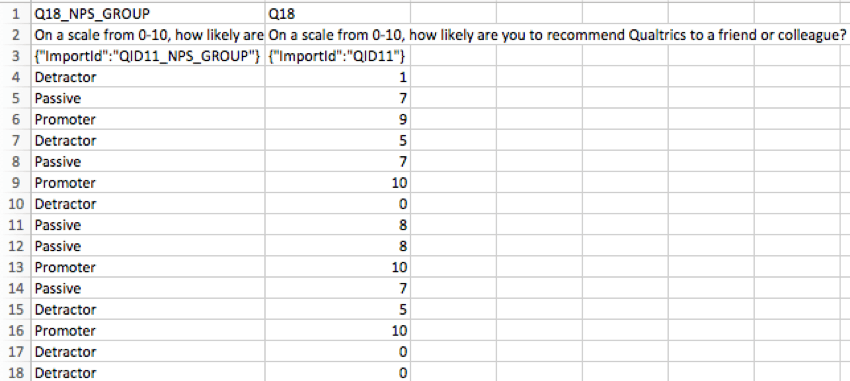
In the downloaded dataset, a column is included for each Net Promoter Score question, listing the score given by each individual respondent and the corresponding NPS group that puts them in.
NPS Questions for EX Projects
In addition to standard survey projects, NPS questions can be used in the following EX project types:
- Ad Hoc Employee Research
- Engagement
- Lifecycle
- Pulse
Overall, the question still functions the same with the same setup and data analysis capabilities. However, there are a few unique changes for NPS questions in an EX project:
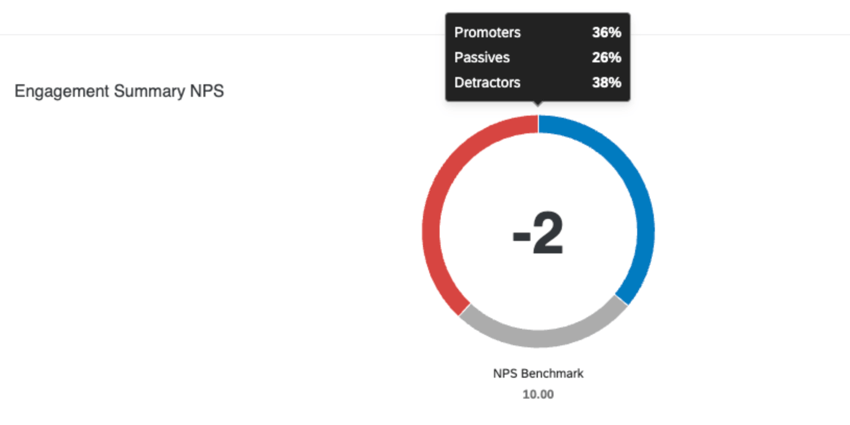
- NPS respondents are broken down into the following categories in EX:
- Favorable: Scale points 9 and 10.
- Neutral: Scale points 7 and 8.
- Unfavorable: Scale points 6 and below.
Qtip: These categories are used to automatically set the dashboard scale for the NPS question.
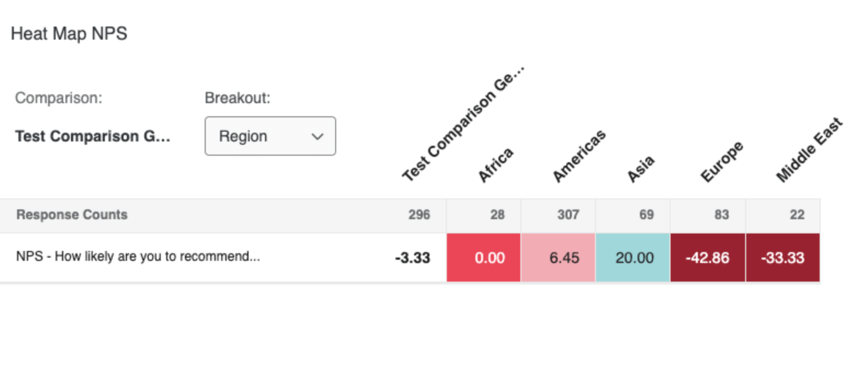
- You can display NPS data in the following EX dashboard widgets:
- Question List (horizontal bar variation only)

- Scorecard (horizontal bar variation only)

- Heat Map
- Engagement Summary
 Qtip: Older dashboards may contain legacy versions of these widgets that are incompatible with NPS questions. NPS data can only be added to the updated version of the widgets. Please see this resource for more information about how to identify widget types and update your older widgets.Qtip: You can also display NPS data in these widgets’ respective report template visualizations.
- Question List (horizontal bar variation only)
- Statistical significance is supported for NPS metrics.
- NPS questions are mapped as a Number Set field type in your dashboard data.
FAQs
NPS®, Net Promoter® & Net Promoter Score® are registered trademarks of Satmetrix Systems, Inc., Bain & Company and Fred Reichheld.
