
Report Types (Designer)
What's on this page
Attention: Reports in Designer are for exploratory purposes only, and all insights packages have been deprecated. Please use Studio for the most accurate reporting.
About Report Types
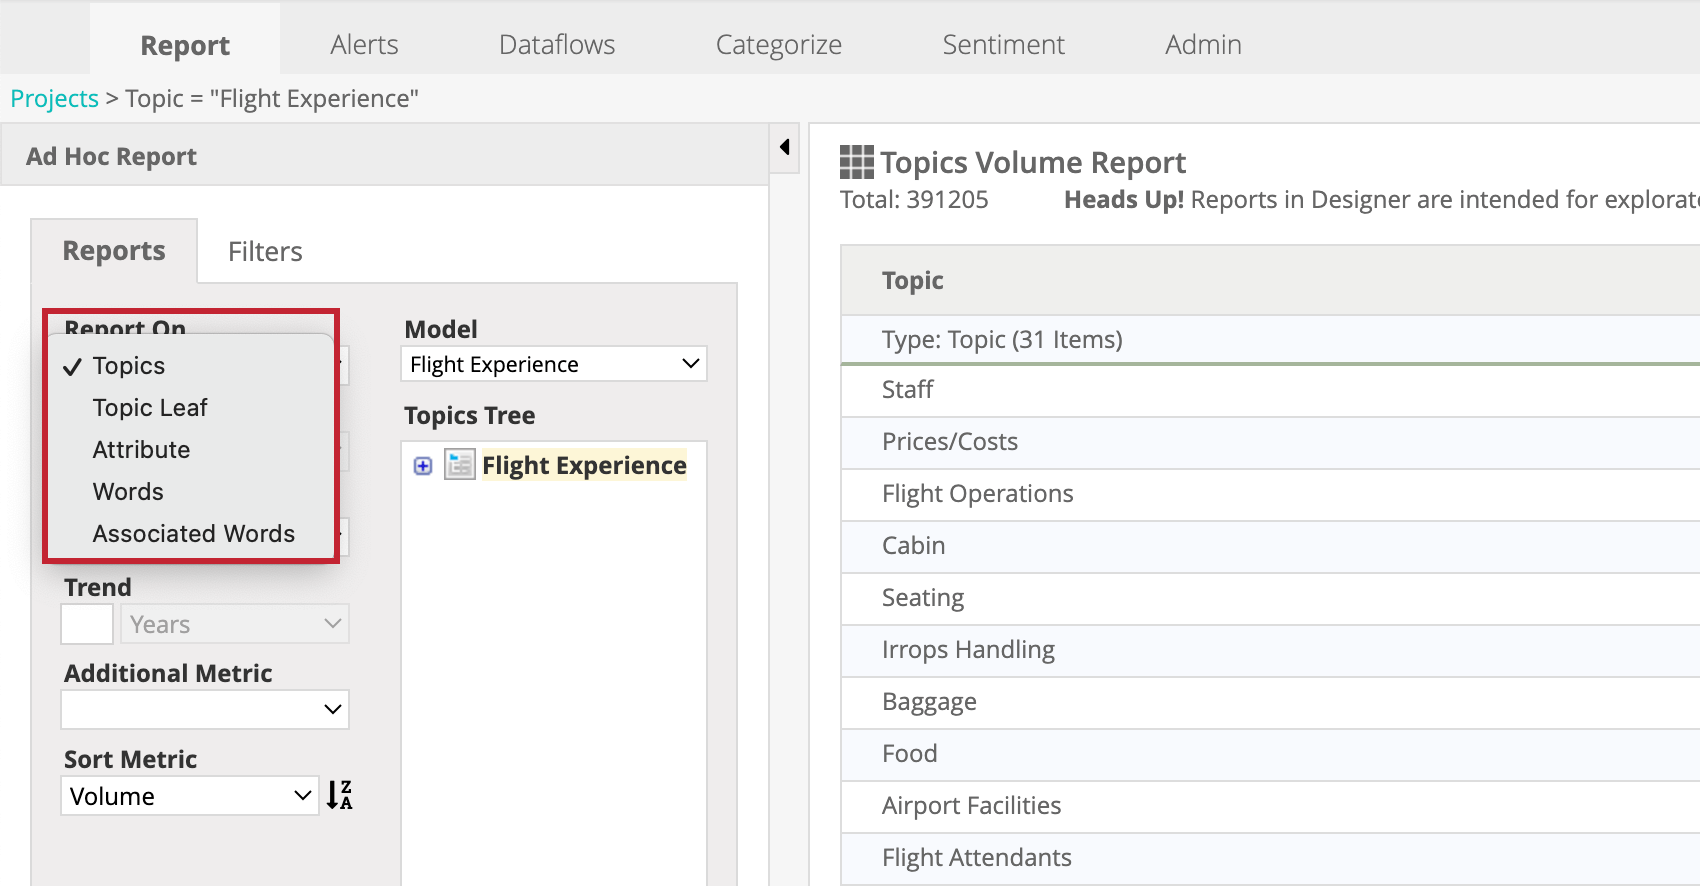
When you create an Ad Hoc report, there are 5 report types to choose from. To select a report type, click the Report On dropdown while configuring an Ad Hoc report.
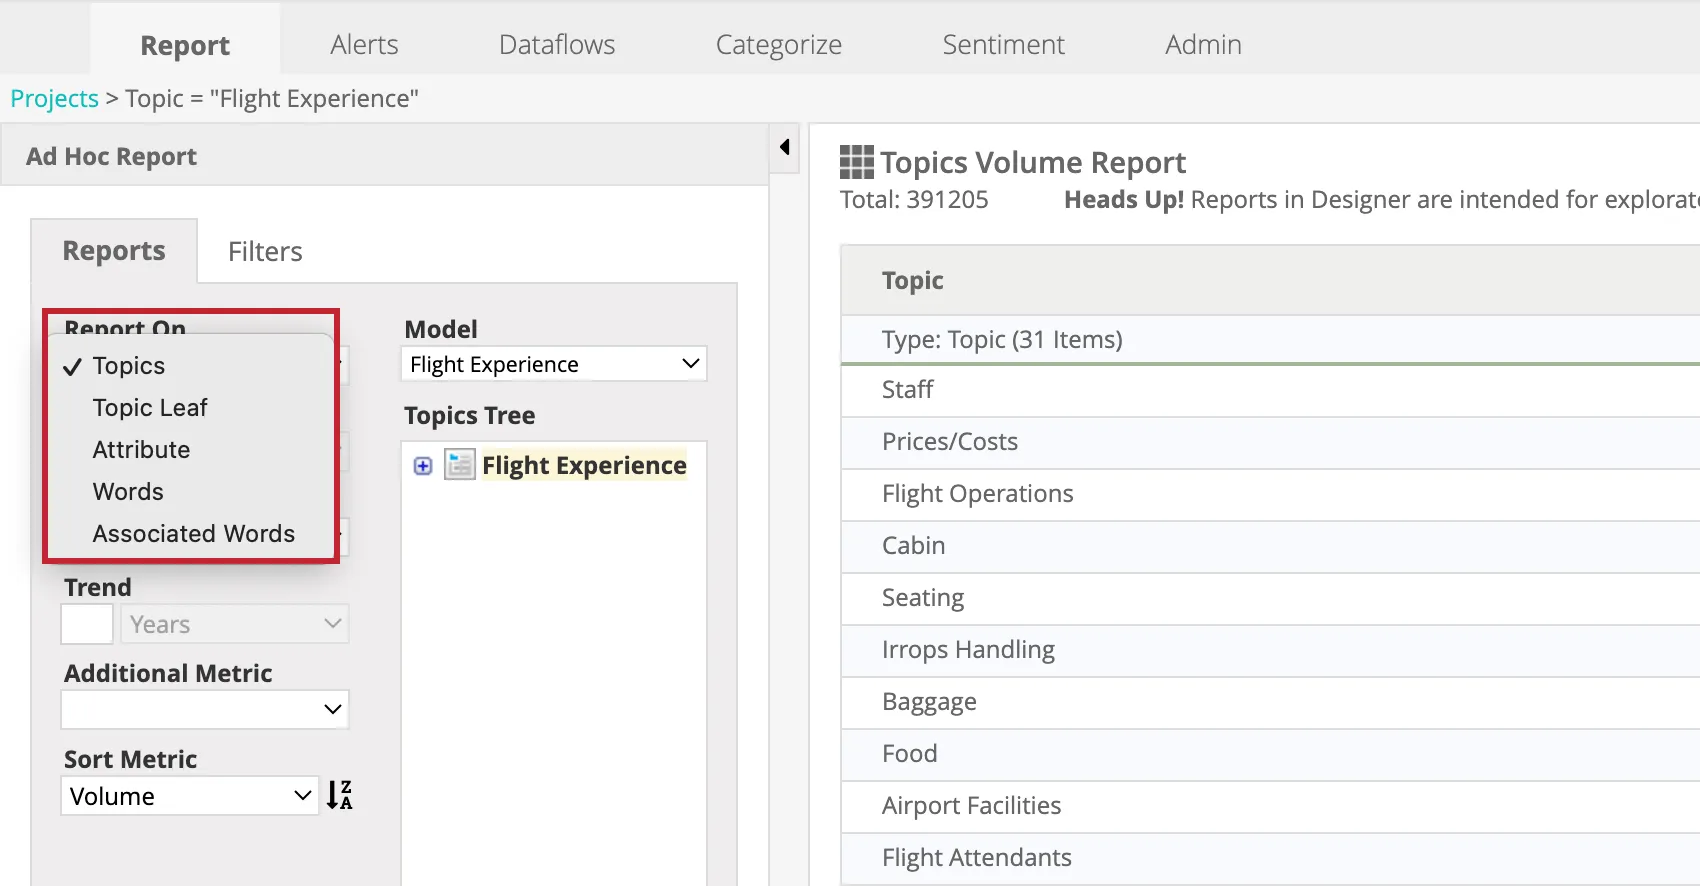
Each report type differs in the data it contains and the visualizations it is compatible with. See each section below for more information on each report type.
Topics Report
The Topics report displays metrics for topics, and provides an overview of what your customers are talking about the most. This report type focuses on high-level categories, while the Topic Leaf report focuses on sub-categories.
This report is compatible with the following visualization types:
- Table
- Trend (for top 10 topics)
- Dual Axis (for top 10 topics)
- Bar Graph (for top 10 topics)
- Pie Chart (for top 10 topics)
- Heat Map (for top 10 topics)
- Bubble (for top 10 topics)
In Table view, the Topics report contains the following columns:
- Total: Total number of records that satisfy report conditions. Attention: Records without text are only included in the report if the classification model the report is based on is set to Include records without text in model.

- Topic: Topic name.
- Volume: Number of records with sentences classified into the topic category.
- Volume %: Percentage of related records. This is calculated by dividing the number of related records by the total number of records in the report.
- Sentiment: Average sentiment of sentences classified into the topic category.
- Additional metrics: Average values of additional metrics or satisfaction scores.
Topic Leaf Report
The Topic Leaf report displays metrics for topic leaves, and provides an overview of specific themes your customers are talking about. This report type focuses on sub-categories, while the Topics report focuses on high-level categories.
This report is compatible with the following visualization types:
- Table
- Trend (for top 10 topics)
- Dual Axis (for top 10 topics)
- Bar Graph (for top 10 topics)
- Pie Chart (for top 10 topics)
- Heat Map (for top 10 topics)
- Bubble (for top 10 topics)
In Table view, the Topic Leaf report contains the following columns:
- Total: Total number of records that satisfy report conditions. Attention: Records without text are only included in the report if the classification model the report is based on is set to Include records without text in model.
- Topic: Topic name.
- Volume: Number of records with sentences classified into the topic category.
- Volume %: Percentage of related records. This is calculated by dividing the number of related records by the total number of records in the report. Attention: The volume percentage of topics leaves is calculated as a percentage of the whole model, not their parent topic.
- Sentiment: Average sentiment of sentences classified into the topic category.
- Additional metrics: Average values of additional metrics or satisfaction scores.
Attribute Report
The Attribute report displays metrics for structured attributes. This report type allows you to examine problem areas by drilling down to attributes associated with a product, brand, or location to see which of them your customers are complaining about the most.
With this report type you can also select an attribute set to report on. This will display metrics for predefined sets of structured attributes. For information about creating attribute sets, see Creating an Attribute Set.
This report is compatible with the following visualization types:
- Table Qtip: This visualization type is also available for attribute sets.

- Trend (for top 10 attribute values) Qtip: This visualization type is also available for attribute sets, and will display trends for the top 10 attributes by volume within the set.
- Dual Axis (for top 10 attribute values)
- Bar Graph (for top 10 attribute values)
- Pie Chart (for top 10 attribute values)
- Cloud
- Bubble (for top 10 attribute values)
In Table view, the Attribute report contains the following columns:
- Total: Total number of records that satisfy report conditions. Attention: If the report is based on a classification model, it will include records without text as long as they pass the chosen model’s root-level rule criteria, even if this model is not configured to include empty records.
- Attribute: Values of the selected attribute.
- Attribute Set: Name of the attribute from the set. This column will only appear if you selected an attribute set to report on.
- Average Score: Average score of non-null attribute values. This column will only appear if you selected an attribute set to report on.
- Volume: Number of records containing this attribute value. If you selected an attribute set to report on this will be the number of distinct non-null attribute values.
- Volume %: Percentage of related records. This is calculated by dividing the number of records containing the attribute value by the total number of records in the report. If you selected an attribute set to report on this will be the number of distinct non-null attribute values divided by the number of records in the project. Attention: If the report is based on a classification model, the number of related records will honor root-level rules only.
- % of Attribute Total: Percentage of attribute total. This is calculated by dividing the number of records shown on the report for a given attribute by the total number of records for that attribute. Qtip: This metric can be disabled in Project Settings.
- Satisfaction: Average value of a satisfaction score. This column will only appear if you selected an attribute set to report on.
- Satisfaction Breakdown: A visual breakdown of records by satisfaction score bands. This column will only appear if you selected an attribute set to report on.
- Sentiment: Average sentiment of sentences from related records.
- Sentiment Breakdown: A visual breakdown of records by sentiment bands (defined as Report thresholds in project settings).
- Additional metrics: Average values of additional metrics or satisfaction scores of related records.
Words Report
The Words report displays metrics for words and hashtags. This report type gives you an idea of the most common terms customers are using when talking about your product or service.
This report is compatible with the following visualization types:
- Table
- Trend (for top 10 words)
- Dual Axis (for top 10 words)
- Bar Graph (for top 10 words)
- Pie Chart (for top 10 words)
- Cloud
- Bubble (for top 10 words)
In Table view, the Words report contains the following columns:
- Total: Total number of records for this report. Attention: Records without text are only included in the report if the classification model it is based on is set to Include records without text in model.
- Word: Words in normalized form or hashtags. Hashtags are words or unspaced phrases prefixed with a hash symbol #. Attention: Only words that pass the project-wide word rank filter are displayed in reports.
- Volume: Number of records containing this word or hashtag.
- Volume %: Percentage of records containing this word or hashtag. This is calculated by dividing the number of records containing this word by the total number of records for this report. Attention: When the words volume is shown for a specific topic, volume percentage is calculated as a percentage of the whole model, not the chosen topic.
- Sentiment: Average sentiment of sentences containing this word.
- Additional metrics: Average values of additional metrics or satisfaction scores of records containing this word.
Associated Words Report
The Associated Words report displays metrics for Associated Words, or linguistic relationships found in the unstructured text. This report type gives you an idea of the most common topics and themes being discussed by customers.
This report is compatible with the following visualization types:
- Table
- Trend (for top 10 Associated Words)
- Dual Axis (for top 10 Associated Words)
- Bar Graph (for top 10 Associated Words)
- Pie Chart (for top 10 Associated Words)
- Cloud
- Bubble (for top 10 Associated Words)
In Table view, the Associated Words report contains the following columns:
- Total: Total number of records for this report. Attention: Records without text are only included into the report if the classification model it is based on is set to Include records without text in model.
- Associated Words: Associated words combinations. Attention: Only words that pass the project-wide word rank filter are displayed in reports.
- Volume: Number of records containing this combination.
- Volume %: Percentage of records containing this combination. This is calculated by dividing the number of records containing this combination by the total number of records for this report. Attention: When volume is shown for a specific topic, volume percentage is calculated as a percentage of the whole model, not the chosen topic.
- Sentiment: Average sentiment of sentences containing this combination.
- Additional metrics: Average values of additional metrics or satisfaction scores of records containing this combination.
That's great! Thank you for your feedback!
Thank you for your feedback!