
Results Dashboards Basic Overview
What's on this page
Qtip: To opt in to the new version of Results, navigate to the Results tab and select Try it now in the banner. To switch back to the old version of Results, click Settings, then go to the Themes tab and click Revert back.
About Results Dashboards
Results dashboards are designed to give you a quick and simple visualization of your survey results. Each question in your survey will have a visualization pre-made for it. However, there are many customization options available to you to help you build a dashboard to fit your needs.
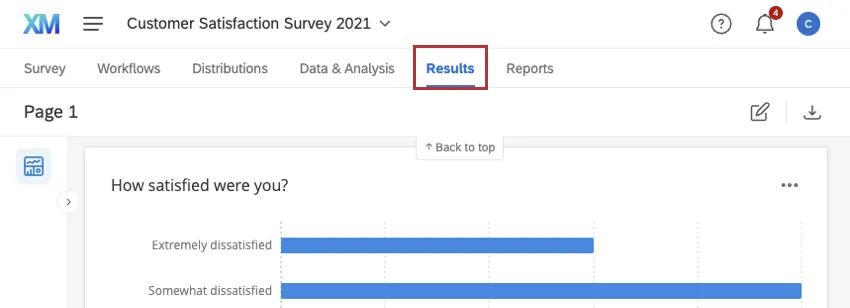
To access results dashboards, click Results in your survey project.
Types of Projects with Results Dashboards
Results Dashboards are available in a few different project types. This includes:

Qtip: This includes survey projects within programs, such as surveys within Brand programs.
Conjoint and MaxDiff projects
Qtip: Read more about Results functionality specific to Conjoints and MaxDiff.
- Many guided XM Solutions
Navigating Results Dashboards
The main features of results dashboards include:

Attention: These widgets are the same as the widgets available in CX dashboard projects.
Creating and Copying Results Dashboard Pages
If you want to create a new results dashboard page, you can make a copy of an existing page or start from scratch.
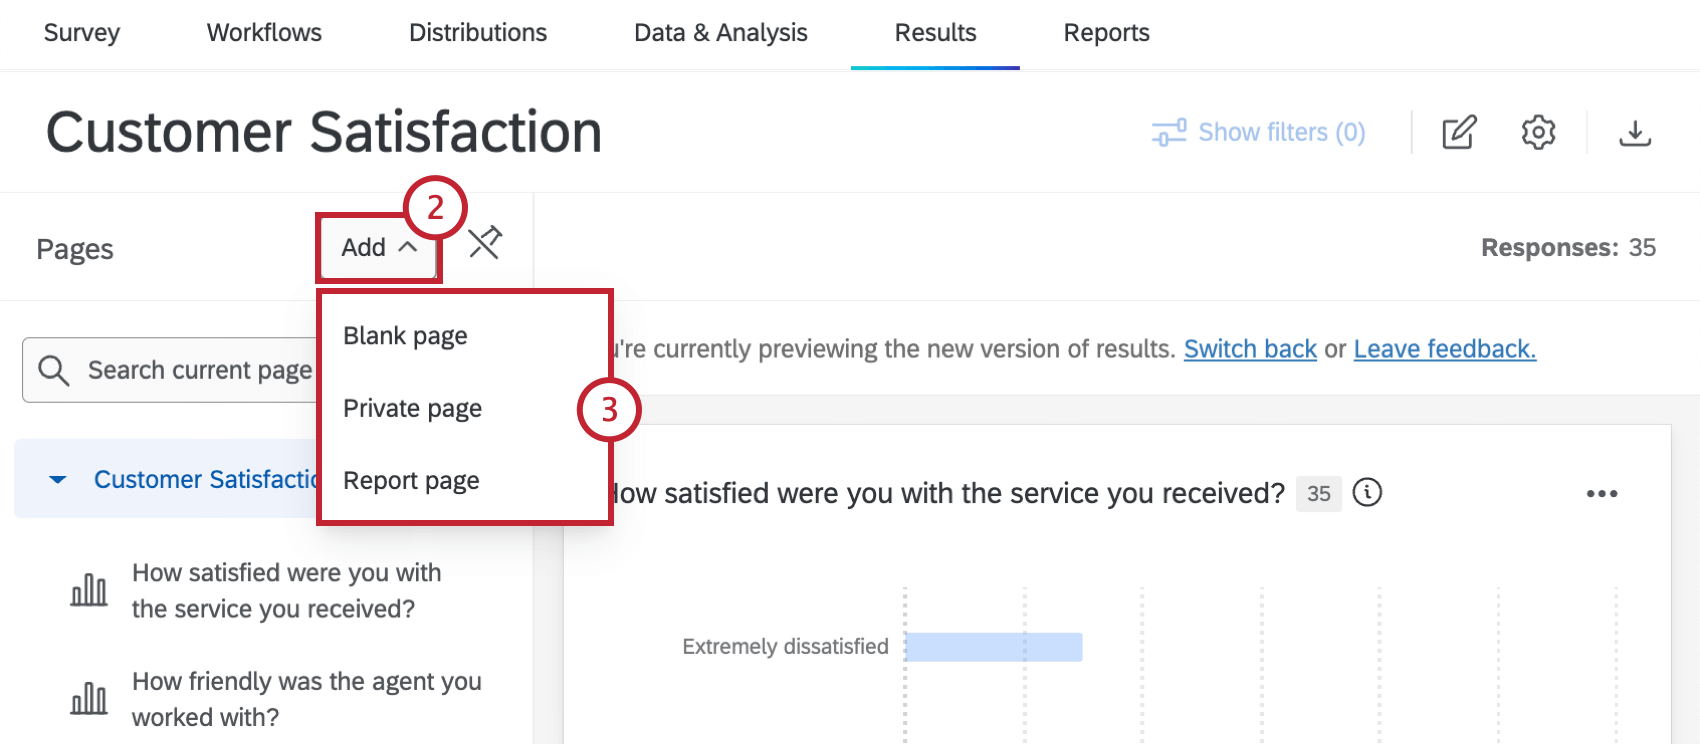
- Blank Page: Generates a new blank report page.
- Private Page: Generates a new blank private report page. This private page will only be visible to you.
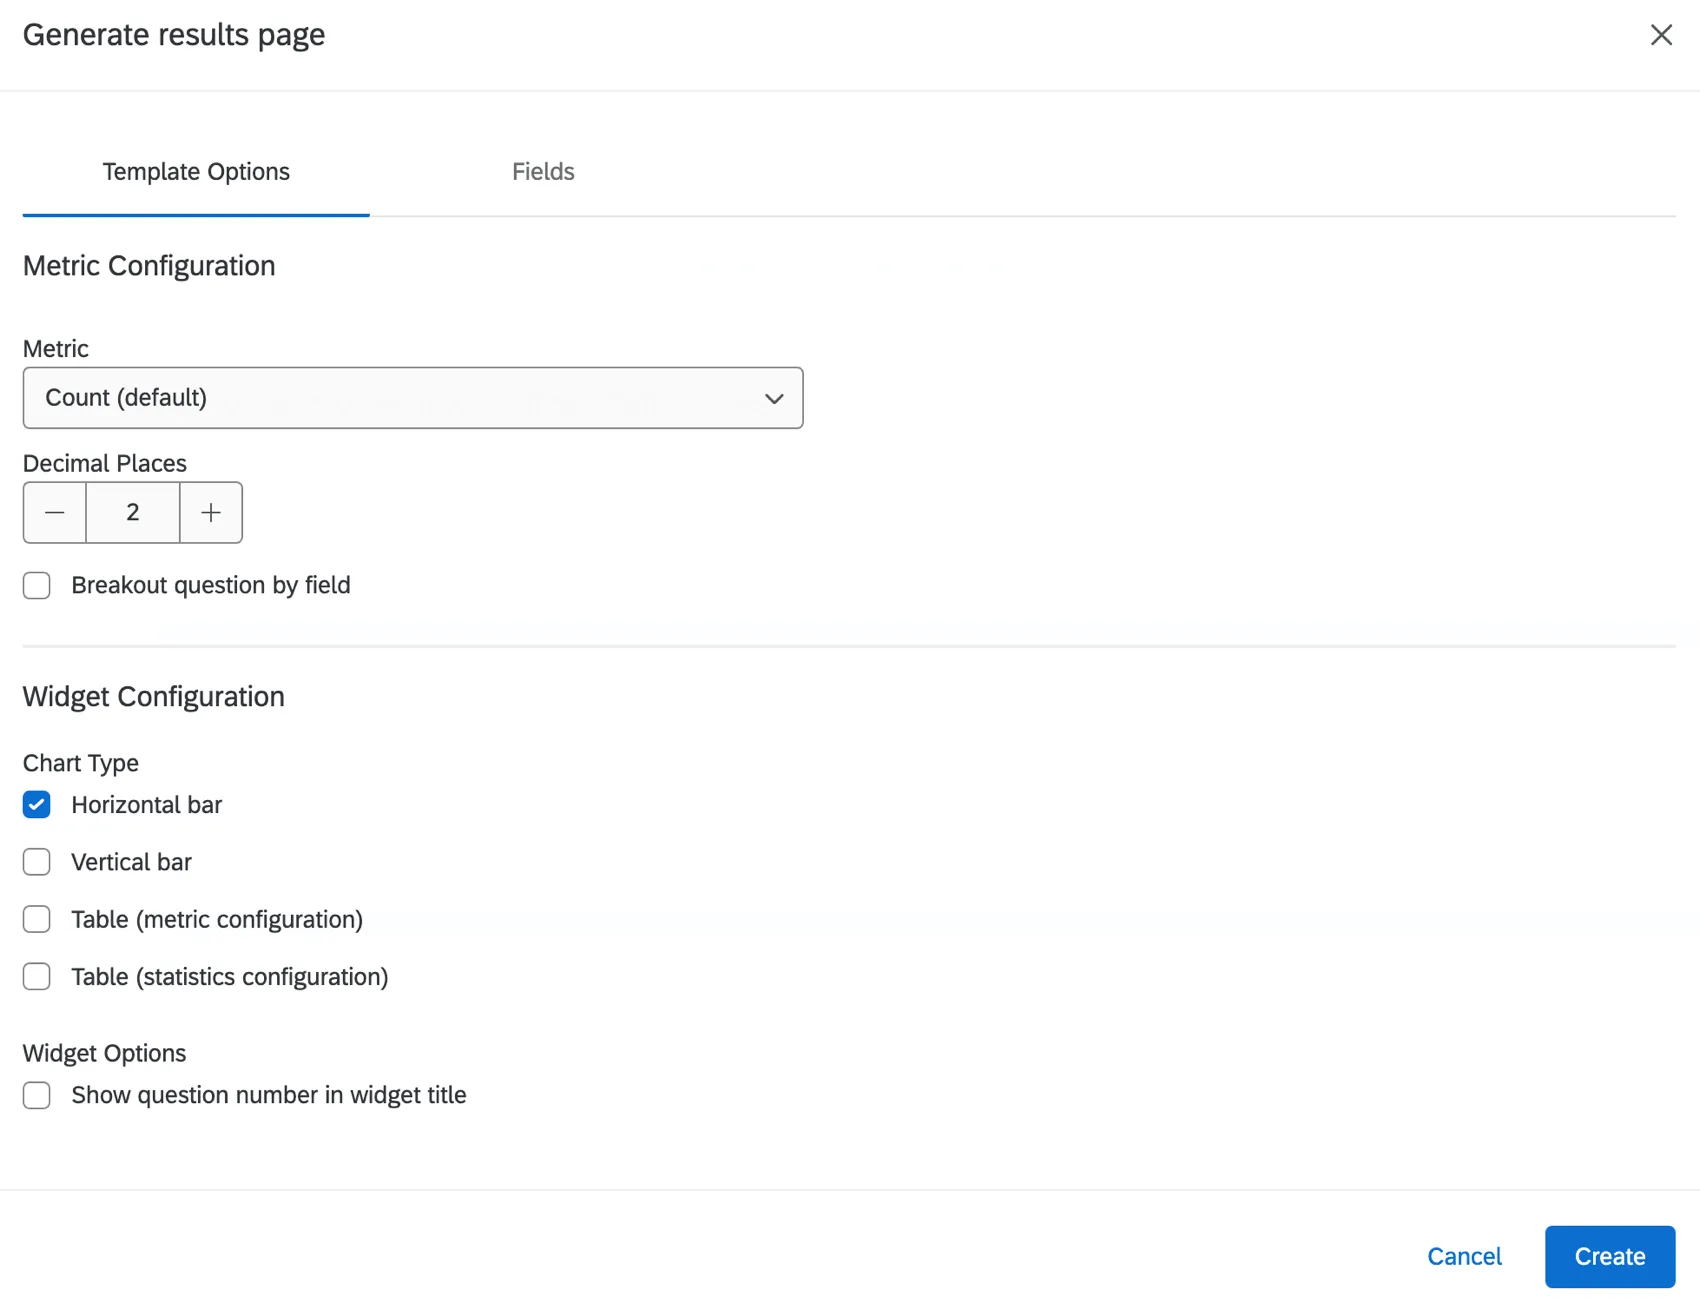
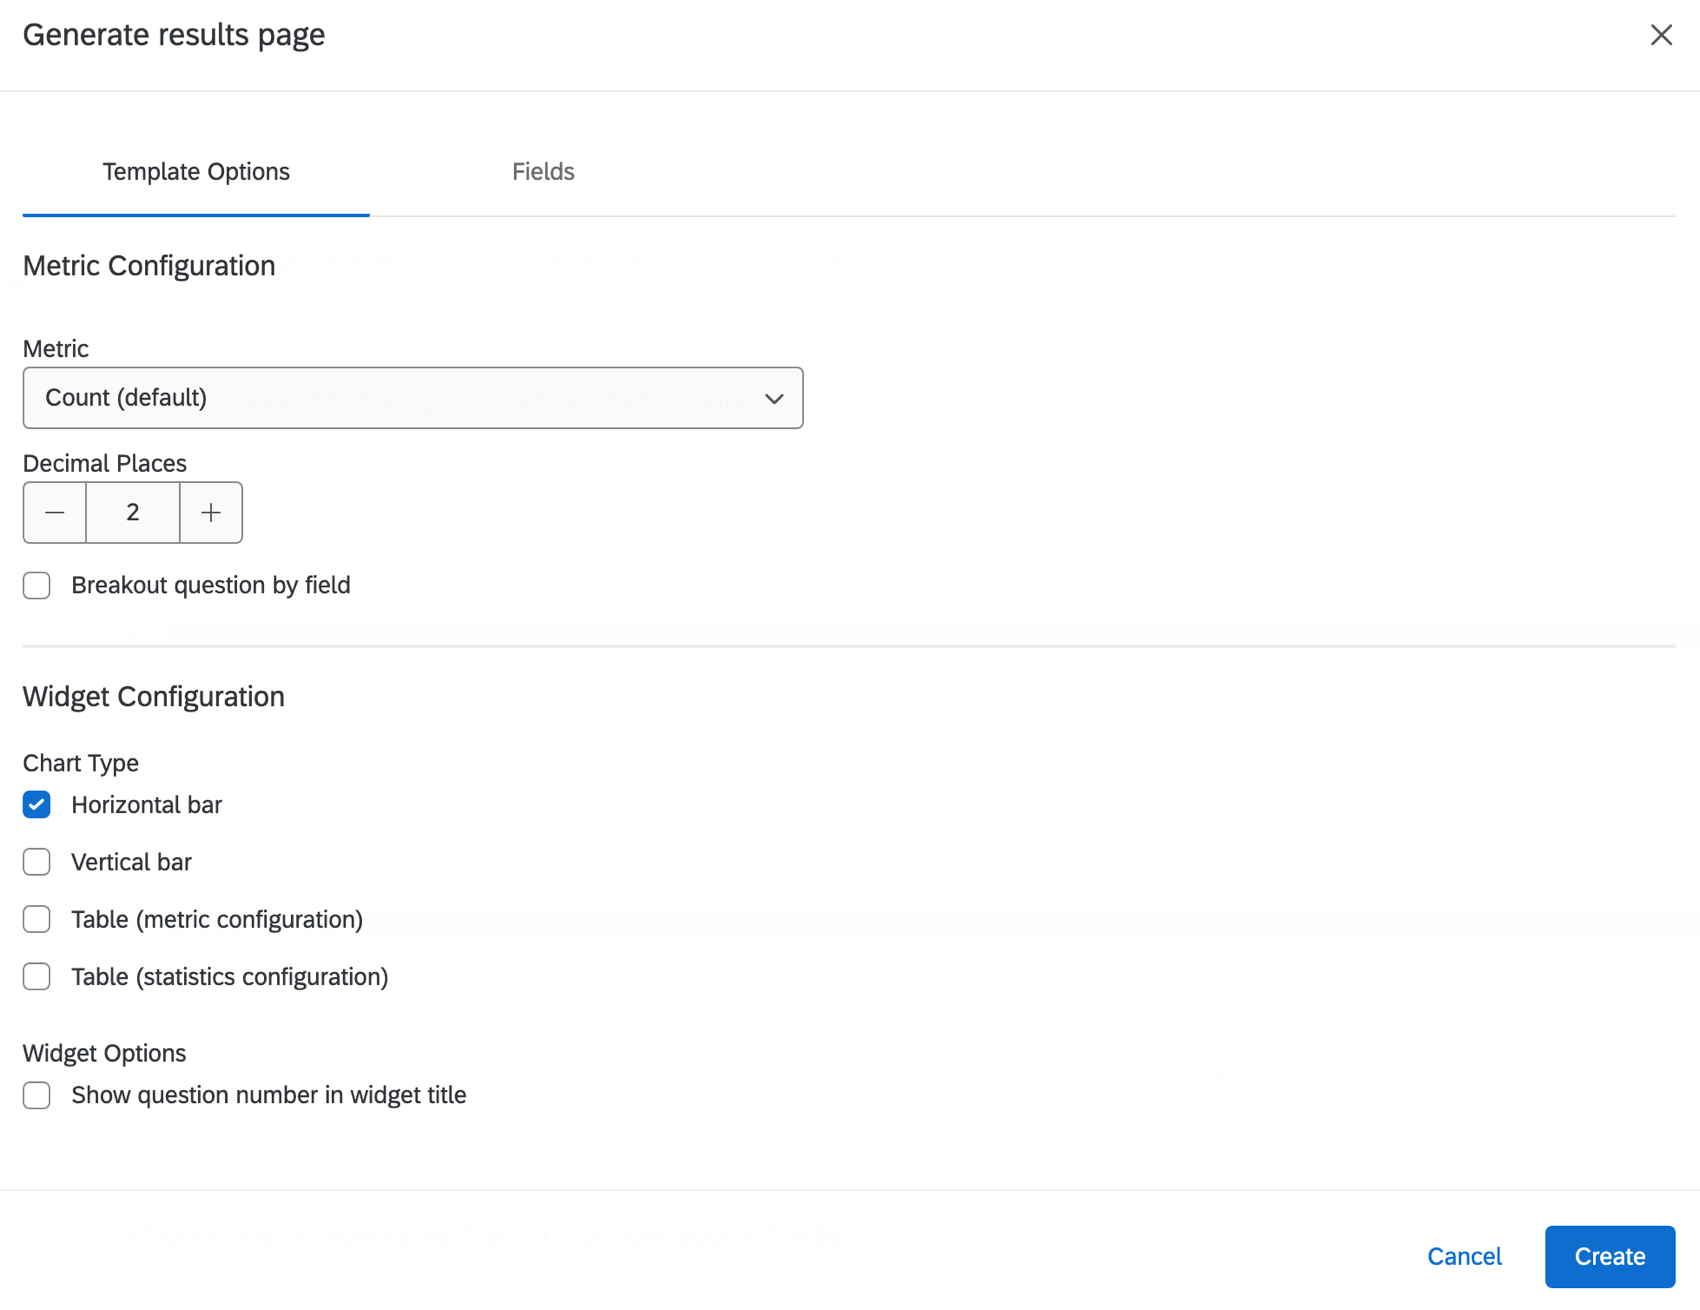
- Report Page: Generates a new default report page. Before the page is created you will have the opportunity to configure a default metric and chart type, as well as other customizations for the report page. For more information, see Customizing Report Pages.
Mapping Results Dashboard Fields
“Mapping” refers to editing the names and formats of the fields in your dashboard so you can choose how to best visualize that data. The type assigned to each field determines what kind of widget you can use with that data.
Example: The numeric feedback customers provide when they rate your product on a scale from 1-10 is different from the open feedback they provide where they tell you what thoughts and opinions they have. Numeric data is best suited to graphs and tables, but feedback should either be listed out in its entirety or have key terms displayed in a word cloud.
To learn more about field types and the widgets compatible with them, see Field Types & Widget Compatibility (CX). Since this is a CX Dashboards page, keep in mind that the list of widgets available in results dashboards may differ.
Survey questions have default mappings that cannot be edited. These default mappings can help you understand what widgets are compatible with each question. See Table: Default Field Types for Each Question.
If you want to edit other results dashboard fields, use the Field Editor in Data & Analysis. See Editing Custom Fields.
Editing Results Dashboard Pages and Adding Widgets
Visit the linked pages to learn more about editing results dashboards pages.
- Results Dashboard Page Types: This page describes the difference between default (i.e. report) pages, private pages, and blank pages.
- Creating Pages: Create new pages in your report where you have full control over the page content.
- Page Options: The page options that are used to rename, copy, and delete pages.
- Adding Widgets: Add widgets to your results dashboards pages.
Qtip: Once you perform analysis with Text iQ in your survey, you can report on these different fields in your results dashboards. For example, you can make a widget that shows how many responses each topic received. However, you cannot use dashboard Text iQ or Text iQ-specific widgets in results dashboards. Instead, see Text iQ in CX Dashboards.
Using Results Dashboard Filters
You can filter your entire results dashboard to remove data you don’t need. For example, in the below image, we filter our results to show dissatisfied customers since we are interested in analyzing only their data.
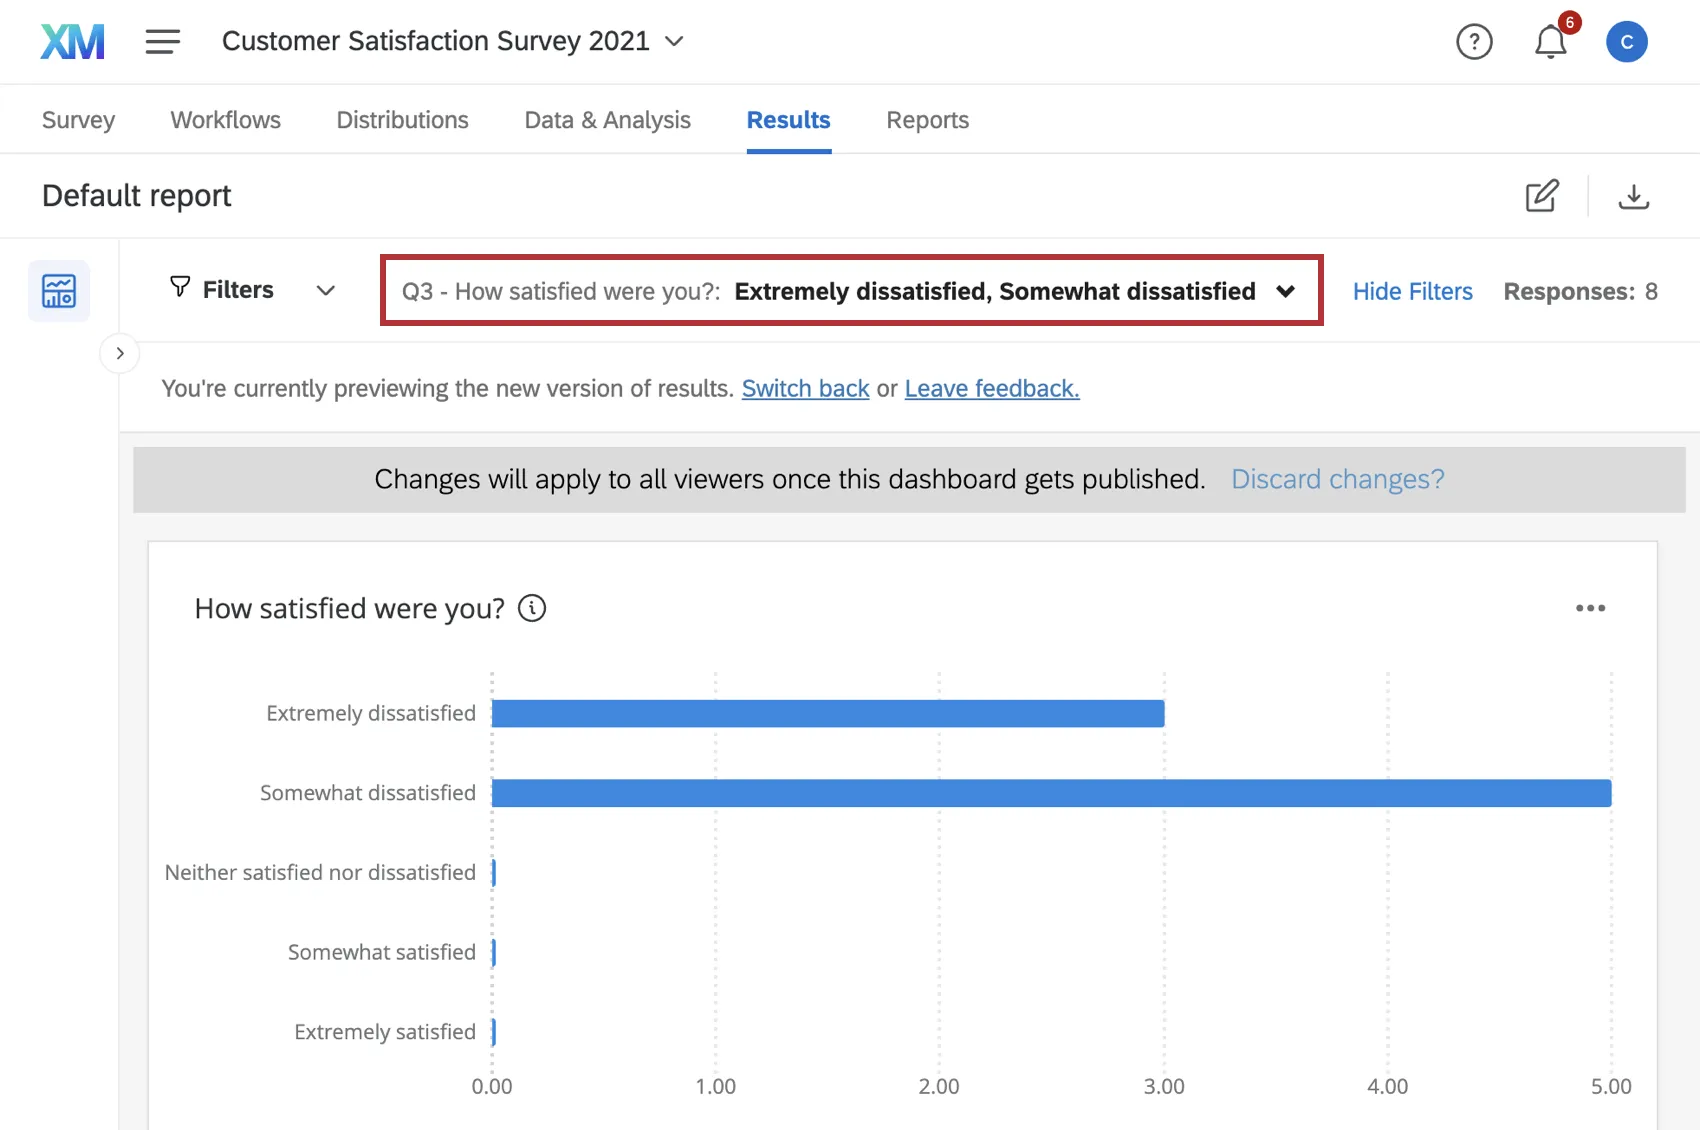
For help with results dashboard filters, see Filtering CX Dashboards. This page contains all the information you will need to filter your results dashboards, including how to add a filter, building filter logic, and saving and reusing filters. See also Advanced Dashboard Filters and Response Count Thresholds.
Configuring Results Dashboards Settings
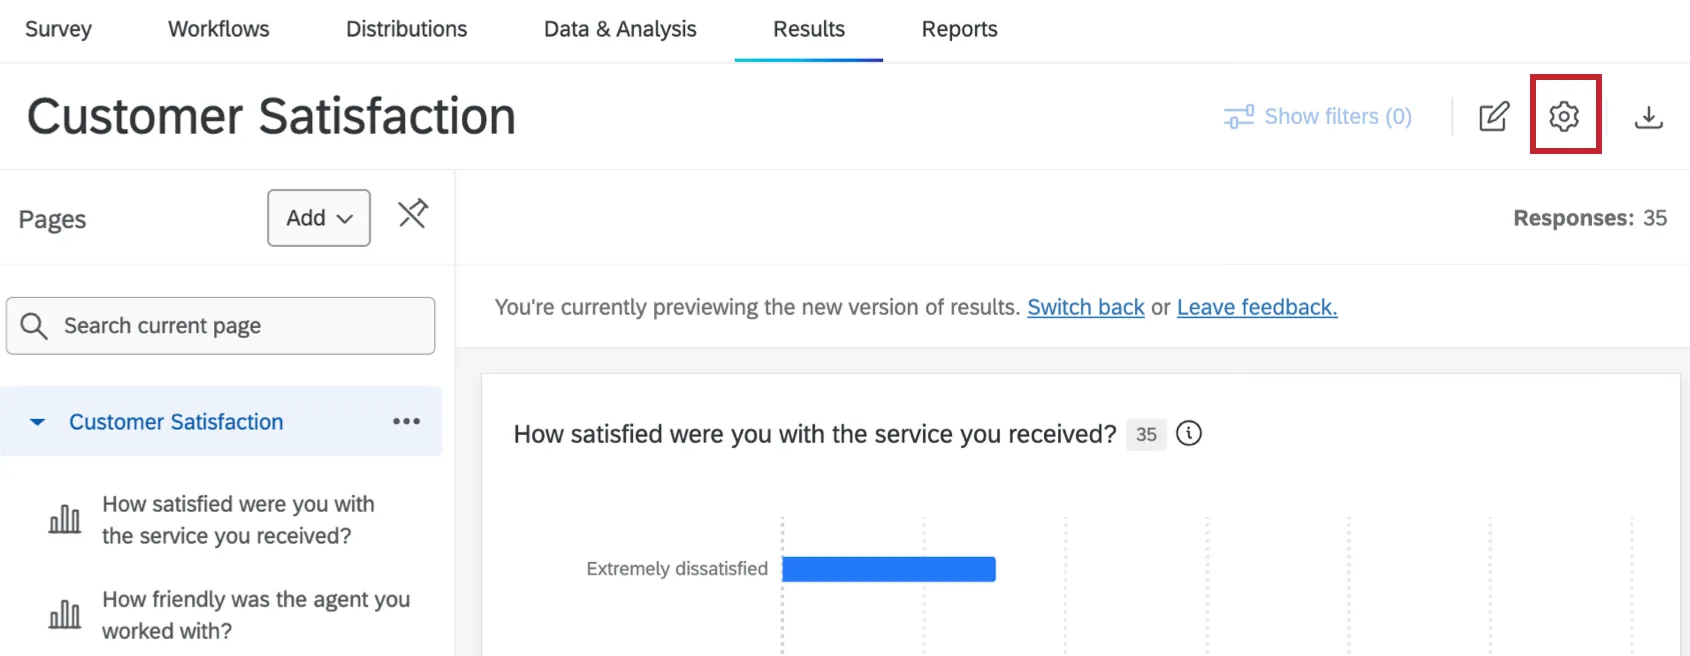
Click the Settings gear to adjust your dashboard settings. Right now, there are 2 options:
Qtip: To return to the dashboard itself, select the arrow next to Settings in the top left corner.
Translating Results Dashboards
The process for translating Results Dashboards labels and data is the same as for CX and EX dashboards. For more information and detailed instructions, see the following pages:
Translations for survey questions are also displayed if you change your account language to a language for which translations have been created. For information on translating the questions in your survey, see the Translate Survey support page.
Sharing Results Dashboards
There are several ways to share a results dashboard. Click the export dashboard button in the top-right and then select how you want to share your dashboard.
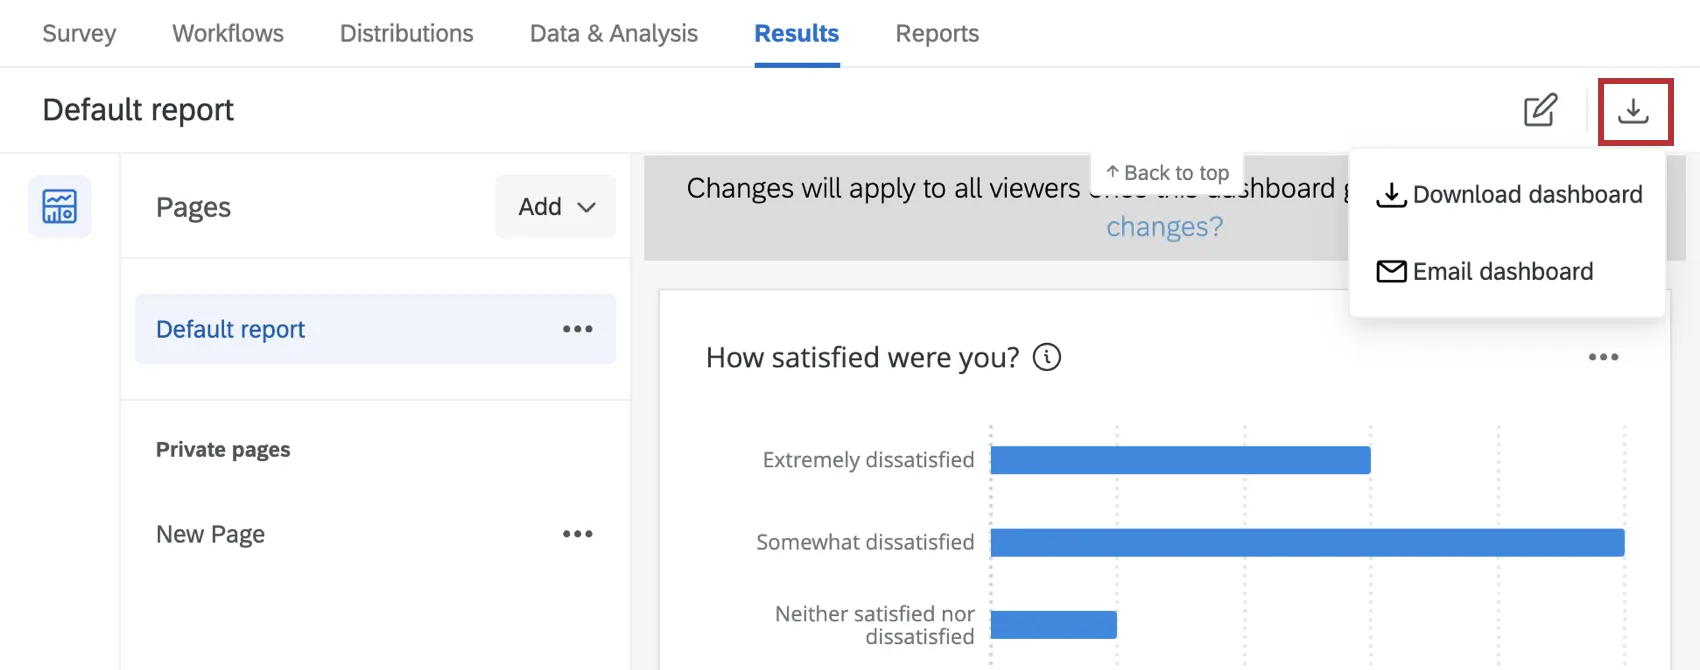
The methods for sharing your report include:
Download dashboard: Generate and share a digital copy of your results dashboard in a PDF, JPG, PPTX, DOCX, CSV, TSV, or XLSX format. See the Download Dashboard support page for more details.
- PDF: Widgets are included within the PDF file.
- JPG: Widgets are exported as a single image.
- PPTX: Widgets are saved as individual slides within the presentation. You can select Export supported widgets as editable to be able to edit them in Powerpoint.
- DOCX: Widgets are saved as images within a Word document.
- CSV: Data from each widget is saved to columns within the sheet.
- TSV: Data from each widget is saved as text within the file.
XLSX: Data from each widget is saved to columns within the sheet.
Qtip: When exporting data to XLSX, all data will export as text data, even if the data is different data type, such as a number or percentage. If you want to use this exported data for calculations or further data analysis in Excel, then you may need to change your data’s type.
Email dashboard: Send your results dashboard as an email attachment. See the Email Dashboard support page for more details.
FAQs
Will reports I built in Results-Reports be automatically transferred to Results Dashboards?
Will reports I built in Results-Reports be automatically transferred to Results Dashboards?
Will scheduled emails in Results-Reports transfer to Results Dashboards?
Will scheduled emails in Results-Reports transfer to Results Dashboards?
When will I lose access to Results-Reports?
When will I lose access to Results-Reports?
Results-Reports are currently estimated to be accessible until the end of Q3 2026, when they will be removed from the platform. Qualtrics may, in its sole discretion and without liability, change the timing of any product feature rollout, change the functionality for any in preview or in development product feature, or choose not to release a product feature or functionality for any reason or for no reason.
Does copying a project also copy the Results Dashboard?
Does copying a project also copy the Results Dashboard?
Yes. Copying a survey project also copies the Results Dashboards created to visualize data. Note that private report pages will not be copied.
That's great! Thank you for your feedback!
Thank you for your feedback!